Introduction

User Manual
ECOWatch energy management
Version No.: 2.37 Date 2025/09/29
Change Log
Version Date Revisor Remark
2.37.1 2025/09/29 xiaoyan.wen Initial English Version
Contents
- ECOWatch
[1.1 Introduction 5](#introduction)
[1.2 Target audience 5](#target-audience)
[1.3 ECOWatch energy management 6](#ecowatch-energy-management)
[1.3.1 Login 6](#login)
[1.3.2 Energy Monitor 7](#energy-monitor)
[1.3.3 Effect Analysis 21](#effect-analysis)
1.3.4 EnPIs Mgmt. 31
[1.3.5 Batch energy consumption 42](#batch-energy-consumption)
[1.3.6 Shift EnPIs 46](#shift-enpis)
[1.3.7 Improved Measures 49](#improved-measures)
[1.3.8 Report Management 55](#report-management)
[1.3.9 Automatic Recording 55](#automatic-recording)
[1.3.10 Allocation Management 73](#allocation-management)
[1.3.11 Data Rollback 89](#data-rollback)
[1.3.12 Data Monitor 92](#data-monitor)
[1.3.13 Basic Settings 121](#basic-settings)
[1.4 Public module 170](#public-module)
[1.4.1 ECOWatch Dark Mode Switching 170](#ecowatch-dark-mode-switching)
[1.4.2 Desk-Related Functions 170](#desk-related-functions)
[1.5 APM Data Warehouse Interface and Node Component Configuration 172](#apm-data-warehouse-interface-and-node-component-configuration)
[1.5.1 Configuration related to production data lakehouse tables and interface input components 172](#configuration-related-to-production-data-lakehouse-tables-and-interface-input-components)
[1.5.2 Batch data lakehouse table and interface input component configuration 190](#batch-data-lakehouse-table-and-interface-input-component-configuration)
[1.5.3 Batch Usage Component Configuration 203](#batch-usage-component-configuration)
- Time Schedule 208
[2.1 Public Services - Time Schedule 209](#public-services---time-schedule)
[2.1.1 Time Schedule Service Entry 209](#time-schedule-service-entry)
[2.1.2 Task Setting 209](#task-setting)
[2.1.3 Task Deploy 221](#task-deploy)
- MessagePush 224
[3.1 Introduction 224](#introduction-1)
[3.2 Login Message Push Notification Platform 224](#login-message-push-notification-platform)
[3.3 Email Configuration 226](#email-configuration)
[3.3.1 Notification Method Configuration 226](#notification-method-configuration)
[3.3.2 Group Member 229](#group-member)
[3.4 Enterprise WeChat Notification Configuration 231](#enterprise-wechat-notification-configuration)
[3.4.1 Notification method configuration 231](#notification-method-configuration-1)
[3.4.2 Notification Group Configuration 231](#notification-group-configuration)
[3.5 DingTalk Notification Configuration 234](#dingtalk-notification-configuration)
[3.5.1 Notification Method Configuration 234](#notification-method-configuration-2)
[3.5.2 Notification Group Configuration 234](#notification-group-configuration-1)
[3.6 Feishu Notification Configuration 240](#feishu-notification-configuration)
[3.6.1 Notification Method Configuration 240](#notification-method-configuration-3)
[3.6.2 Notification Group Configuration 240](#notification-group-configuration-2)
[3.7 WebHook Notification Configuration 245](#webhook-notification-configuration)
[3.7.1 Notification Method Configuration 245](#notification-method-configuration-4)
[3.7.2 Third-party interface configuration 245](#third-party-interface-configuration)
ECOWatch
Introduction
Advantech energy management system (iEMS/ECOWatch) records and analyzes energy usage data such as water, electricity, and gas to provide real-time monitoring, analysis, and performance assessment of energy usage for enterprises.
ECOWatch is dedicated to serving enterprises through scientific decision-making, lean management, and intelligent energy utilization. It establishes and operates an energy management system in the principle of ISO50001 energy management standard to help enterprises promptly identify blind spots in energy management, tap energy-saving potential, enhance their energy management level, and provide support for efficient energy utilization.
Target audience
The manual is intended for ECOWatch users, with a primary focus on illustrating operational procedures.
ECOWatch energy management
Login
- Open browser (Chrome browser only),And the version must be V110 or higher), enter the login address. The login address can be inquired from factory management personnel or IT technicians, and the login page is shown in the figure below.
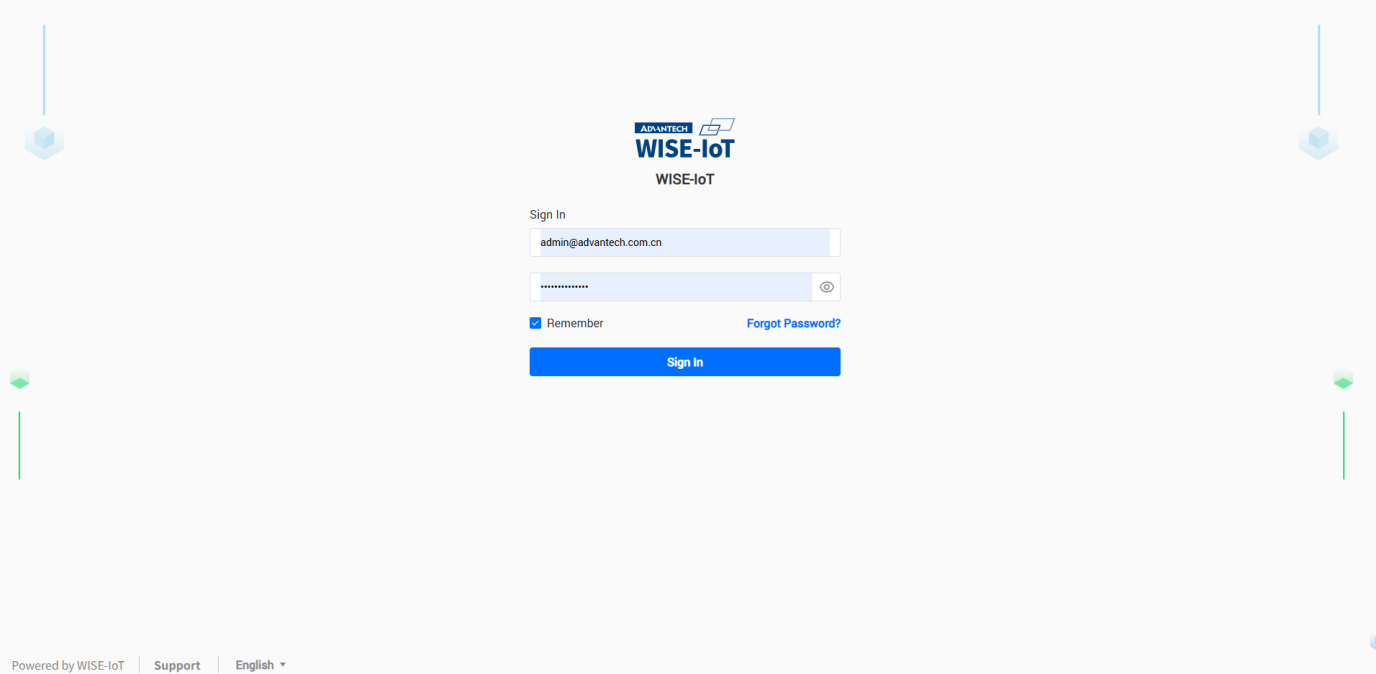
- Enter username XXXX, password XXXX, click [Login] to enter Org Selection Page。
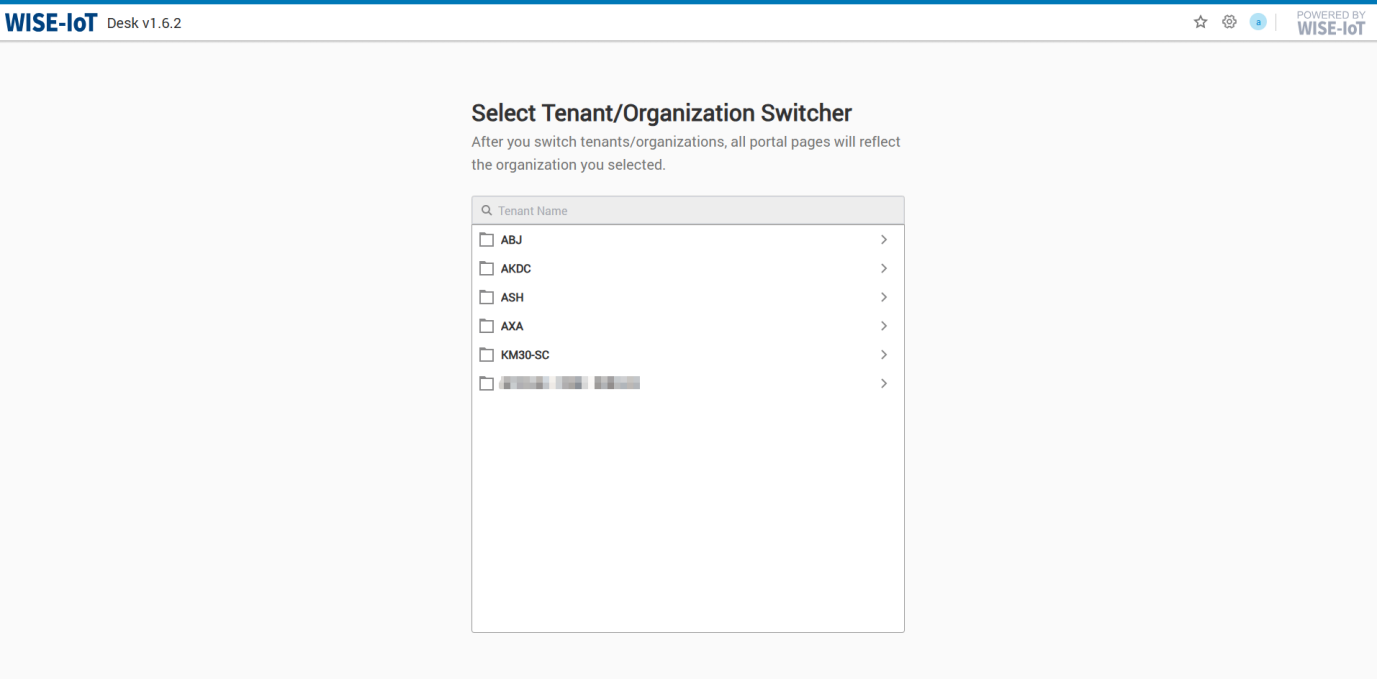
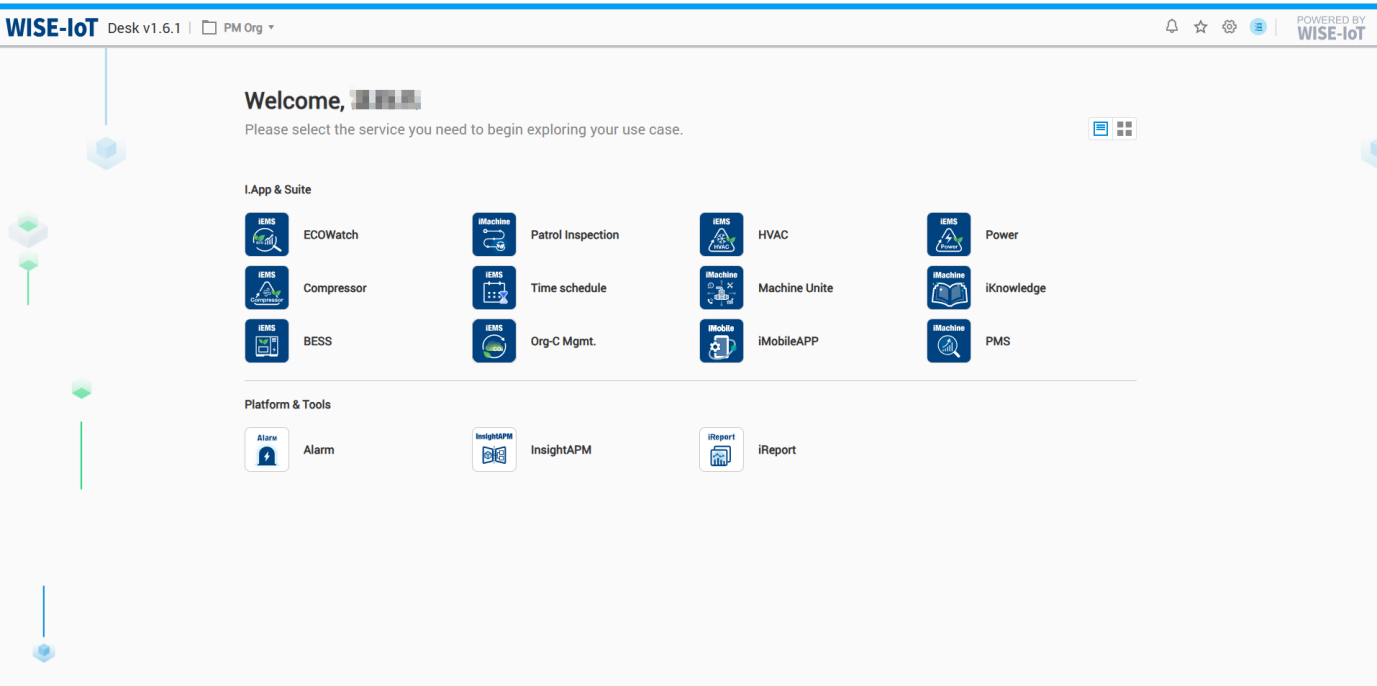
- After selecting an org, enter the application management page.Click [ECOWatch],Access the ECOWatch page, as shown below:
Energy Monitor
Item Summary
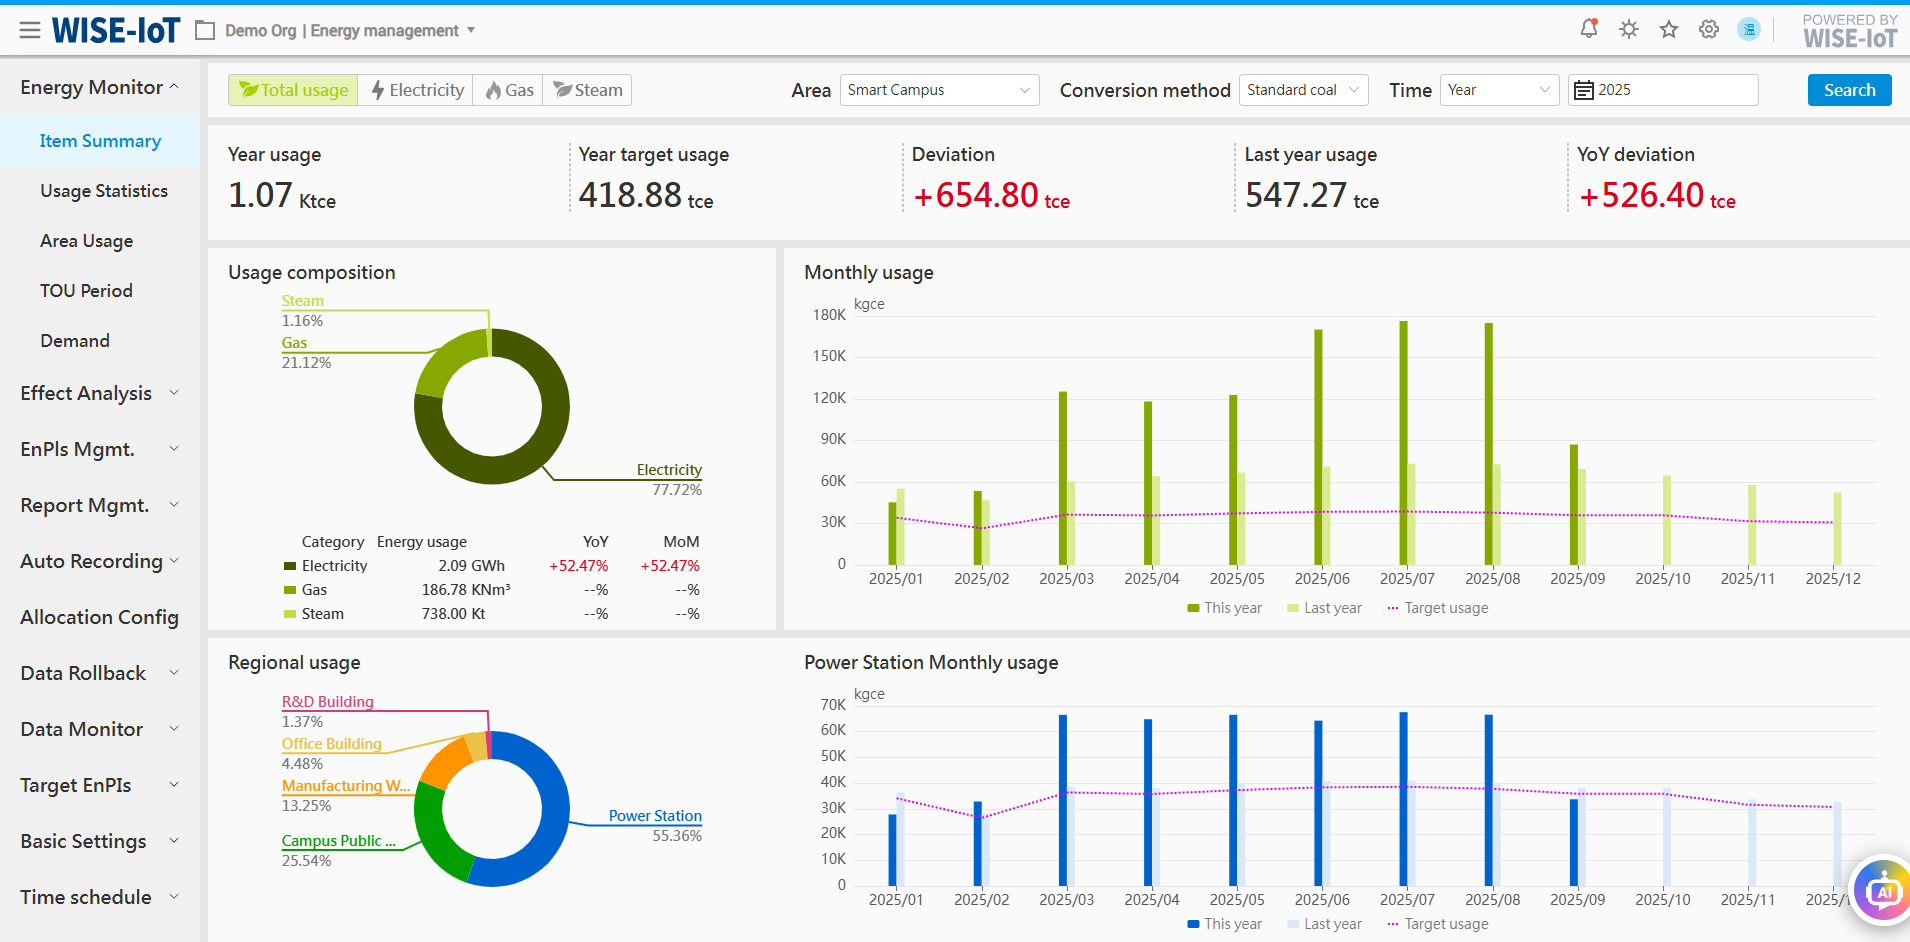
Click Energy Monitor- > Item Summary to go to the Energy Type Overview module.
The module provides a holistic view of an enterprise's energy usage, displaying overall energy usage and usage by energy type. The energy medium statistics visible to users vary depending on the node in the interface.
- Energy type switching
(1) Enable switching of statistical data for comprehensive energy usage and various energy types;
(2) The interface displays all energy types configured for the user's organization, such as electricity, water, natural gas, steam, diesel, etc.;
- Overall energy usage
(1) The overall energy usage supports conversion statistics in multiple equivalent units, including coal equivalent, carbon equivalent, thermal equivalent, standard electricity, and oil equivalent;
(2) The top-right corner features time selectors allowing data queries by year/month/day;
(3) Overall energy usage: Display the actual usage, target usage, target usage variance, usage during the same period last year and year-over-year usage variance during the selected time period.
(4) Usage composition: The system converts all energy types into standardized units and calculates the proportional share of each type.
※Energy types refer to those included in total energy usage calculation, thus compressed air converted from electricity is excluded from the calculation.
(5) Usage trend:
-
The current year is displayed by 12 months; the current month is displayed by the number of days in the month; the current day is displayed by 24 hours.
-
Provide year-on-year usage comparison.
-
Please refer to Energy EnPIs for target energy usage setting.
(6) Area usage:
-
Statistically analyze and display the usage proportion of secondary areas under the selected area.
-
When the mouse hovers over a secondary area, usage trend will be displayed on the right.
-
Click a area of the pie chart to view its usage trend on the right.
- Sub-item energy usage
(1) The user can select year/month/day to query data in the top right corner.
(2) Overall energy usage:
-
Display the actual usage, target usage, target usage variance, usage during the same period last year and year-over-year usage variance of the selected energy type during the selected time period:
-
"Electricity" tab page:
-
Display the real-time electricity demand. Users can navigate to Page Configuration > Single Page Configuration > Category Overview to hide it.
-
For area with PV systems configured, this area displays the PV output and its share in total energy for the selected timeframe.
(3) Sub-item usage composition: Display the share of primary sub-items of the selected energy type.
(4) Usage trend:
-
The current year is displayed by 12 months; the current month is displayed by the number of days in the month; the current day is displayed by 24 hours.
-
Provide year-on-year usage comparison.
-
Please refer to Energy EnPIs for target energy usage setting.
(5) Area usage:
-
Statistically analyze and display the usage proportion of secondary areas under the selected area.
-
When the mouse hovers over a secondary area, usage trend will be displayed on the right.
-
Click an area of the pie chart to view its usage trend on the right.
(6) Top 10 energy-using device of the month
- Statistically analyze and display the information of the top 30 energy-using device in the area.
(Note: The value of device node's StaticProperty "machine" should be 1. If a device should be excluded from ranking, go to the device node in the Meter Asset Group of the APM System, and set its static attribute "machine" to 0 or any non-1 numeric value.
The user can hide this information in Page Configuration > Single Page Configuration > Type Overview.
Usage Statistics
Click Energy Monitor > Usage Statistics to go to the Energy Usage Statistics module. Energy usage statistics include itemized energy usage statistics and total energy usage statistics.
Itemized energy consumption statistics
In the interface, select "Itemized Energy Usage" as the statistical method to view energy usage (electricity, water, gas, etc.) for each area, workshop, or department. It also provides YoY and MoM energy usage comparisons.
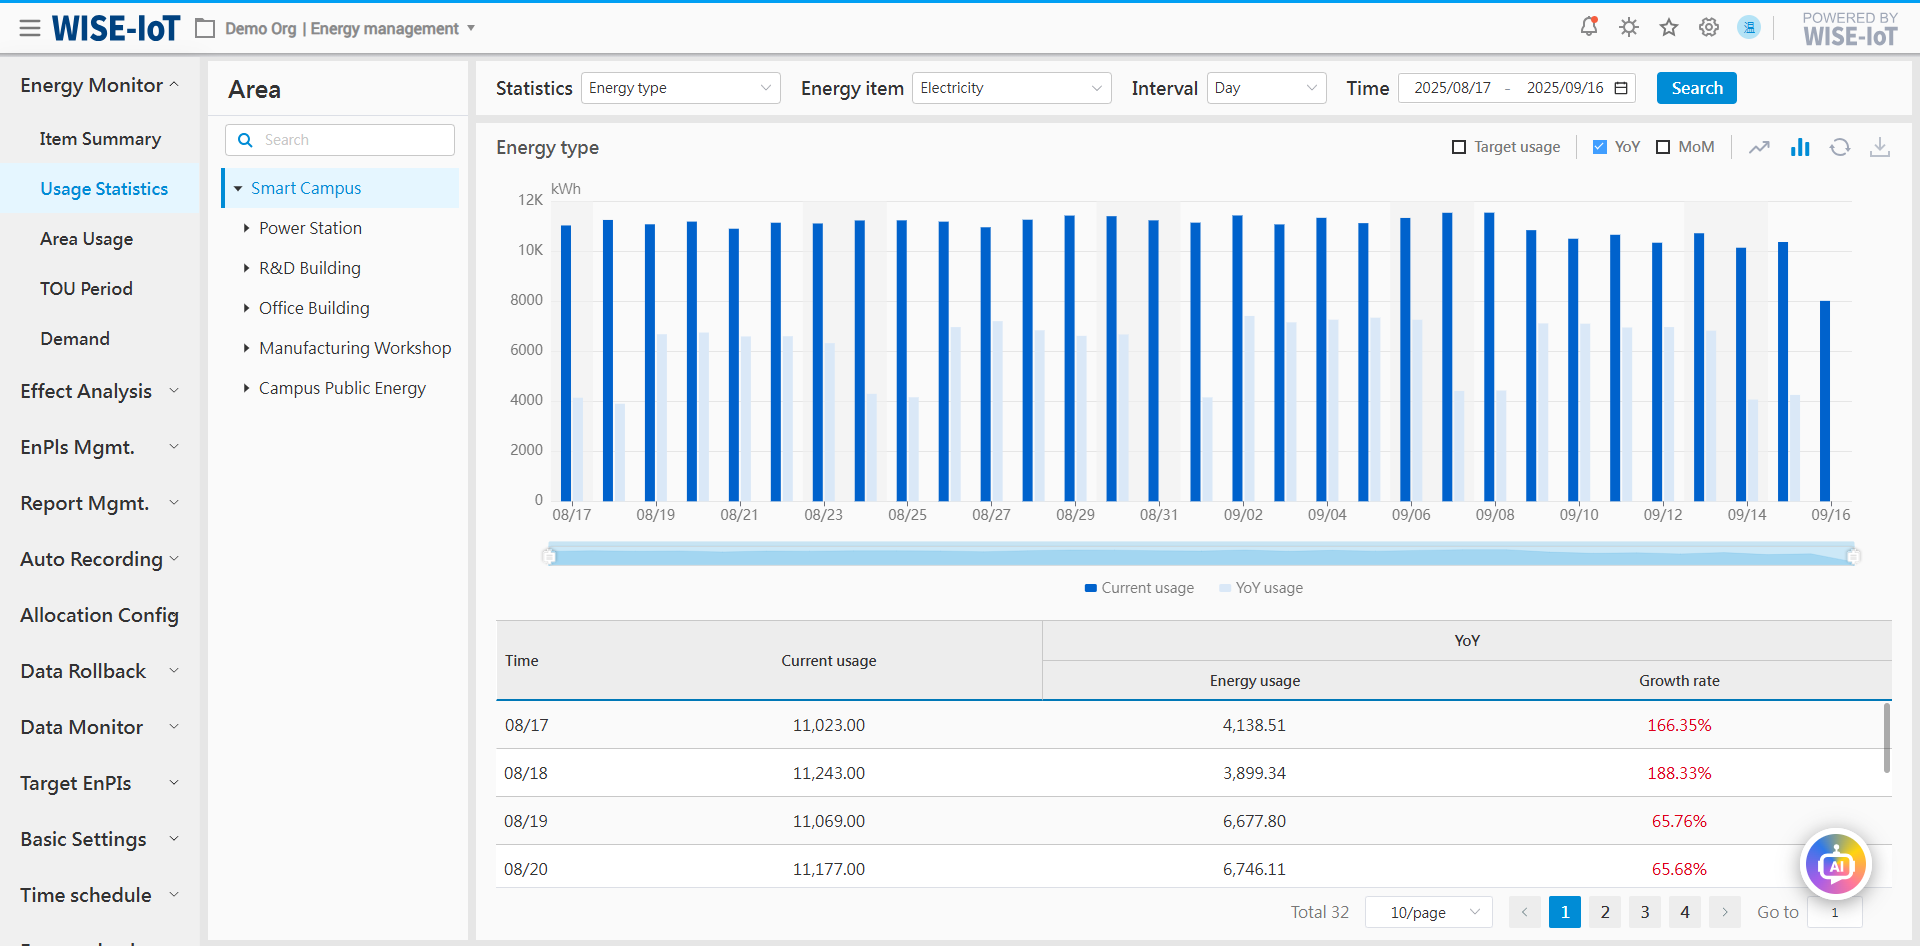
- Filter area
(1) Statistical method: Select itemized energy usage;
(2) Types and items: Energy medium such as electricity, water, steam;
(3) Support different time granularity: Year, month, day, hour and minute.
- Graph section
(1) Display the energy usage for a specific time period in a certain area.
(2) Check "YoY" or "MoM" to view details:
※ YoY Analysis: Refer to comparative analysis of usage between the selected time period in the filter criteria and the same period from the previous year.
※ MoM Analysis: Refer to comparative analysis of usage between the selected time period in the filter criteria and the immediately preceding period.
(3) Check "Target Usage" to compare an area's actual usage against its planned usage.
※See Energy EnPIs for target energy usage setting.
(4) Data visualization formats: Line charts or bar charts
(5) Click ![]() to export data in Excel.
to export data in Excel.
- Statistics area
Statistically analyze and display usage for each period and YoY/MoM usage comparison.
When "Overall Energy Usage" is selected as the statistical method, users can view energy usage (electricity, water, gas, etc.) for each area, workshop, or department converted into equivalent values such as coal equivalent, carbon equivalent, and standard electricity, and YoY or MoM usage comparisons can be conducted for the same type of energy.
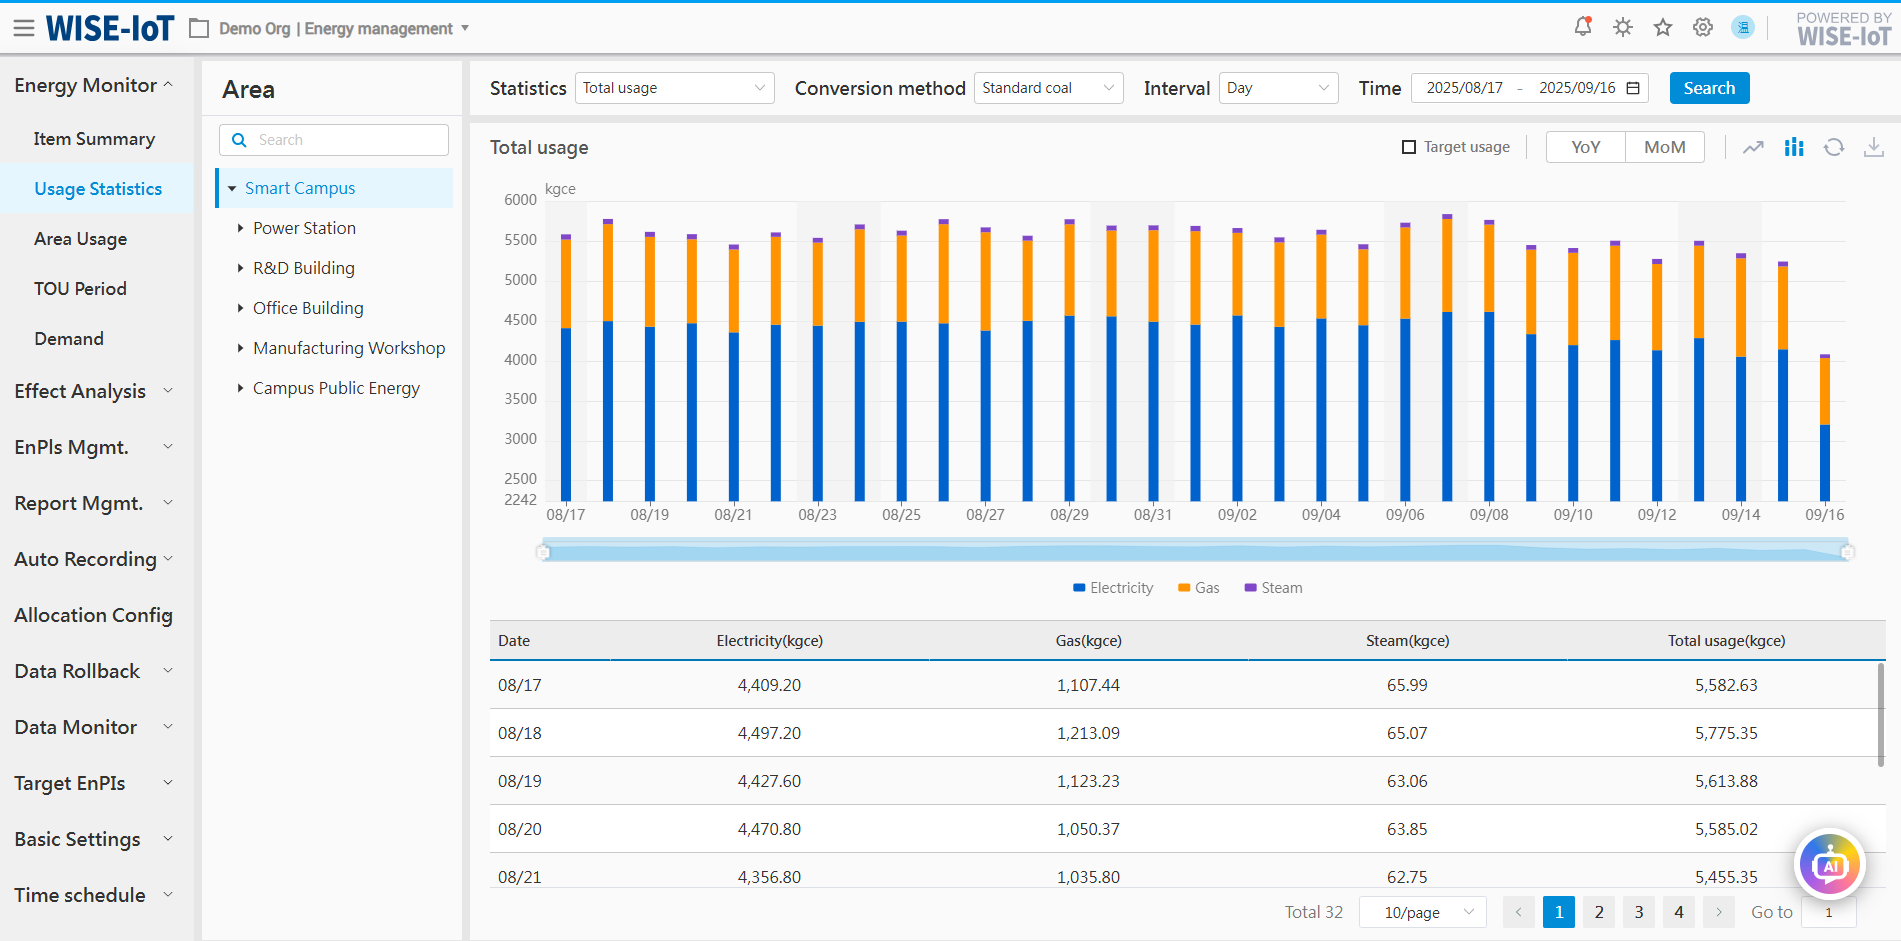
- Filter area
In total energy usage mode, energy usage of each area will be uniformly converted into energy units for display.
(1) Conversion methods: Coal equivalent, carbon equivalent, standard electricity, thermal equivalent, and oil equivalent are used for calculation. Their display depends on the setting of energy conversion coefficient.
※ Please refer to Basic Settings - Energy Conversion Coefficient module for energy conversion coefficient setting,.
(2) Area & time: Data can be viewed at different time granularities.
- Graph section
(1) Present data in line charts and stacked charts.
(2) Click "![]() " to export data in Excel.
" to export data in Excel.
(3) The overall energy usage and benchmark values can be compared and analyzed.
※ The overall energy usage benchmark value is determined by the Energy EnPIs for each type of energy at each node, please refer to the Energy EnPIs.
(4) Provide YOY or MOM comparison.
※ YoY Analysis: Refer to comparative analysis of usage between the selected time period in the filter criteria and the same period from the previous year.
※ MoM Analysis: Refer to comparative analysis of usage data between the selected time period in the filter criteria and the immediately preceding period.
- Table area
The system calculates YoY or MoM growth rates of energy usage, and displays the energy usage using red and green colors.
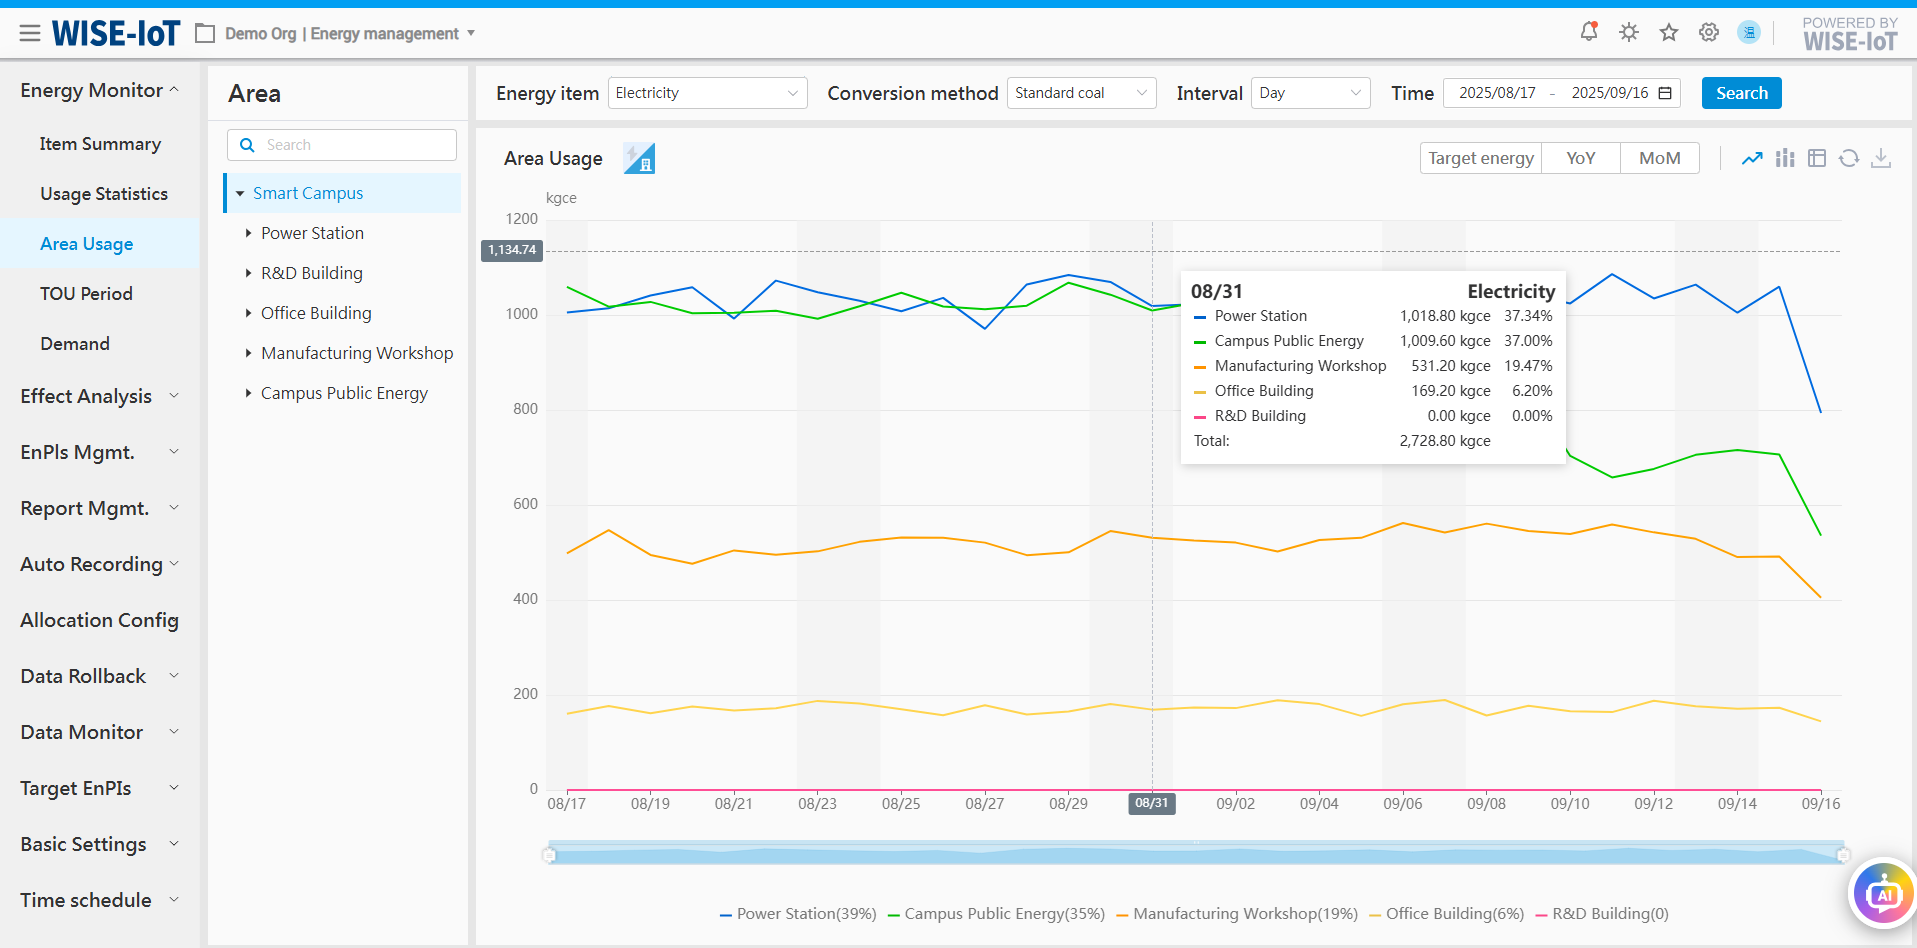
Area Usage
Click Energy Monitor > Area Usage. Area energy usage includes itemized energy usage analysis and area energy usage analysis.
Itemized Energy Usage
Itemized energy usage analysis: Display data by energy type and structure.
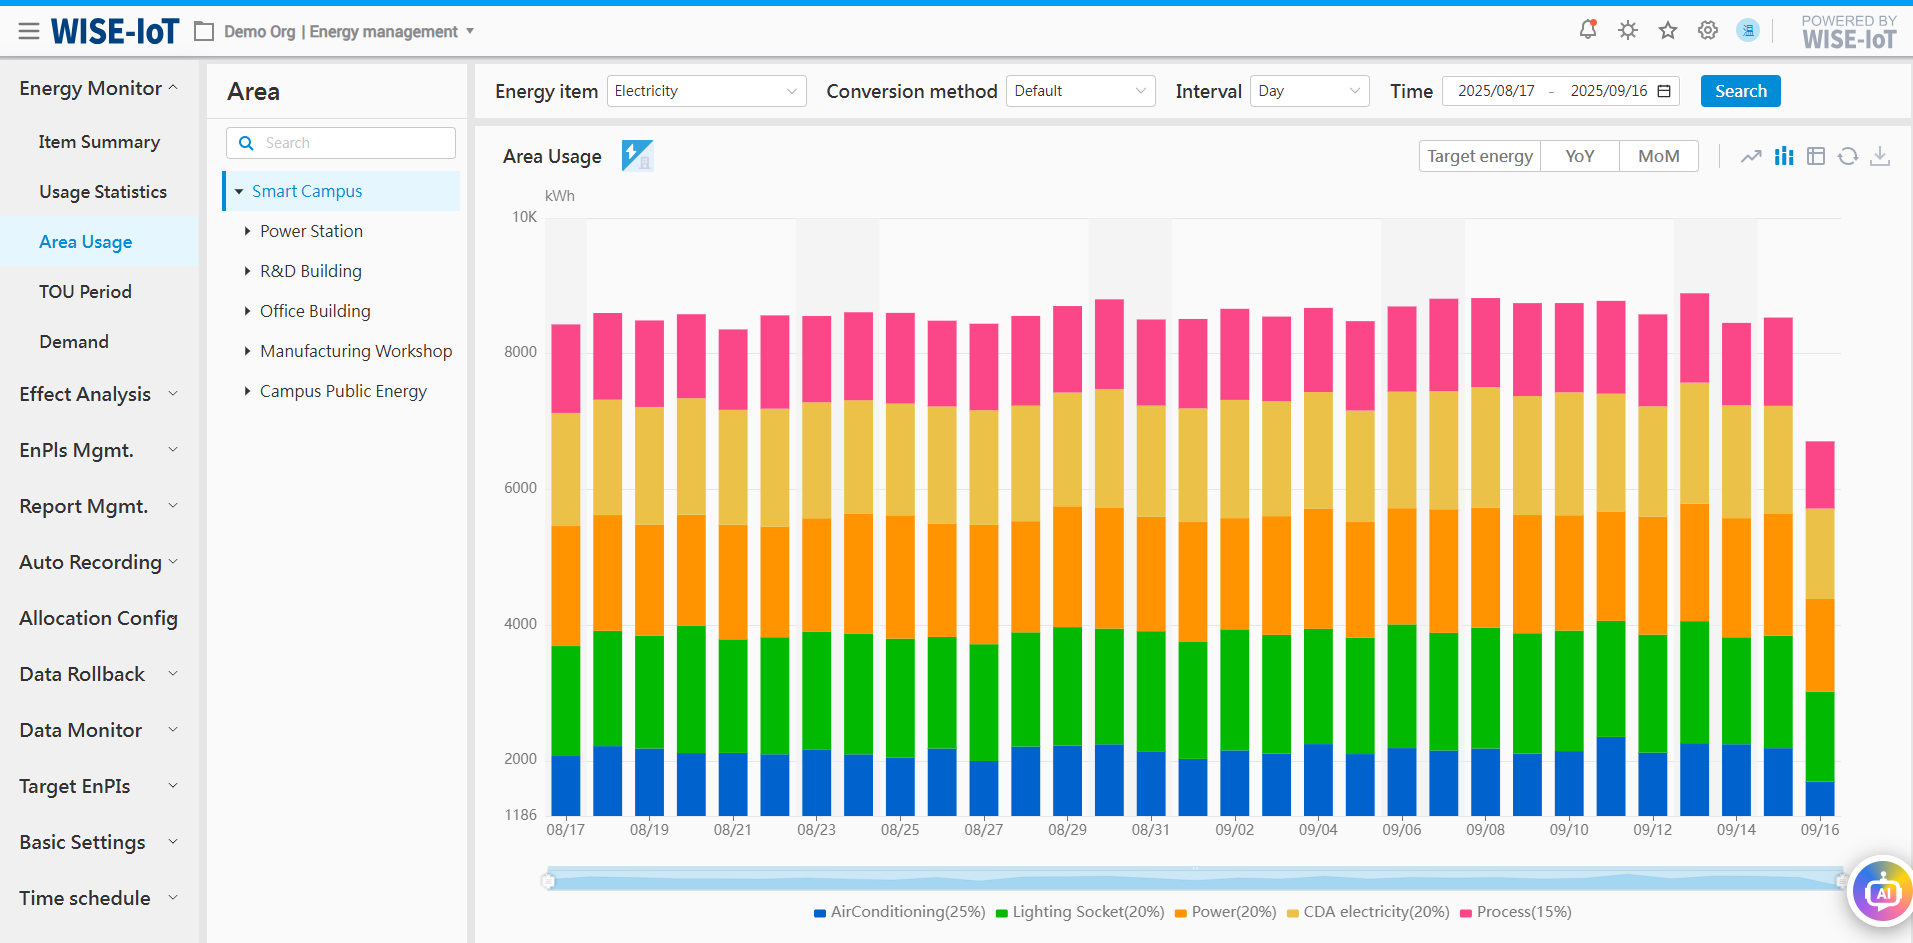
- Filter area
(1) Energy can be selected by types or sub-items. After selection, the graph will display subset information for the energy type or sub-item;
(2) Conversion method: Provide calculation indicators such as coal equivalent, carbon equivalent, etc.;
(3) Area & time: Enable data viewing across different time scales.
- Energy usage analysis type switching
The current interface displays the itemized energy usage analysis. After clicking the switch button, the interface switches to area energy usage analysis. Clicking again will return to the itemized energy usage analysis interface.
- Graph section
(1) Data can be viewed via line charts, stacked charts, tables, etc.;
(2) Data can be exported in Excel;
(3) Click the bar chart to view usage of the sub-item's subset.
Area Energy Usage Analysis
Click ![]() to switch from the Itemized Energy Usage Analysis to Area Energy Usage Analysis.
to switch from the Itemized Energy Usage Analysis to Area Energy Usage Analysis.
-
It displays the energy usage trend of a certain area in terms of year, month, day, hour, and minute, etc.
-
The user can view data via line charts, stacked charts, tables, etc.
-
Data from line charts, bar charts and tables can be exported in Excel.
-
Click the coordinate point of a certain area at a certain time to view its sub-areas or device energy usage.
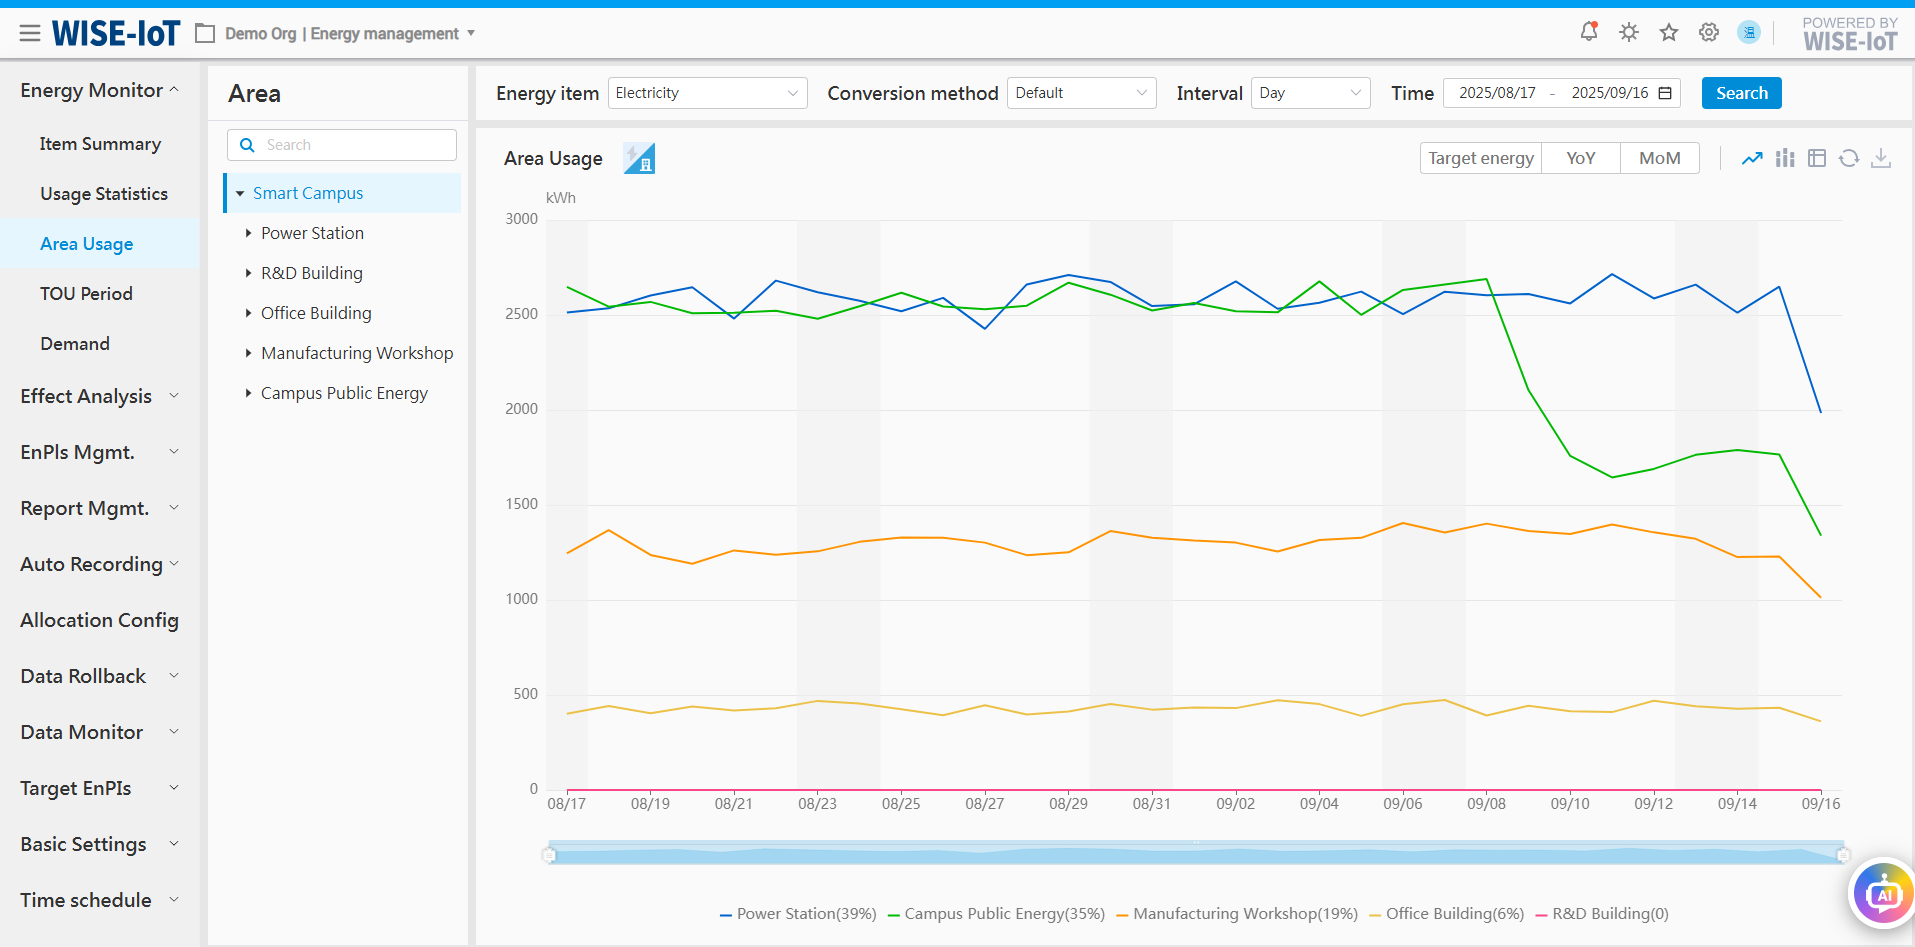
- Provides data conversion methods such as standard coal equivalent and CO2 equivalent. For example, select "standard coal equivalent" in the filter's conversion method, click the Query button to convert electricity into coal equivalent to compare the data.
TOU Period analysis
TOU Period Data Acquisition Method
ECOWatch supports TOU Period(Super-peak,On-peak,Mid-peak,off-peak) data statistics in two ways.
(1) If the user does not use a multi-rate meter which provides critical peak, peak, flat, and valley tag information, the system will calculate their respective energy usage based on the E tag and time period of the main meter.
(2) If the user uses a multi-rate meter with critical peak, peak, flat, and valley tag information, the cumulative energy usage for different time periods can be calculated respectively based on the peak, flat, and valley information in the multi-rate meter.
Please decide the method before using this function. The specific setting method can be found in ECOWatch Configuration Manual.
Click Energy Monitor > TOU Period to go to the Analysis module.
The module statistically analyzes and displays the peak, flat and valley electricity usage information of each area, as well as their electricity usage and cost proportions.
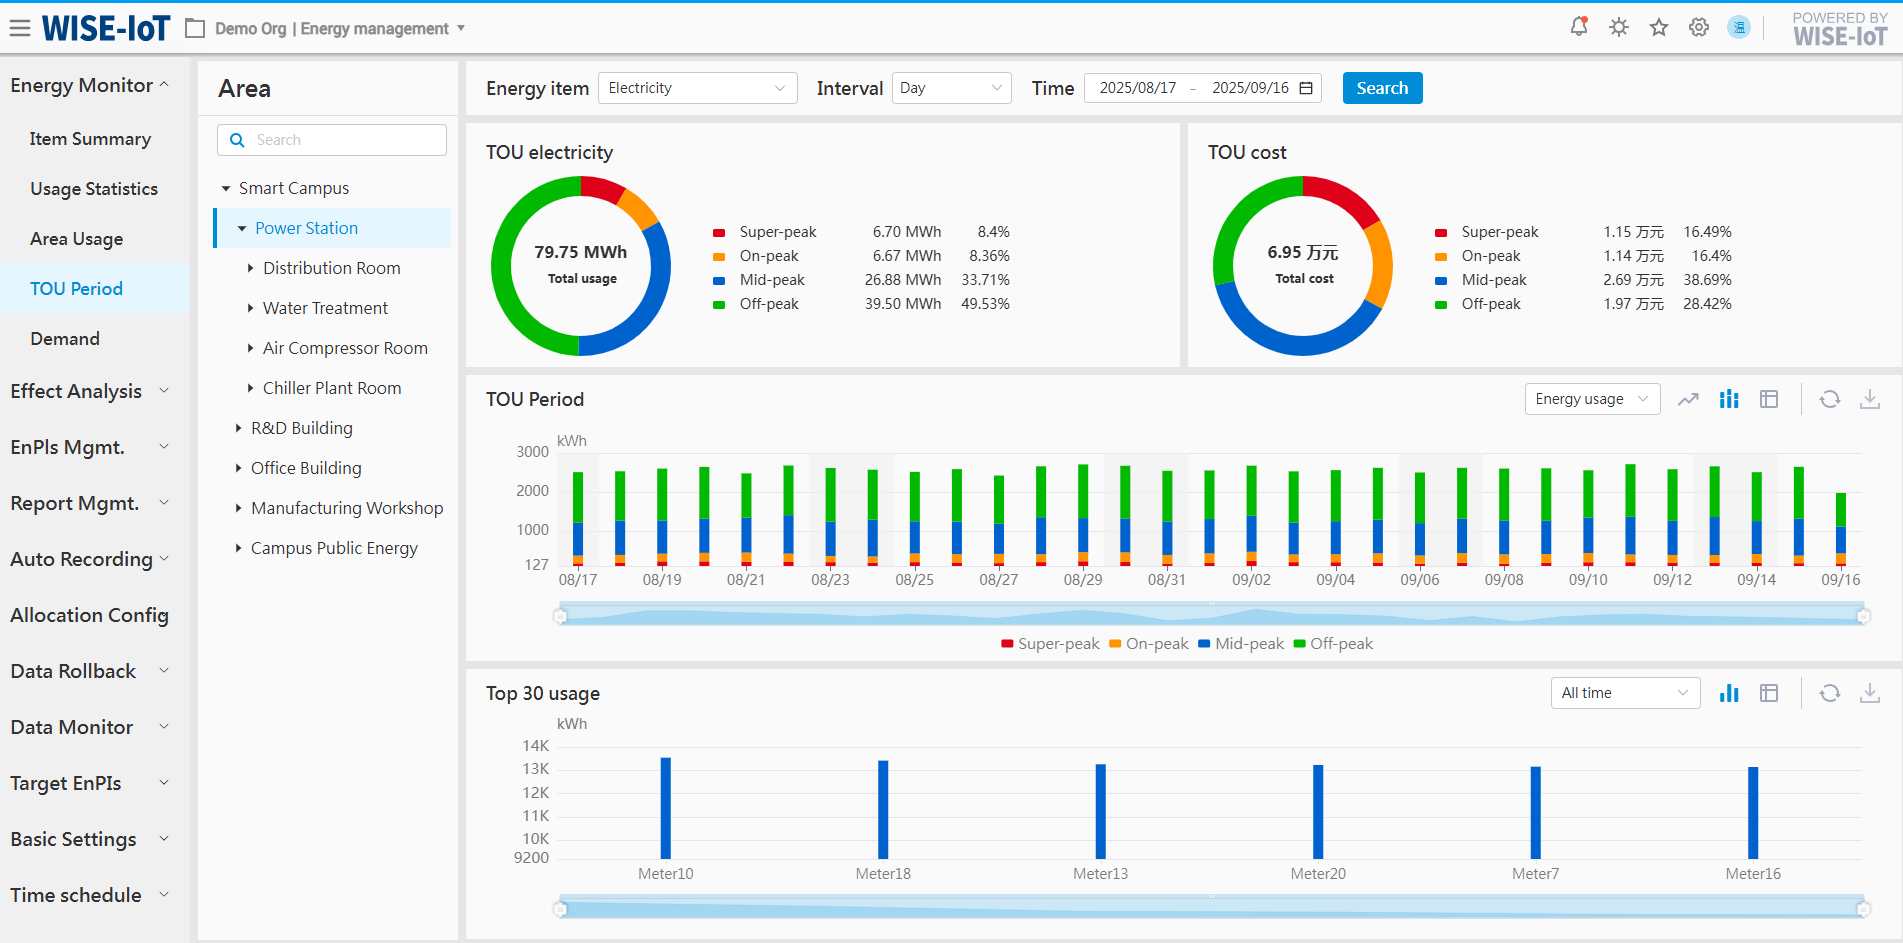
- Statistical area
The statistical area breaks down electricity usage and costs by time-of-use periods.
Note: If there is no information about peak, flat and valley, please check whether the [Time Scheduling]module has provided with the peak, flat and valley period information and electricity price for the area.
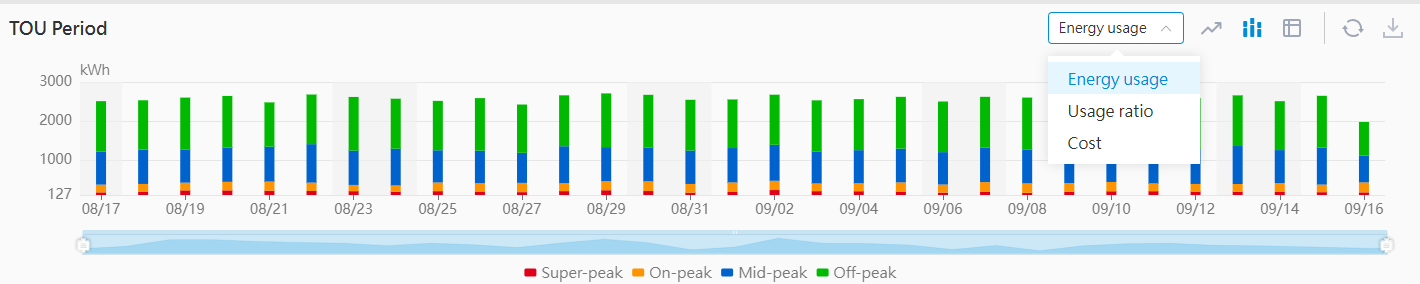
- Graph section
(1) Display the electricity usage trends of peak, flat and valley periods of an area. Click line chart or table to change display styles;
(2) Click the drop-down box to view electricity usage trend, usage proportion trend and cost trend of each period.
(3) Click "![]() " to export the data in Excel.
" to export the data in Excel.
- Top 30 devices in terms of electricity usage
Rank the top 30 devices in this area based on their electricity usage.
(Note: The value of device node's static attribute "machine" should be 1. If a device should be excluded from ranking, go to the device node in the Meter Asset Group of the APM System, and set its static attribute "machine" to 0 or any non-1 numeric value.
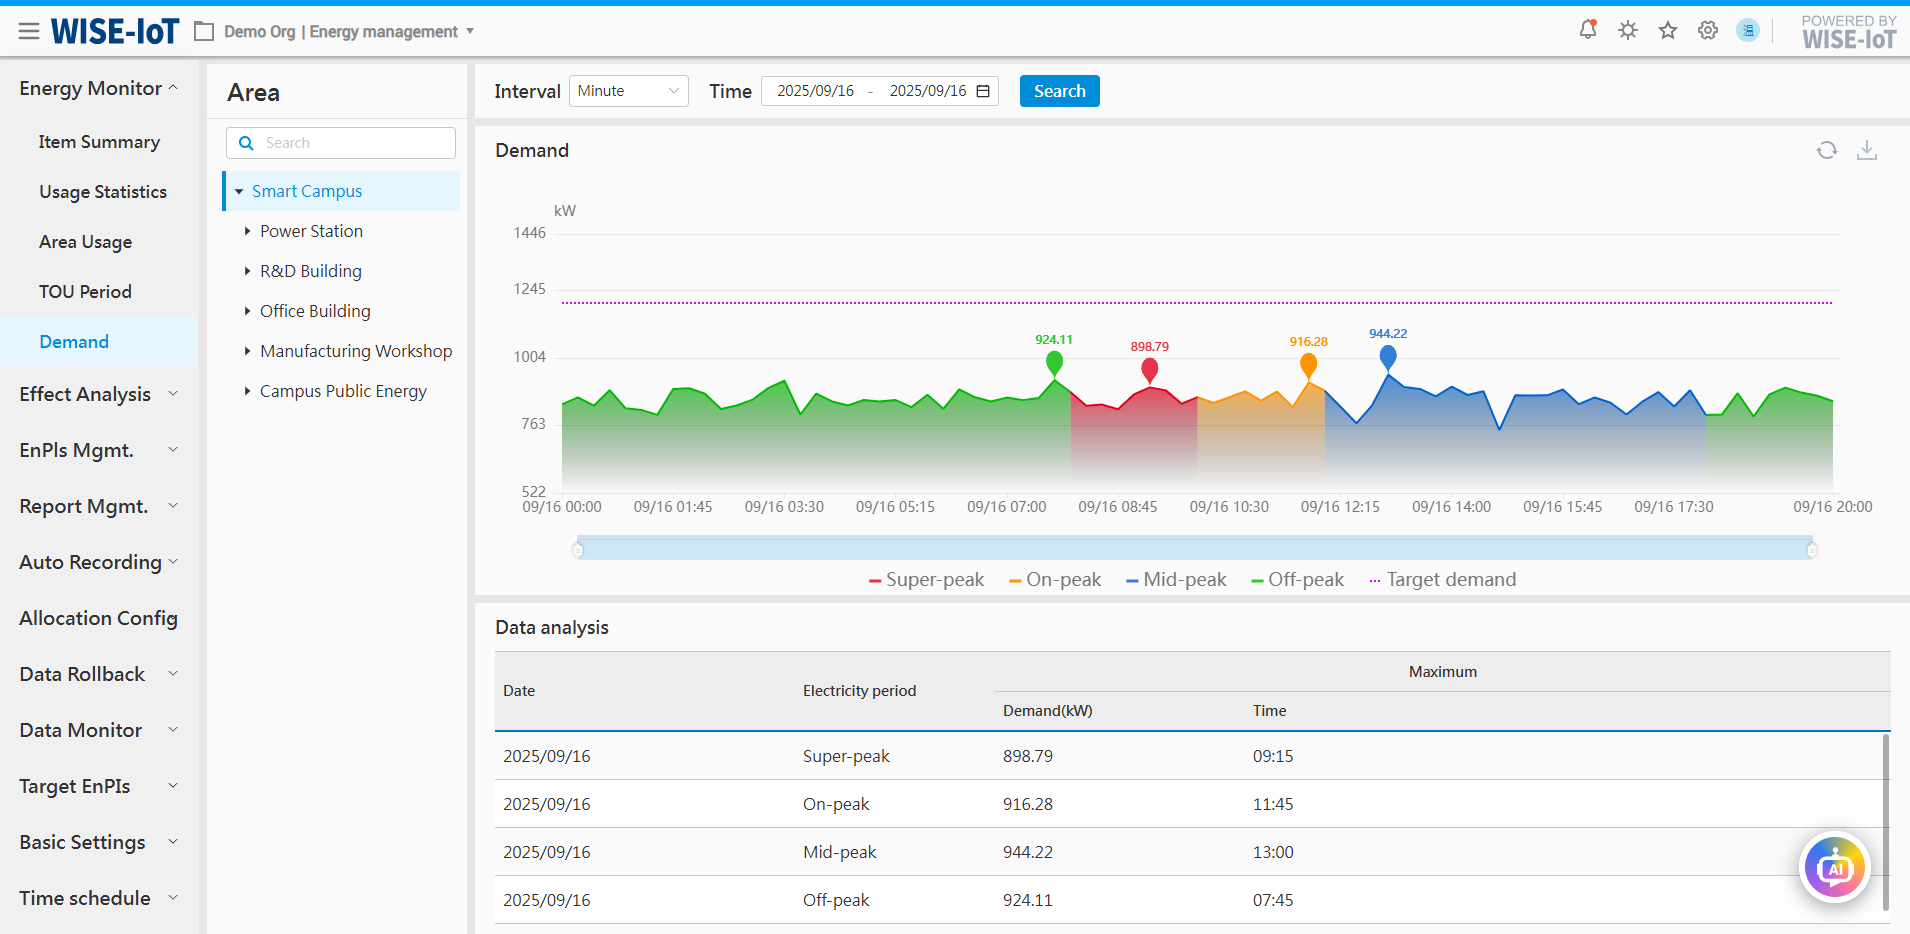
Demand Analysis (Load)
Click Energy Monitor > Demand Analysis to go to the Demand Management module.
The Demand Analysis interface records the enterprise's electricity load and peak demand at 15-minute intervals, enabling users to view demand patterns of all areas.
- Filter area
The user can view the demand trends according to time granularity such as year, month, day and minute.
- Graph section
(1) The colors in the graph represent the demand during peak, flat and valley periods. The system statistically analyzes the demand of each period and displays its peak demand;
(2) Click the bubble to go to the next level to view demand of finer time-granularity. For example, the initial statistics is based on the annual demand. Click the bubble, the monthly statistics will be displayed, and click again, the daily statistics will be displayed, and so on until the statistics is displayed every 15 minutes.
(3) Support comparison between the current demand and the target demand to check for excessive electricity usage.
※ The steps for target demand setting can be found in "Target Demand Setting".
(4) Click "![]() " to export the data in Excel.
" to export the data in Excel.
- Statistical area
Statistically analyze and display the peak demands of peak, flat, and valley periods and all periods, and the time peak demands occur.
Effect Analysis
Energy Usage Ranking
Click Effect Analysis >Usage Ranking to go to the Energy Usage Ranking Management module.
The module statistically analyzes and displays the energy usage (including water, electricity, gas, and heat) of each area, and sorts them in descending order.
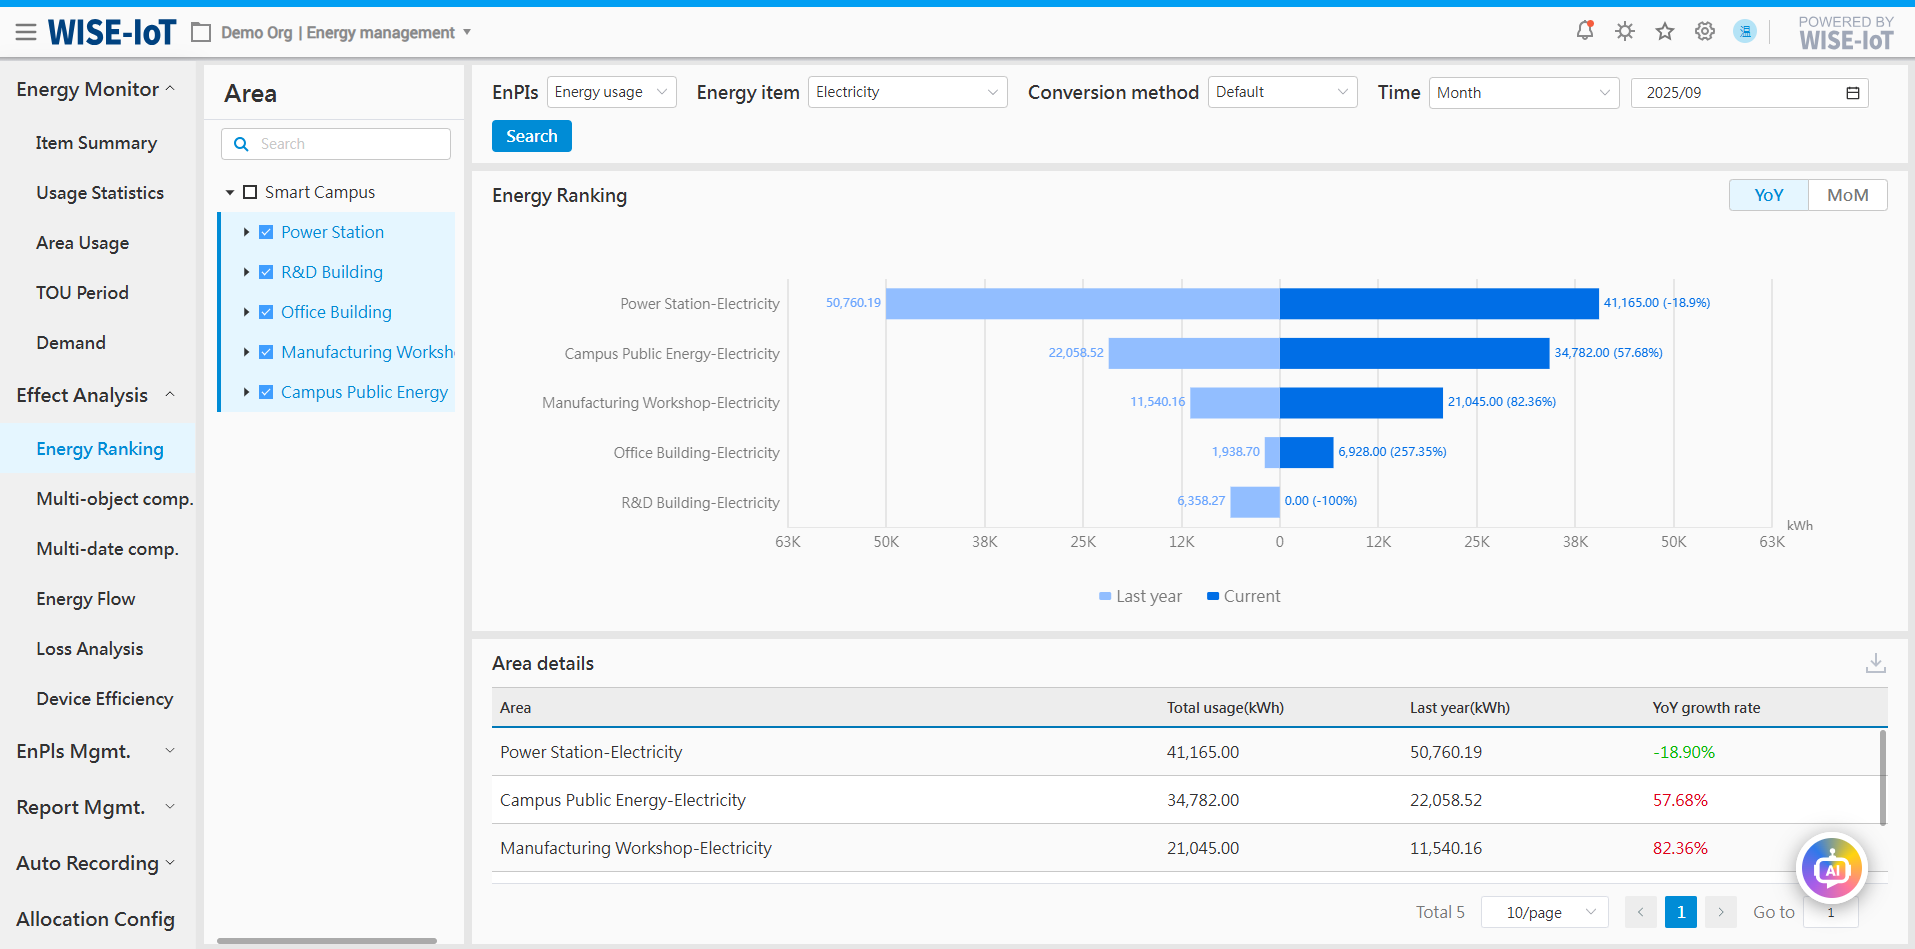
- Graph section
-
Support energy usage comparison among different areas;
-
Support YoY and MoM energy usage comparisons of the same area;
-
Support comparison among different performance indicators, including energy usage, usage-to-output value ratio, usage-to-output ratio, usage per unit area, usage per capita. The user can go to Page Configuration > Global Settings module to hide a performance indicator in the filter option;
-
The user can select metering methods. All energy types shall be metered in their native measurement units by default. Energy can be metered by coal equivalent, carbon equivalent, electricity, and thermal equivalent.
- Table area
It displays the energy usage, the share of energy usage, and the YoY data of the selected area.
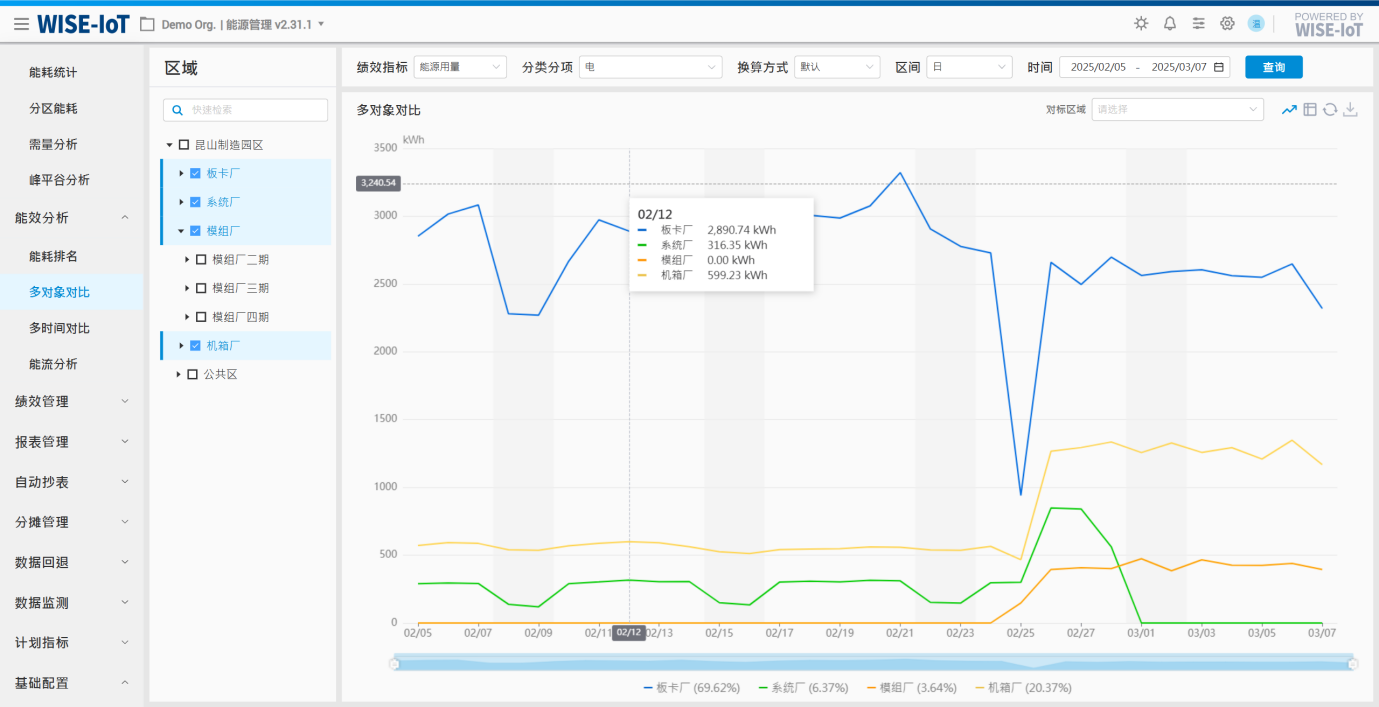
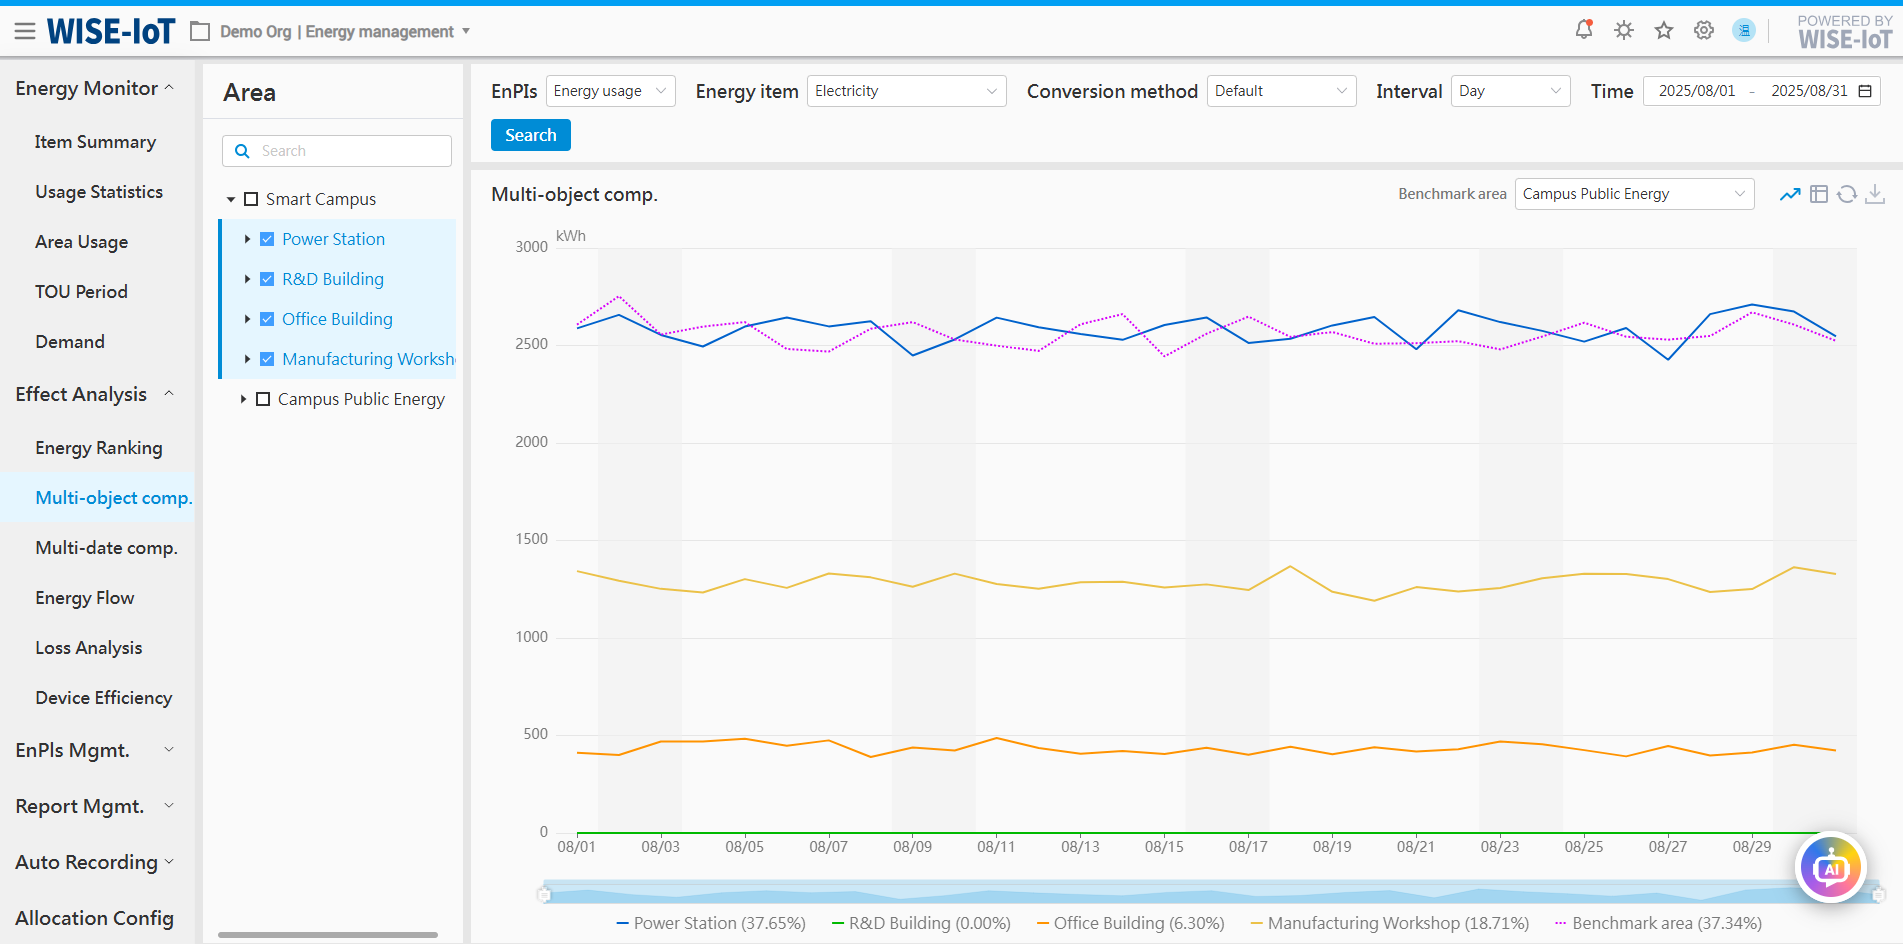
Multi-object comparison
Click Effect Analysis > Multi-object Comparison to go to the Multi-object Comparison module.
Multi-object comparison mainly involves areas with same attributes or that are comparable. It conducts comparative analysis based on time to show the energy usage changes of several areas within the same time period.
-
Line graph and table are used to compare the energy usage of different objects.
-
The system supports comparison across different time cycles and granularities.
-
Support comparison among different performance indicators, including energy usage, usage-to-output value ratio, usage-to-output ratio, usage per unit area, usage per capita. The user can go to Page Configuration > Global Settings module to hide a performance indicator in the filter option;
-
The user can select metering methods. All energy types shall be metered in their native measurement units by default. Energy can be metered by coal equivalent, carbon equivalent, electricity, and thermal equivalent.
-
After selecting different objects, you can choose "Benchmark Area" as the benchmark value:
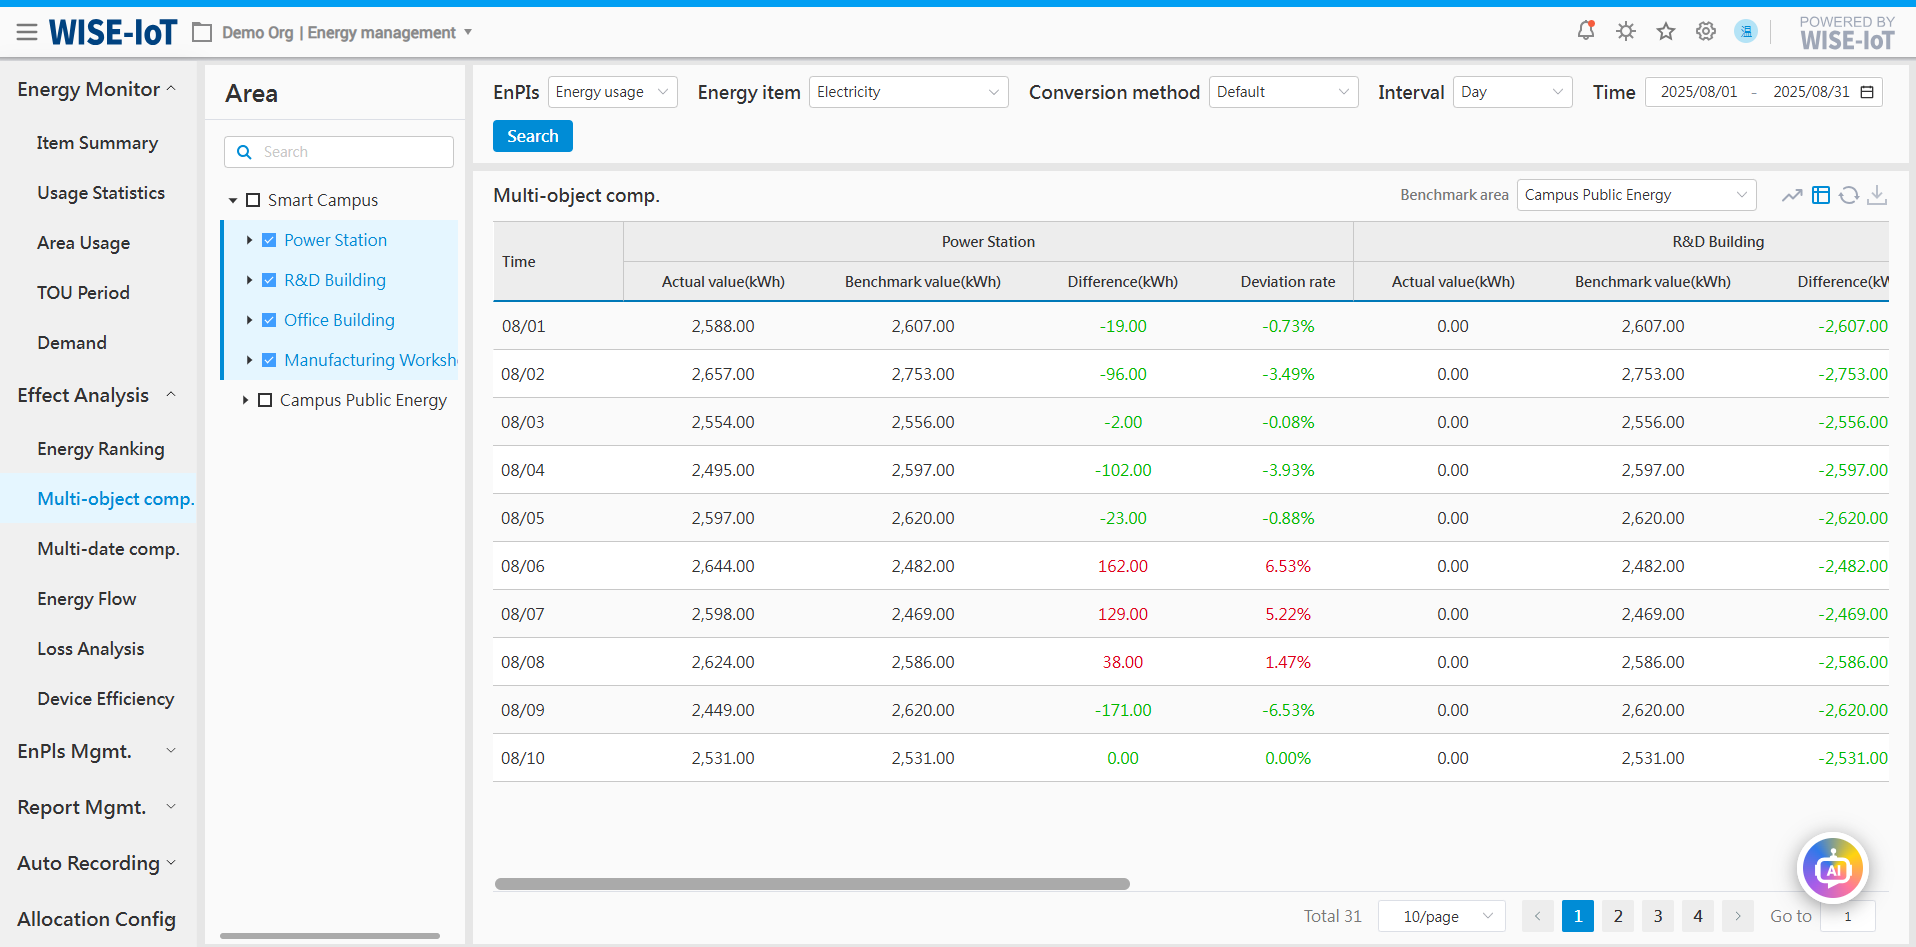
- Click "
 " to export the data in Excel.
Multi-period Comparison
Click Effect Analysis > Multi-period Comparison.
The Multi-period Comparison module enables comparison of energy usage for the same energy-using object across different time periods. This includes scenarios such as pre- vs. post-device retrofit and same-floor consumption comparisons across varying time intervals. By analyzing energy usage variations through multi-period data contrast, users can identify anomalies.
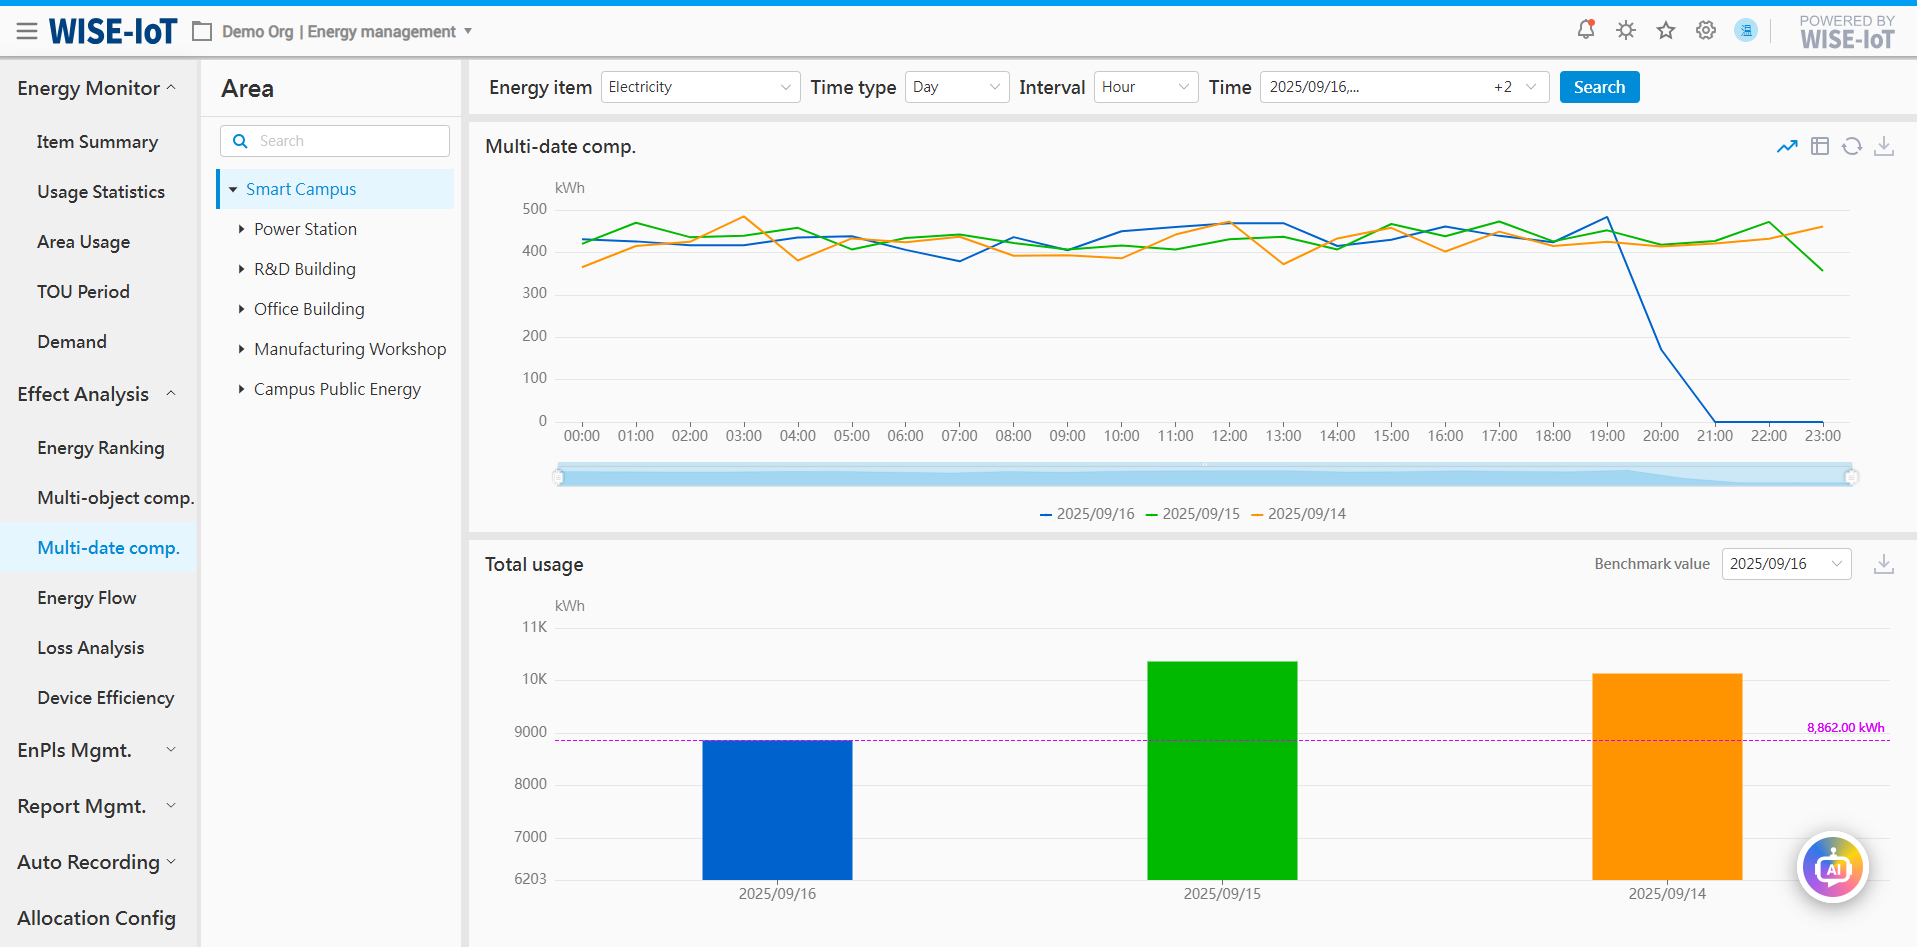
- Comparison Graph section:
-
Display energy usage comparison of the same object in different time periods by line graph or table.
-
Support the comparison of total usage during different time periods.
-
Support comparison based on different time cycles and granularities.
-
Support comparison during custom time periods.
- Total energy usage statistics area
-
Support energy usage comparisons across different time periods;
-
Support energy consumption from a selected period as the baseline value for comparative analysis against consumption in other time periods.
-
Click "
" to export the data in Excel.
Energy Flow Analysis
Click Effect Analysis > Energy Flow to go to the Energy Flow Analysis module.
The system, based on energy statistics and energy analysis, uses an "area + type/sub-item" topological structure to present the supply-demand balance of electricity, water, gas, and other energy types in the form of a Sankey diagram.
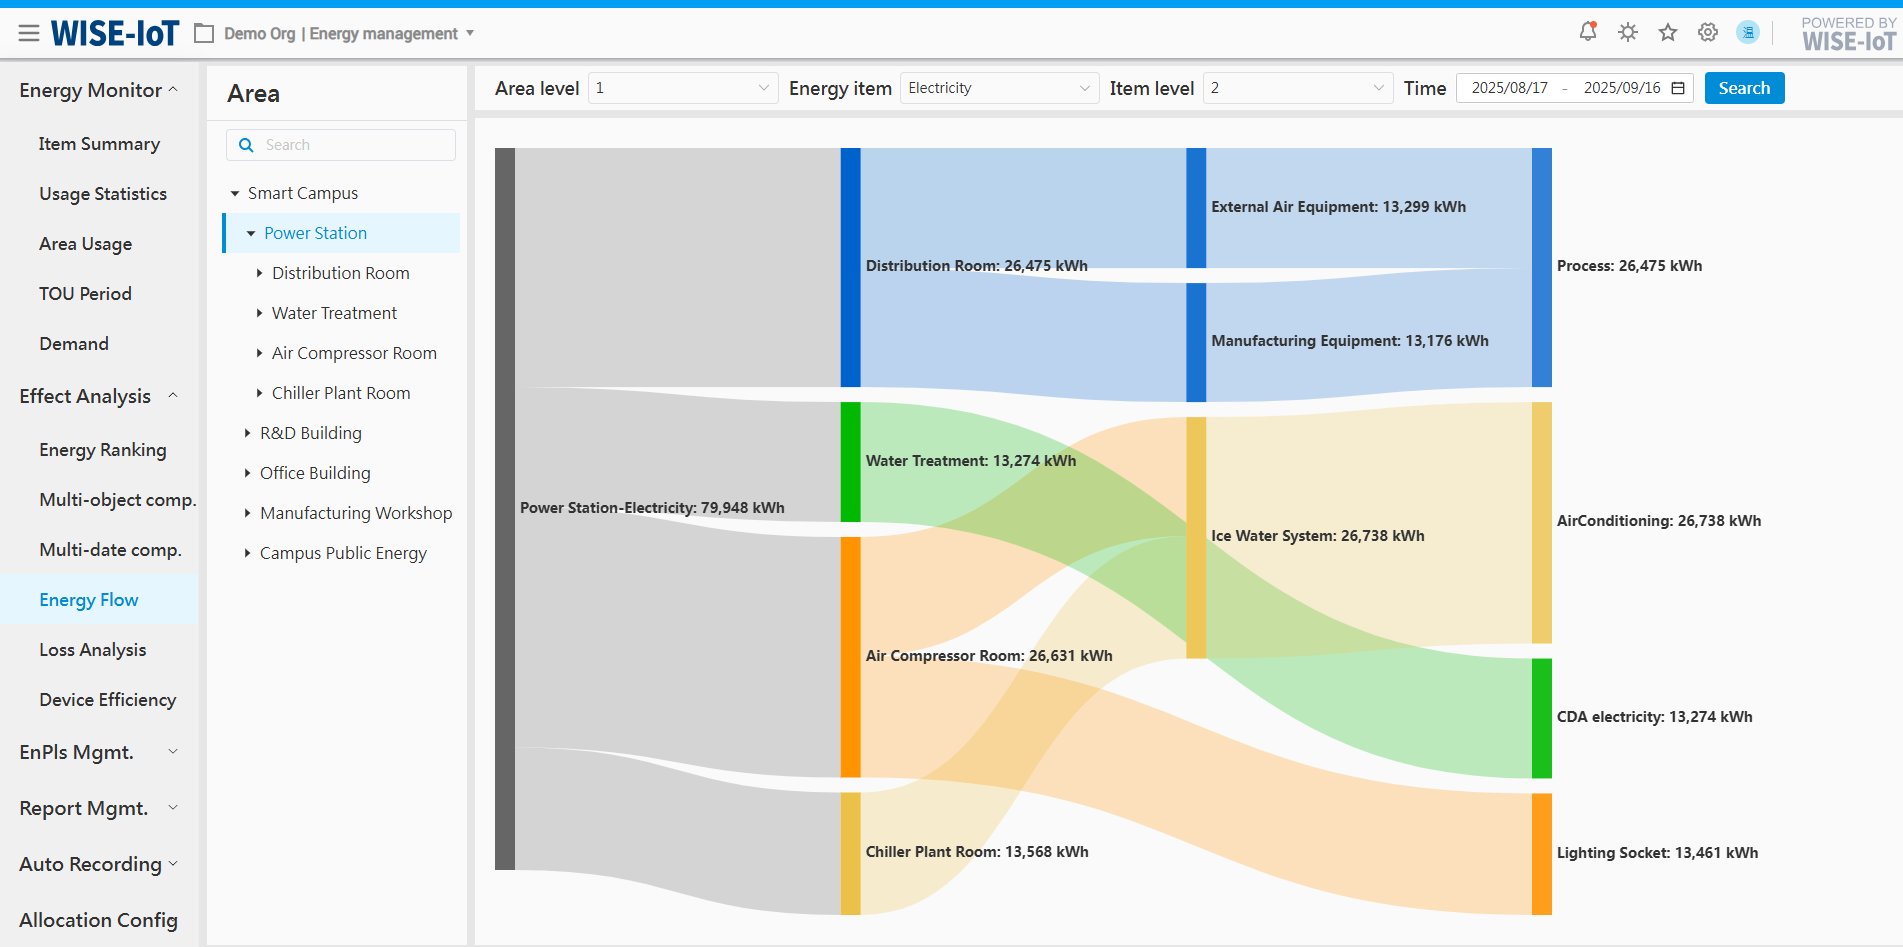
- Area level: The selected area in the area bar on the left is set to level 0 by default.
(1) When area hierarchy is set to Level 1, the area in the energy flow will display the direct level 1 of the selected area.
Example:Power Station (Level 0) → Distribution Room/Air Compressor Room... (Direct Level 1);
(2) When area hierarchy is set to Level 2, the area in the energy flow will display the direct level 2 of the selected area.
-
Energy items: sourced from Energy Type module. The data displayed in the interface are different based on the energy items selected.
-
Energy item hierarchy: The energy item selected in the filter criteria defaults to level 0.
(1) When energy item hierarchy is set to Level 1, the energy item in the energy flow will display the direct Level 1 of the energy.
Example: If "Electricity" is selected in the filter, it will display: Electricity (Level 0) > AirConditioning Electricity/CDA Electricity... (Direct Level 1);
(2) When energy item hierarchy is set to Level 2, the energy item in the energy flow will display the direct Level 2 of the energy.
Example: If "Electricity" is selected in the filter, it will display: Electricity (Level 0) >AirConditioning Electricity(Direct Level 2) > Ice Water System... (Direct Level 1);
- The interface supports custom time range configuration.
Loss analysis
Click Effect Analysis > Loss Analysis to go to the Loss Analysis module.
Loss analysis provides energy balance analysis for links in the conversion and utilization of energy sources such as electricity, water, and gas. It statistically analyzes energy supply and usage at critical links and calculates their loss difference to evaluate the energy loss at each stage.
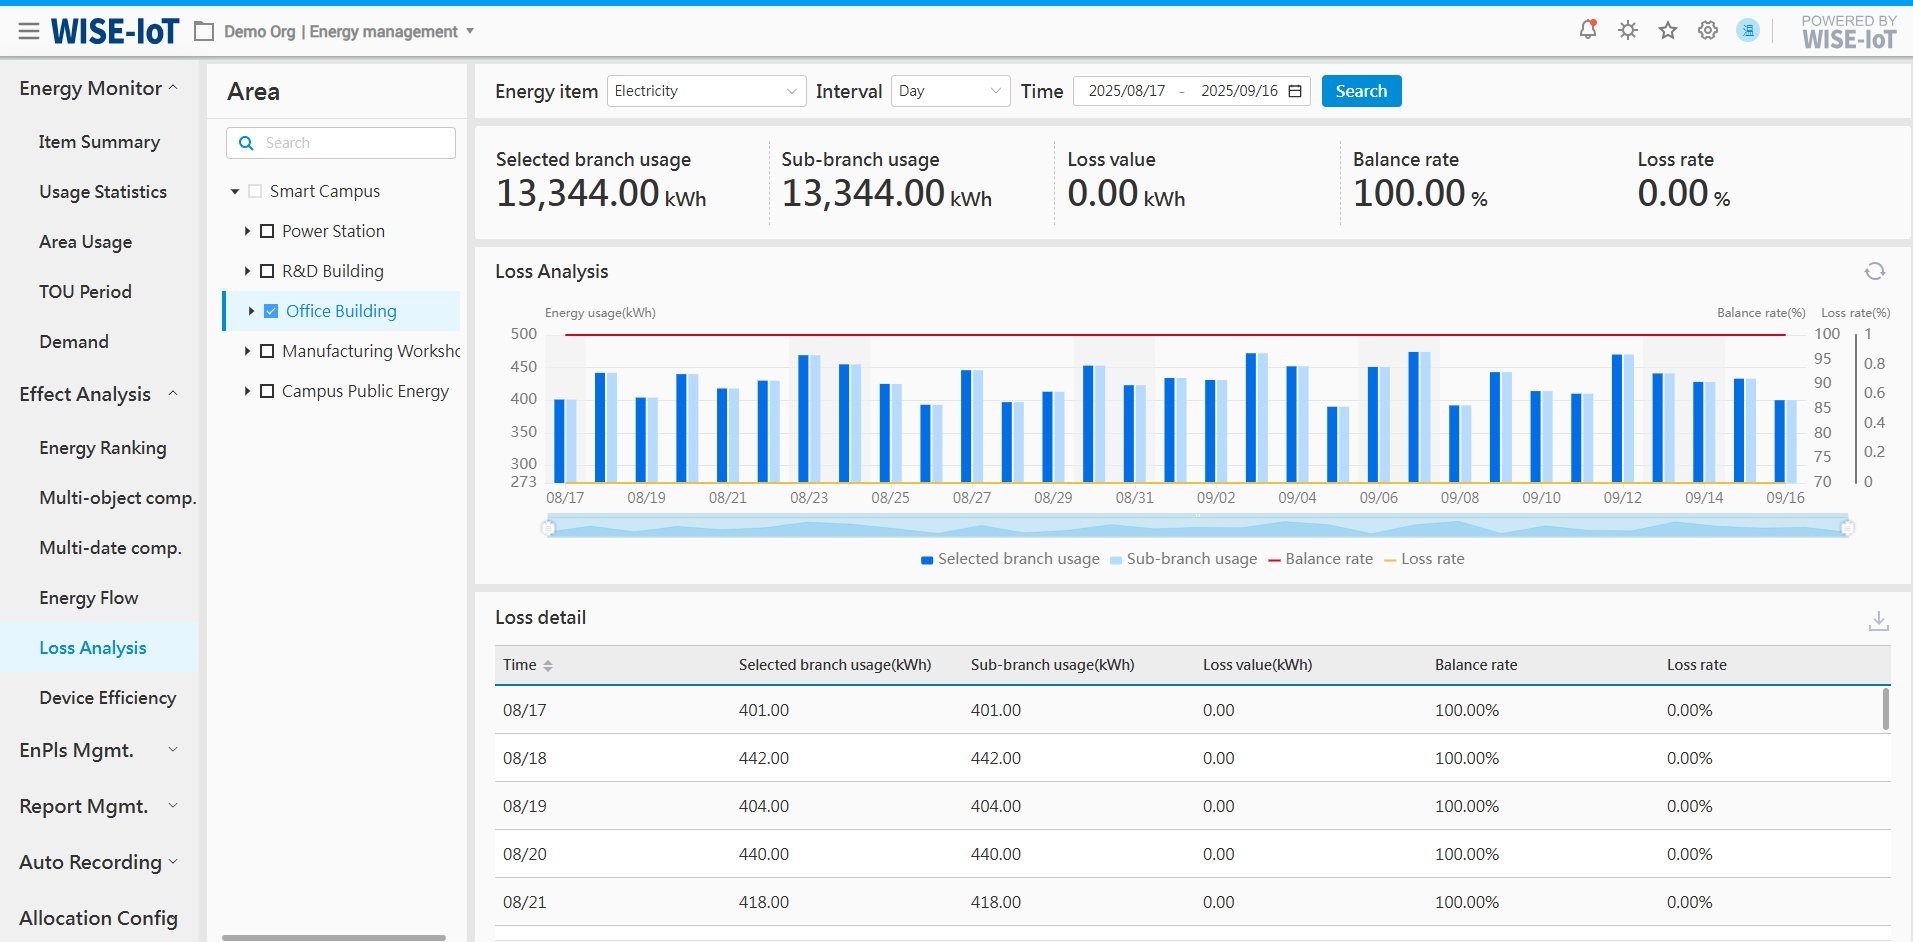
- Statistical section
Calculate and display the energy consumption, energy variance, balance rate, and loss rate between the selected area and its subordinate circuits.
- Graph section
(1) Support evaluating energy loss levels at different time granularities: monthly, daily, and hourly.
(2) Click "![]() " to export the table in Excel.
" to export the table in Excel.
- Table section
Show data of the graph section.
Device efficiency
Click Effect Analysis>Device efficiency go to device efficiency analysis Module.
Device efficiency analysis primarily provides energy efficiency indicator values and trend analysis for various utility and process equipment, such as compressed air electrical ratio and HVAC COP, while meeting the assessment requirements for ISO 50001 equipment performance indicators. Through real-time monitoring and historical trend analysis of key equipment energy efficiency, this module helps enterprises identify energy efficiency anomalies and optimization opportunities during equipment operation. Simultaneously, by implementing a standardized energy efficiency threshold management system, it evaluates whether equipment energy efficiency is at the optimal level, indirectly guiding facility management personnel to better operate and maintain equipment. The module interface is shown in the figure below:
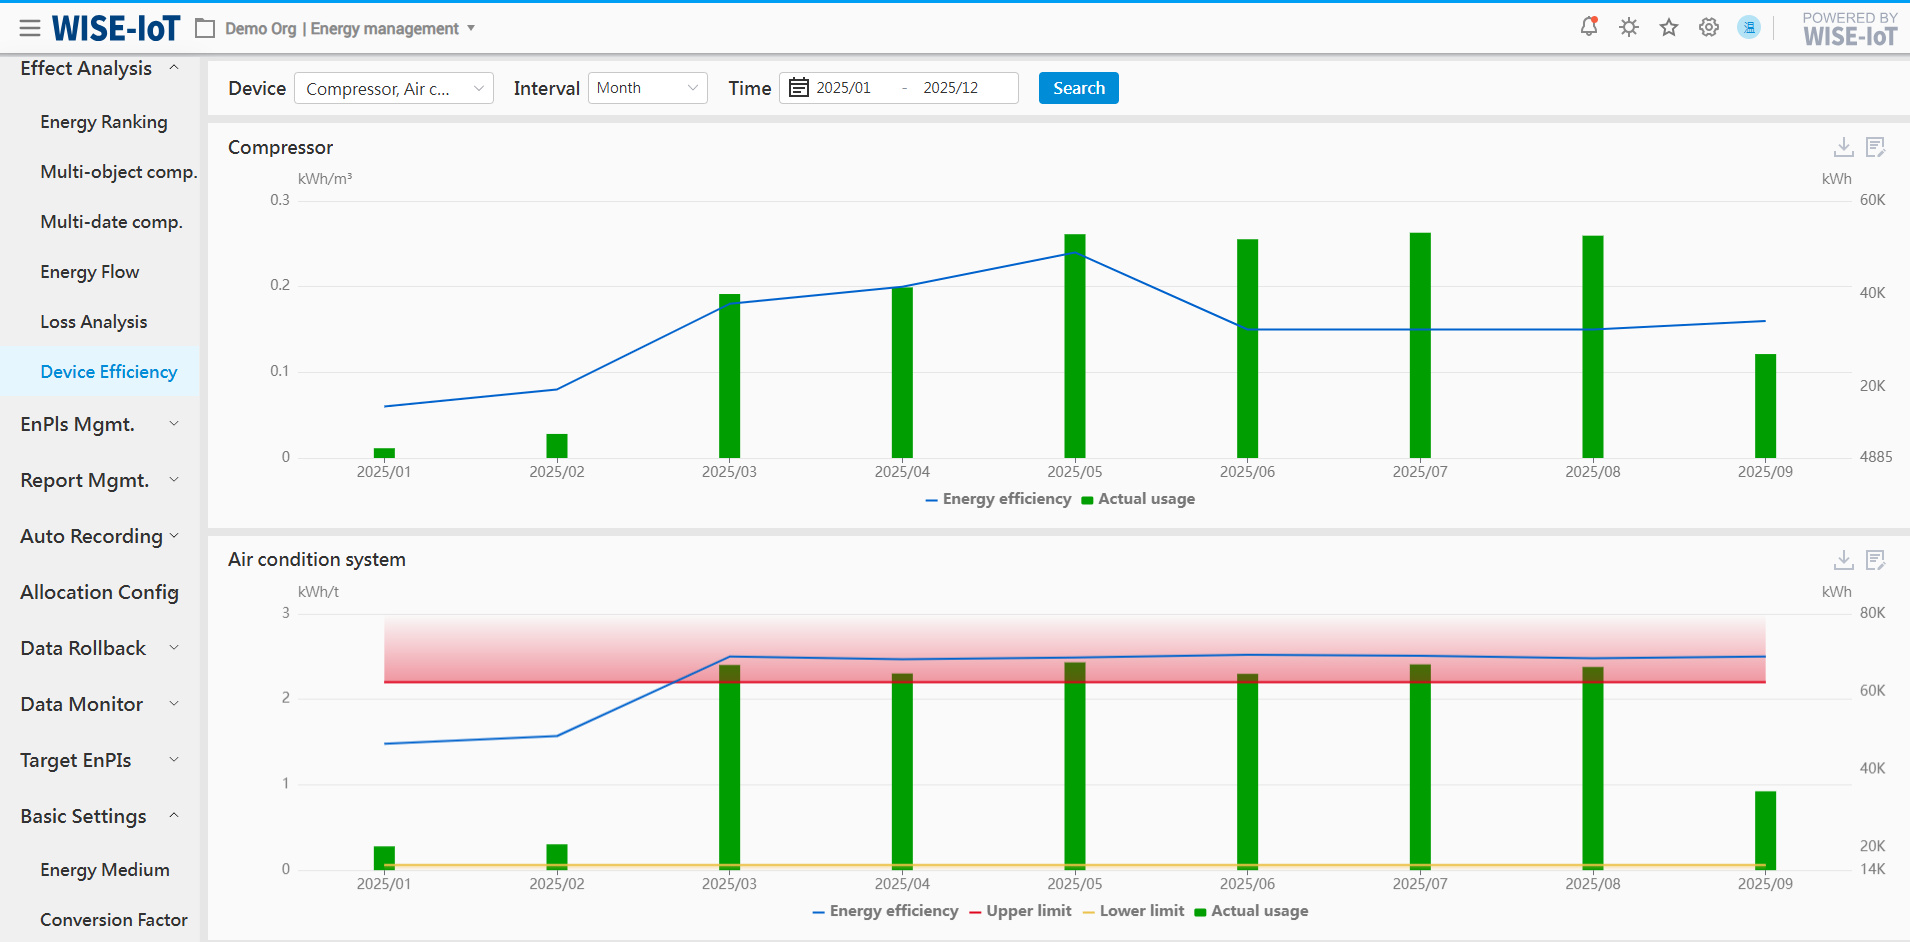
The content display on the device efficiency page depends on the following conditions:
-
[Device Selection: Device information must be configured in the [Device Efficiency Configuration] module.]
-
[Device Efficiency Values: The calculation formula for device efficiency must be configured in the [Device Efficiency Configuration] module.]
-
[Device Efficiency Thresholds (Upper and Lower Limits): Device efficiency thresholds must be configured in the [Device Efficiency Configuration] module.]
-
[Energy Consumption Values: Display (or lack thereof) depends on whether the device was configured with energy consumption data during its addition in the [Device Efficiency Configuration] module.]
-
[Device Display Order: The interface displays devices according to the configuration order of the device list in the [Device Efficiency Configuration] module, following a left-to-right, bottom-to-top sequence.]
The device efficiency page operates based on the aforementioned prerequisites and filters relevant device information according to the specified criteria.
-
Displays the efficiency trend for each device. If energy consumption information is configured for display, the interface will present this data using bar charts.
-
Detailed efficiency data for each device. Click the "
 " button to download details.
 -
For each device, the system provides daily event records. Click the "
 " button to access the event log entry page, as shown in the figure below.
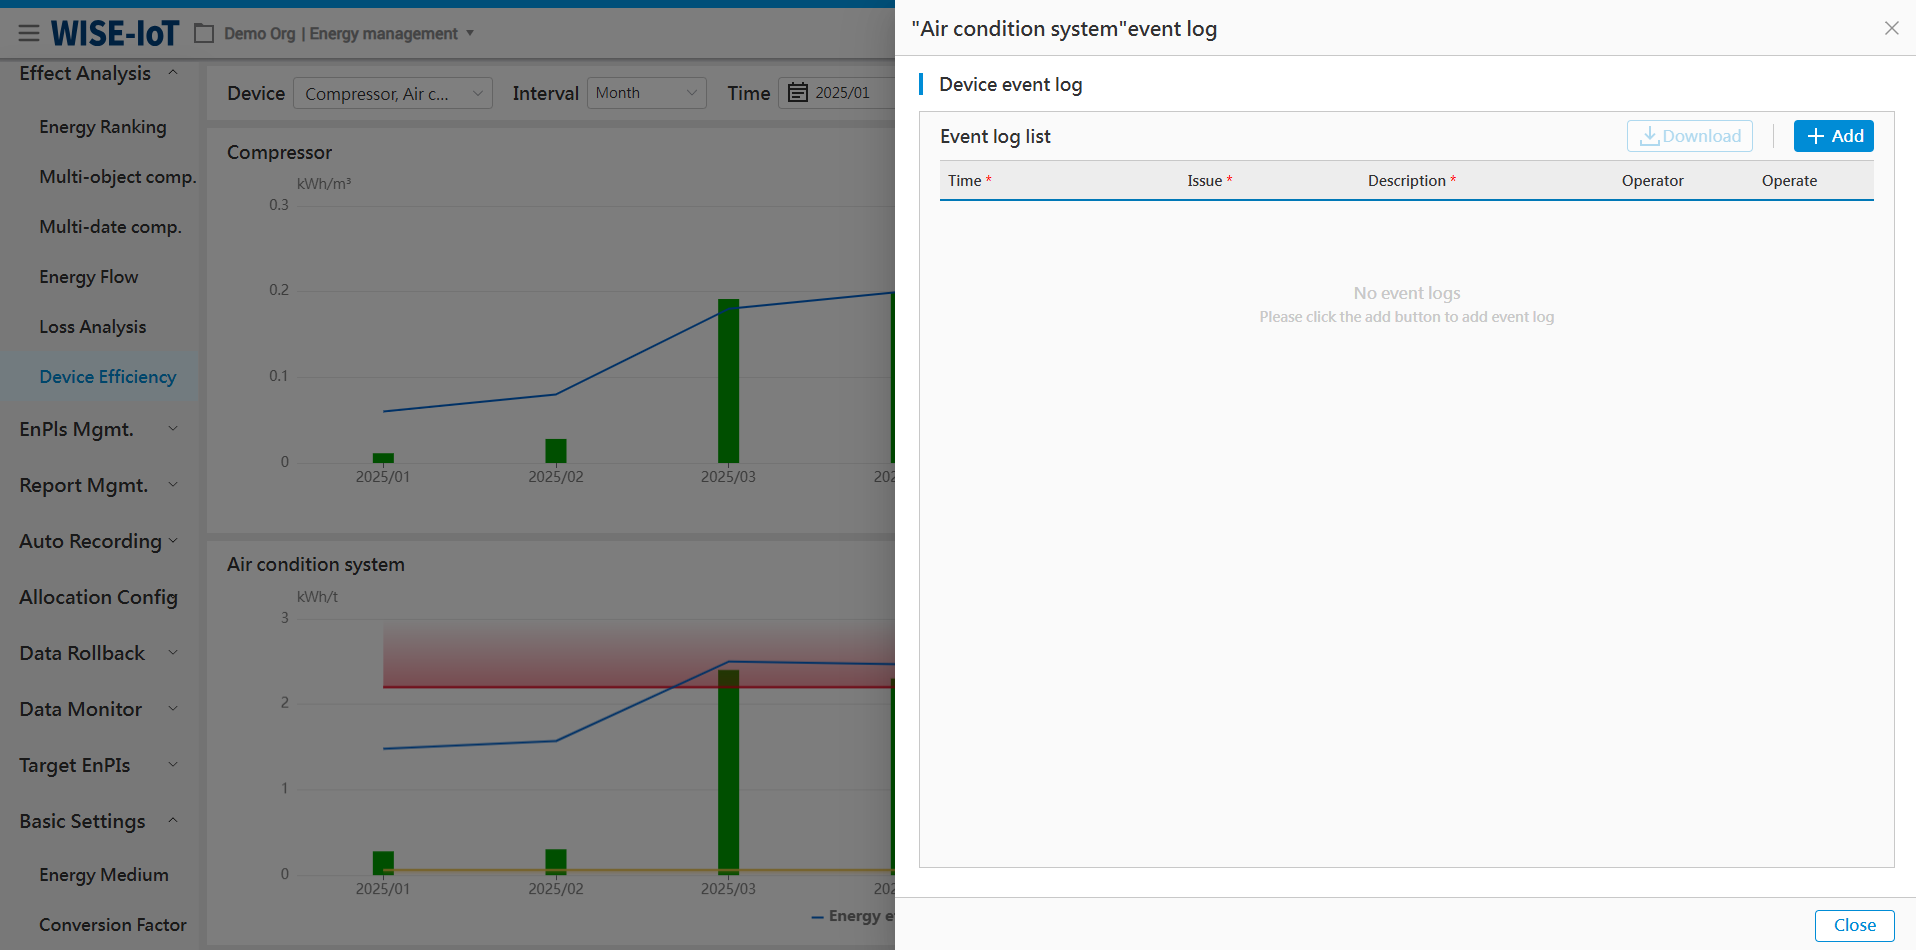
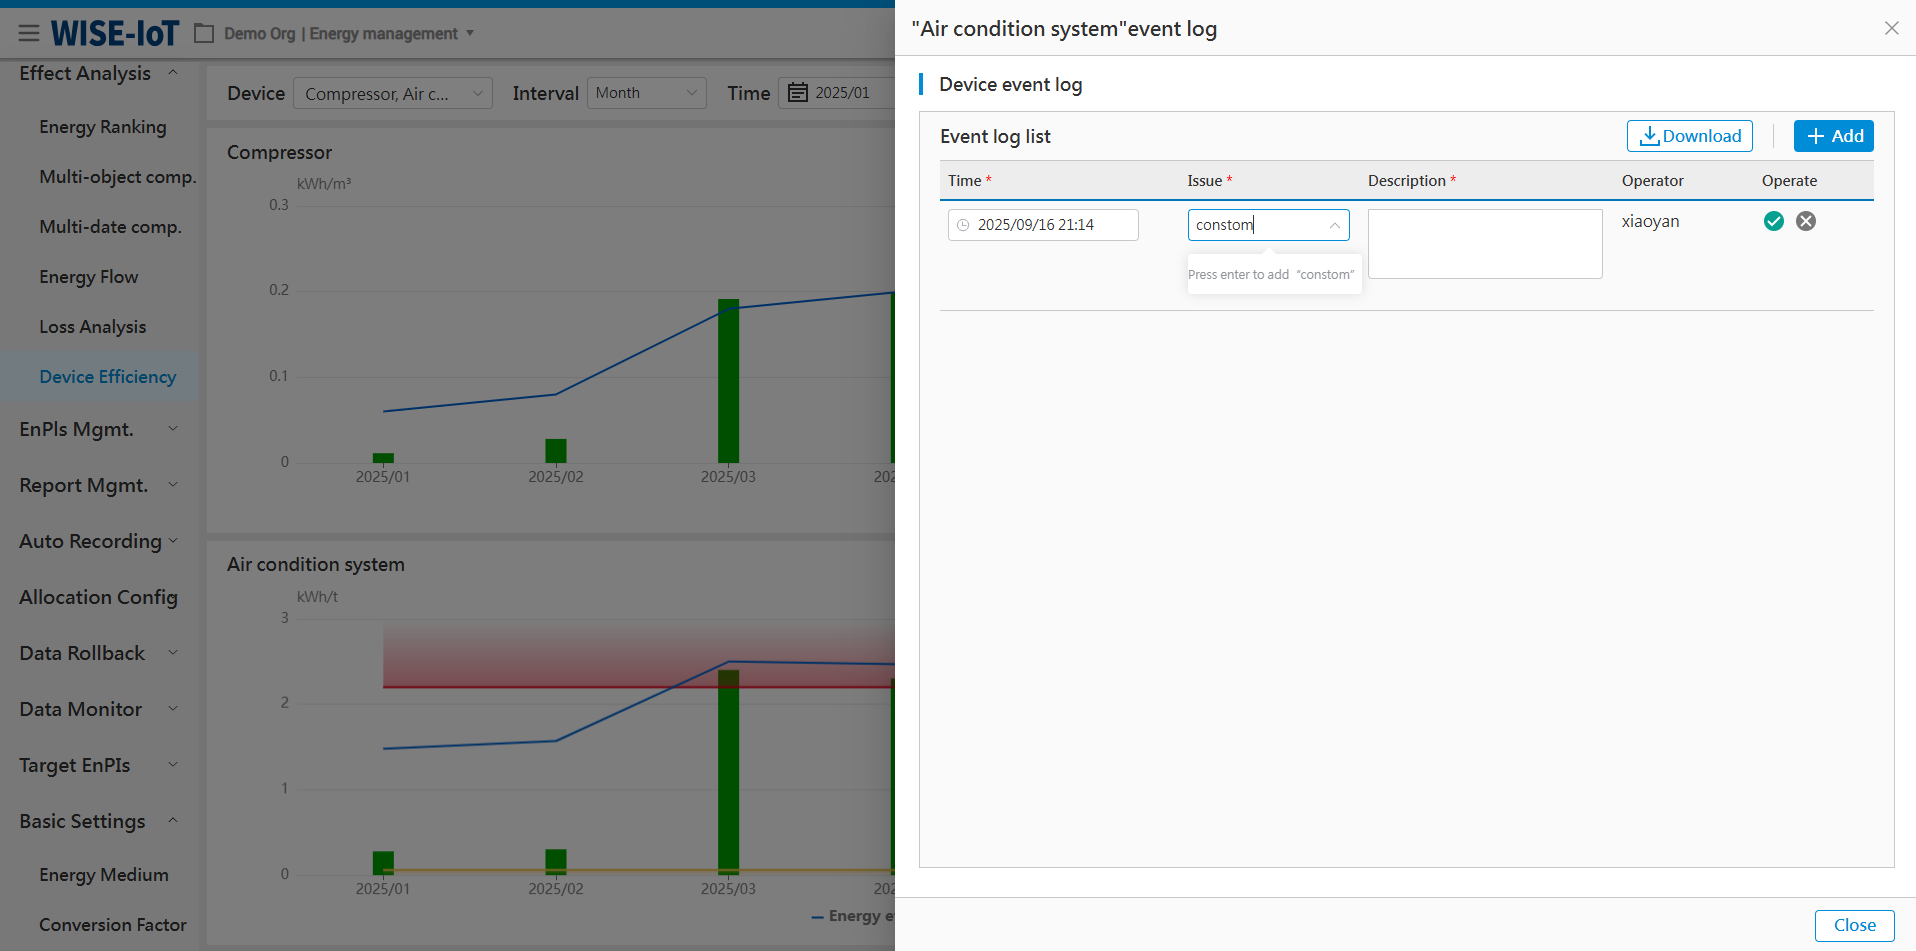
On the event log page, click the "Add" button to create new event information for the selected device.
During the addition process, if the desired description is not available in the "Issue" field, press the "Enter" key to add it directly. This will save the entry for future use, eliminating the need for re-entry, as shown in the figure below.
EnPIs Mgmt.
Introduction of Data Source
The EnPIs Management page covers information such as output, output value, area, headcount, historical energy usage, and energy unit price.
- Output value/output:
There are two ways to obtain ECOWatch's output value and output.
(1) Enter daily output value and output in ECOWatch > Basic Settings > Data Entry Mgmt. > Output Value and Output Data module.
(2) Through third-party MES system.
*The system first retrieves data from the input module. If output value or output are not available in the module, they will be obtained from the third-party interface.
-
Area: Once area data is entered in ECOWatch > Basic Settings > Data Entry Mgmt. > Area Information module, users will be able to see energy usage per unit area in the system.
-
Headcount: Once headcount data is entered in ECOWatch > Basic Settings > Data Entry Mgmt. > Headcount Information module, users will be able to see usage per capita in the system.
-
Historical energy usage: After entering historical sssenergy usage in ECOWatch > Basic Settings > Data Entry Mgmt. > Energy Usage Information module, users will be able to see usage calculated based on historical usage in the system.
-
Energy price: Average energy price. After entering monthly prices in ECOWatch > Basic Settings > Data Entry Mgmt. > Energy Price Information module, users will be able to see unit energy cost in the system.
Area Unit Usage
Click Performance Management > Area Unit Usage to access the Area Unit Usage module.
The Module utilizes performance indicators to validate the energy-saving efforts planned and implemented during the year at both corporate and regional levels. It assists managers in gaining insights into their own energy-saving and consumption-reduction status, identifying areas for improvement, and driving performance enhancement as shown in the figure below.
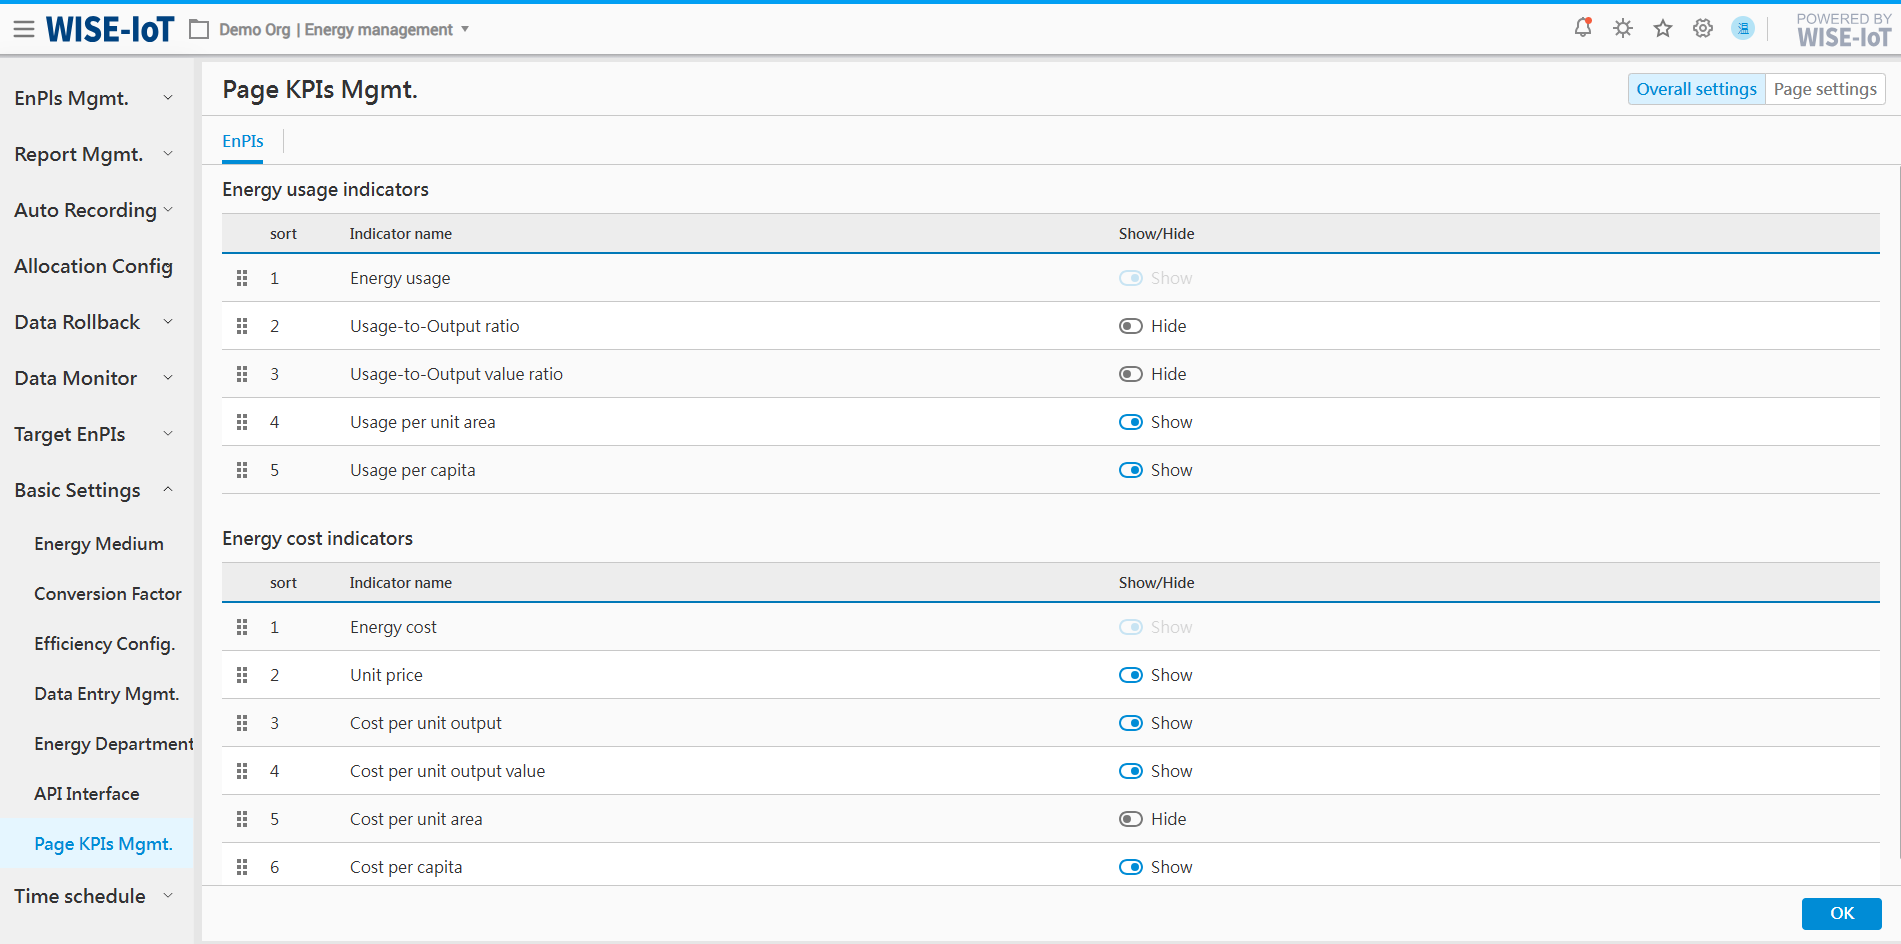
Configuration of EnPIs Dictionary Value Display Settings
Considering that different clients adopt varying performance indicators, with regard to the display of dictionary items for the "Performance Indicator" filter criterion on the Area Unit Usage page, the system provides customizable display configurations.
You can navigate to the[Page KPIs Mgmt.]menu > Overall Settings module to configure the items you need to display. Among these, Energy Usage, Energy Cost, and Unit Price will not be shown on the Area Unit Usage page.
factory Tag Configuration
When the performance indicator is set to "usage-to-output value ratio, usage-to-output ratio/cost per unit output value/cost per unit output", the area dropdown will display areas labeled as "factory". To configure areas with "factory" attribute, follow the steps below. You may also consult the ECOWatch Configuration Manual for guidance.
-
Go to InsightAPM, find the corresponding Business Asset Group in the Asset Group Management module and the area node to be displayed > click the node to enter its component interface > select and double click "StaticProperty" component.
-
Click "
 " in "building_info" to add a new field "factory", and enter 1 on the right:
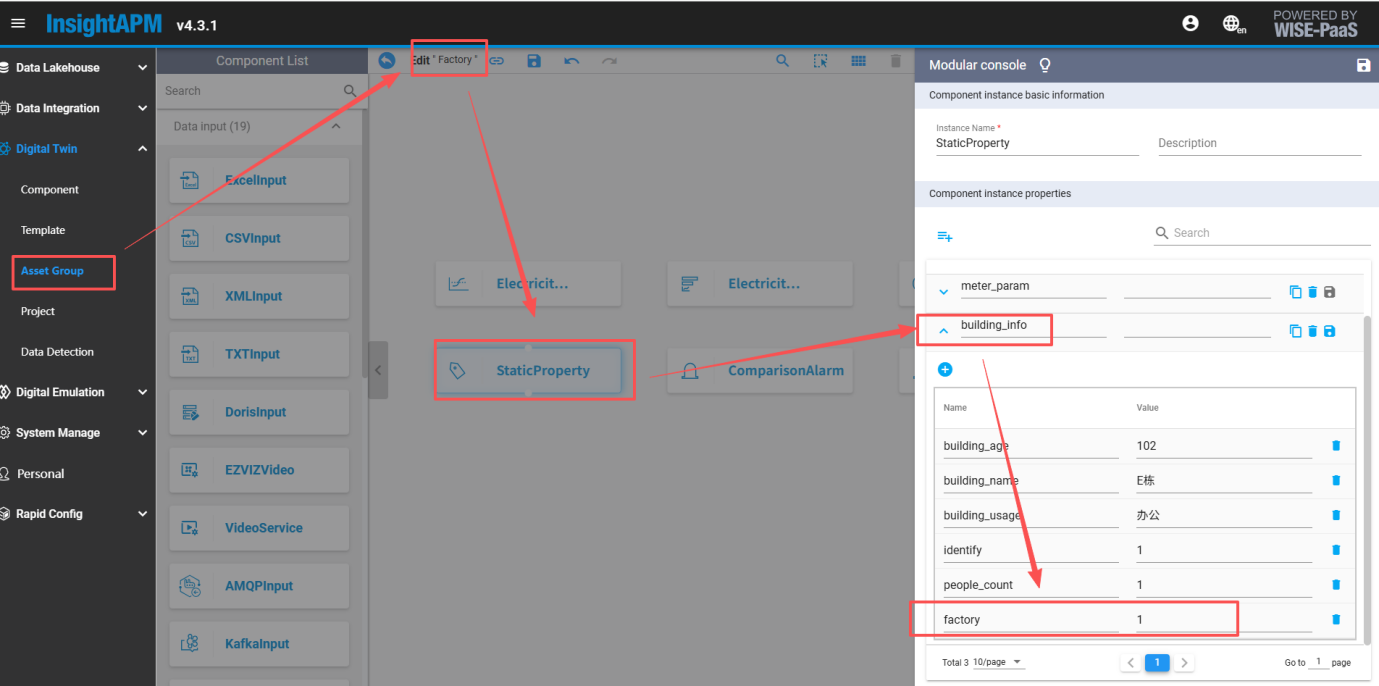
Once configured, areas labeled as "factory" will be displayed in the area dropdown.
Energy consumption per unit output value/output
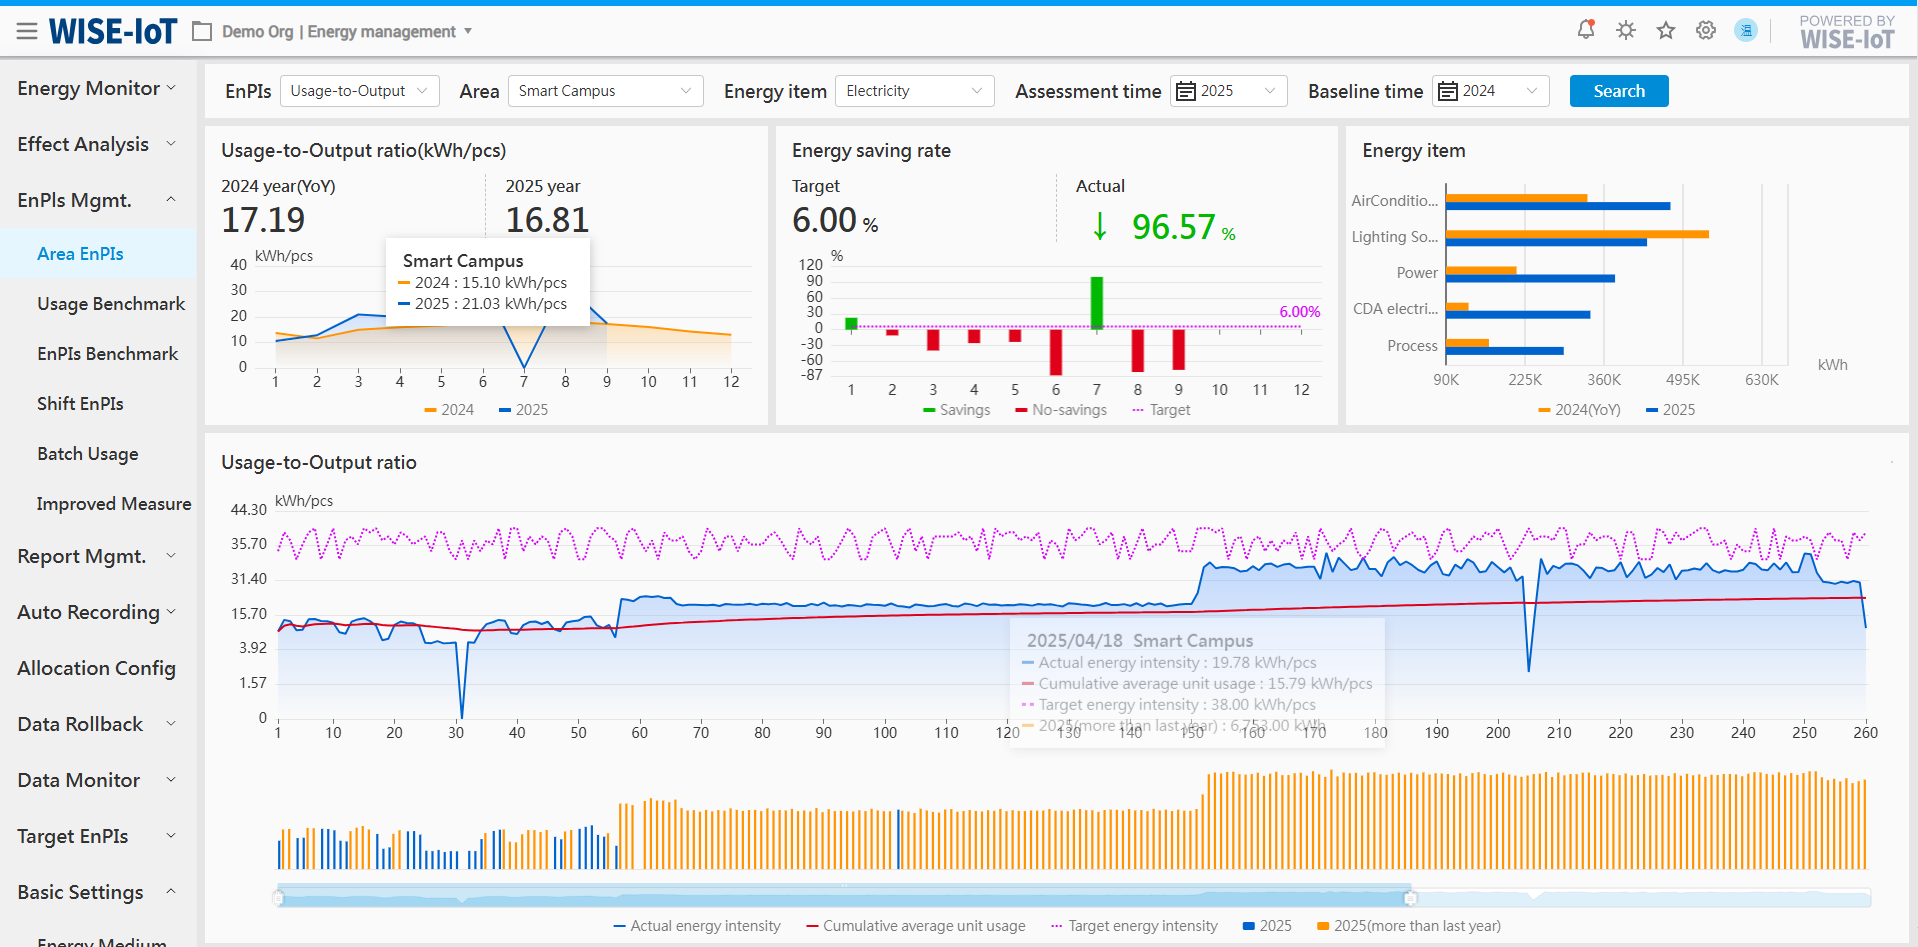
- Overview
(1) Select performance indicator "usage-to-output value ratio" to go to its analysis page, where it is used to evaluate energy efficiency performance of all areas.
(2) Select performance indicator "usage-to-output ratio" to go to its analysis page, where it is used to energy efficiency performance of all areas.
- Filter area
(1) Different areas and energy types can be selected;
(2) Users can select between benchmark time and assessment time;
- Usage-to-output value ratio/usage-to-output ratio assessment
(1) Statistically analyze and display the actual usage-to-output value ratio, usage-to-output ratio and target energy intensity for the assessment period.
(2) Calculate and display the actual energy saving rate and target energy saving rate based on the usage-to-output value ratio/usage-to-output ratio indicators during the benchmark period and assessment period.
- Area energy efficiency performance
(1) Statistically analyze and display energy efficiency performance for areas directly under the selected area;
(2) Highlight areas failing to meet energy conservation targets using distinctive colors.
- Energy sub-item structure
Statistically analyze and present the actual usage of the selected energy items during the assessment period and the benchmark period.
- Usage-to-output value ratio/usage-to-output ratio trend
(1) Display the usage-to-output value ratio and usage-to-output ratio of the selected area at monthly and daily granularities;
(2) Click a specific time in the graph to go to the Area EnPIs page to view details.
- Usage trend
(1) Display the energy usage of the selected area at monthly and daily granularities;
(2) Click a specific time to go to the "Energy Usage Analysis" page to view the details.
Usage per Unit Area/Usage per Capita
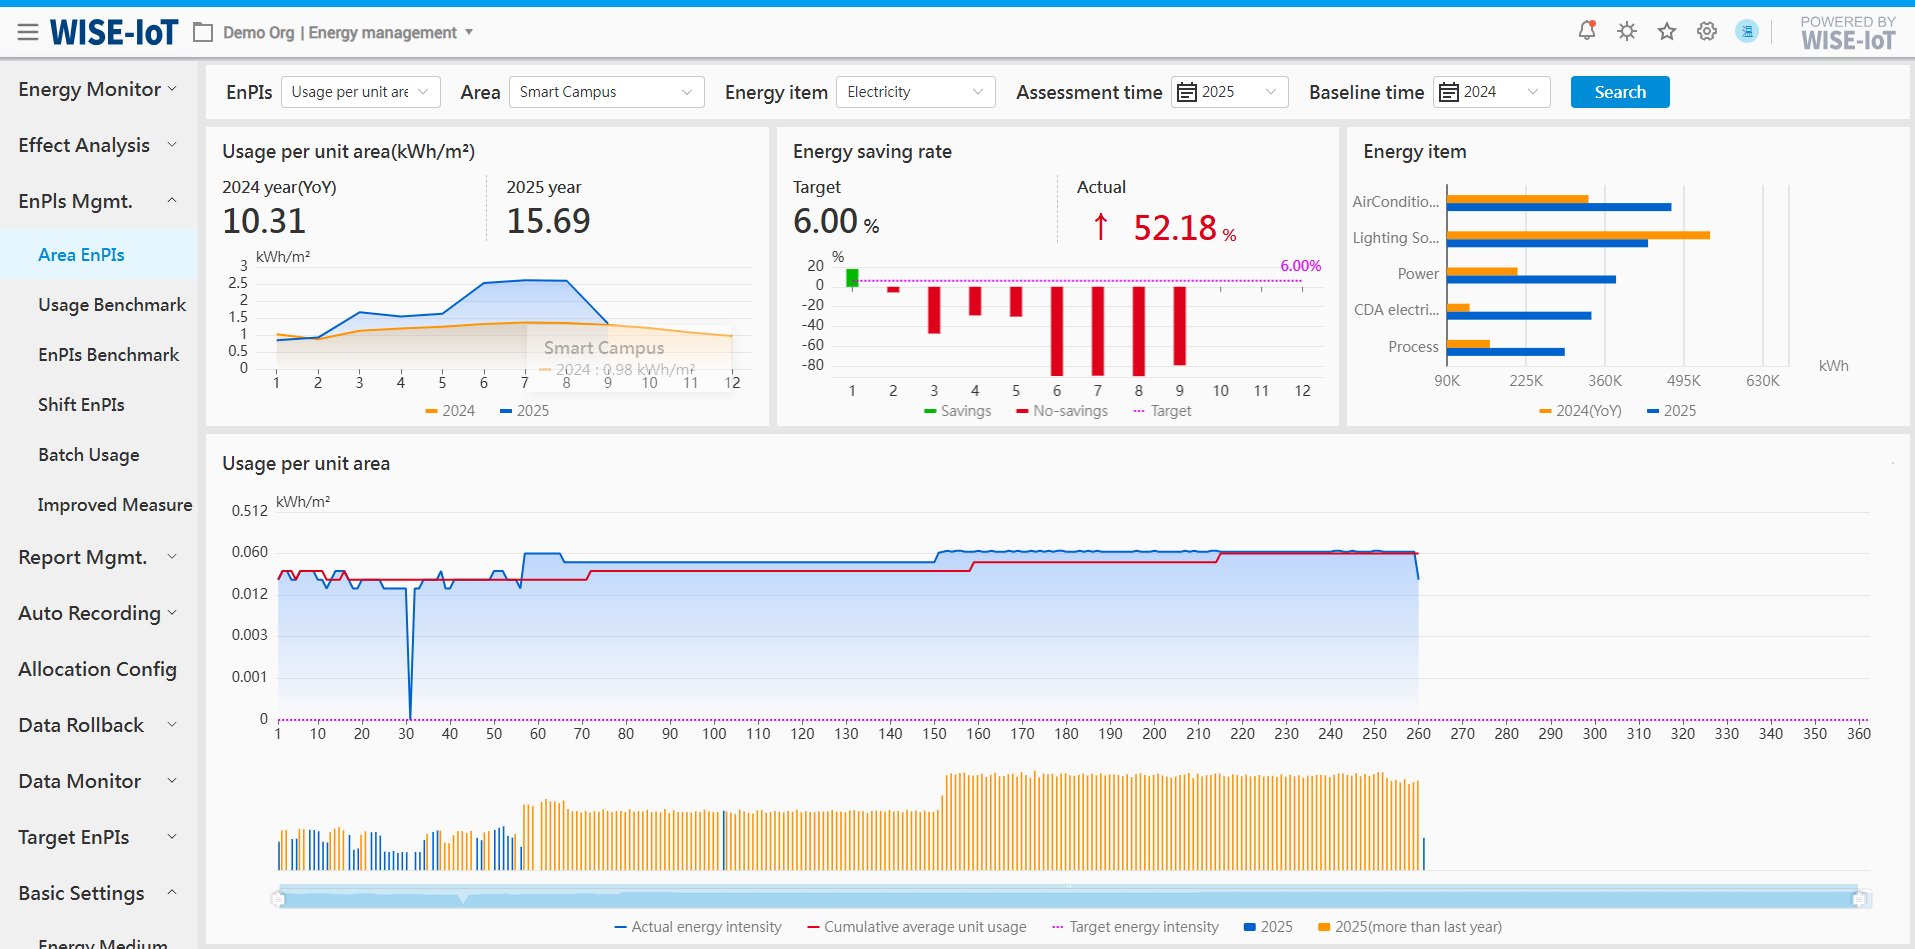
- Overview
(1) Select performance indicator "usage per unit area" to go to its analysis page, where it is used to evaluate energy efficiency performance of all areas.
(2) Select performance indicator "usage per capita" to go to its analysis page, where it is used to energy efficiency performance of all areas.
- Filter area
(1) Different areas and energy types can be selected;
(2) Users can select between benchmark time and assessment time;
- Annual usage per unit area/usage per capita:
(1) Collect and present the actual usage per unit area/usage per capita during the assessment time and the benchmark time;
(2) Present the actual monthly usage per unit area/capita;
- Energy-saving rate:
(1) Calculate and display the actual energy-saving rate and the target energy-saving rate during the assessment period based on the assessment time, benchmark time, and selected performance indicators;
(2) Collect and display the monthly energy saving rate per unit area/capita. Use green to indicate energy saving, and use red to indicate energy usage.
- Energy sub-item structure
Statistically analyze and present the actual usage of the selected energy sub-item during the assessment period and the benchmark period.
- Usage per unit area/capita trend
(1) Provide daily display of the usage per unit area/capita of the selected area;
(2) Click a specific time on the graph to go to the Area EnPIs page to view details.
- Energy usage trend
(1) Provide daily display of energy usage of the selected area;
(2) Click a certain time on the graph to go to the "energy usage analysis" page for details.
Other EnPIs
Other performance indicators including cost per unit output value, cost per unit output, cost per unit area and cost per capita, all of which are used in the same way as above indicators.
Notes:
-
Cost: In the[Data Entry Mgmt. - Energy Unit Price]module, you can set the energy unit price. If these values are not available, please check in the [Energy Unit Price] module.
-
Cost indicator: In the[Target EnPIs - Energy Cost Indicators]module, you can set cost indicators for the area. If there is no target value, you can enter the value in the [Energy Cost]module.
Usage Benchmarking Analysis
Click EnPIs Mgmt. > Usage Benchmark to go to the Usage Benchmark Analysis module.
This module statistically analyzes and displays detailed comparisons between actual usage and target usage across areas, departments, and enterprises.
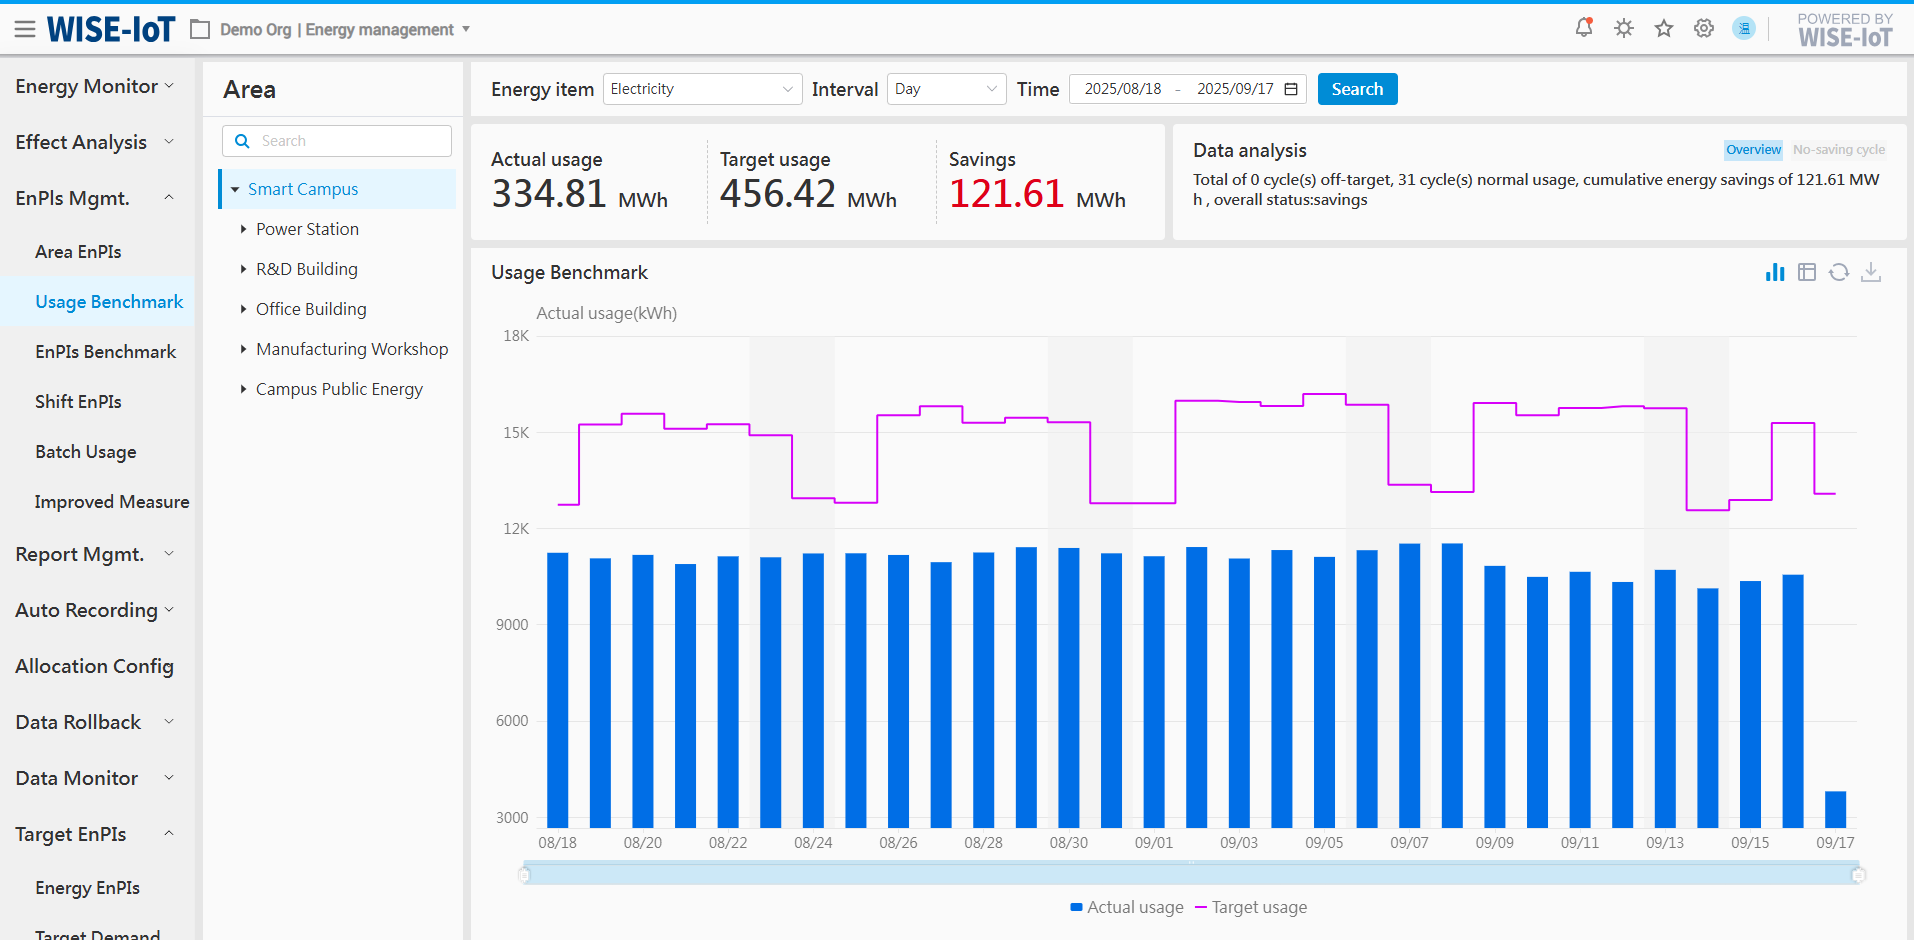
- Statistical area
The system statistically analyzes the actual energy usage and cumulative energy saved in selected areas, compare energy conservation performance across time periods, provide diagnostic results, and highlight abnormal areas with detailed insights.
(1) Click Overview to know the overall energy conservation performance of the area;
(2) Click the energy usage period to display statistics for areas exceeding target energy usage.
- Graph section
(1) Display energy usage across different time periods, with benchmarking against energy-saving baselines to flag overconsumption and conservation achievements
(2) For over-limit periods, hovering over the bar chart triggers a panel displaying abnormal energy usage in sub-nodes of the exceeding area.
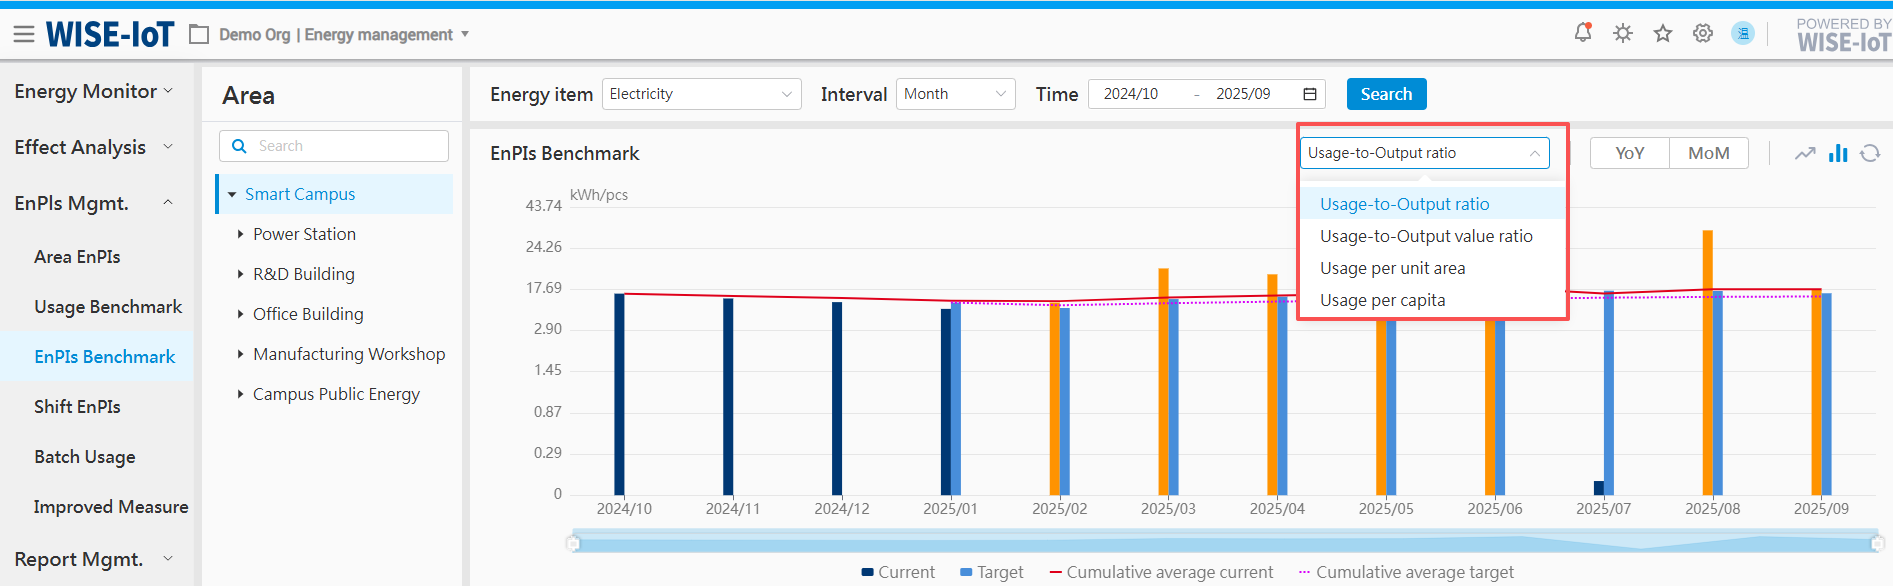
EnPIs Benchmark Analysis
Click EnPIs Mgmt. > EnPIs Benchmark Analysis to access the Area Unit Energy Consumption Benchmarking Analysis module.
The module statistically analyzes and displays the energy performance indicators of the area during different time periods, including usage-to-output value ratio, usage-to-output ratio, usage per unit area, usage per capita, to assist managers in making decisions and verifying adherence to targets.
Unit Energy Usage Benchmarking Analysis
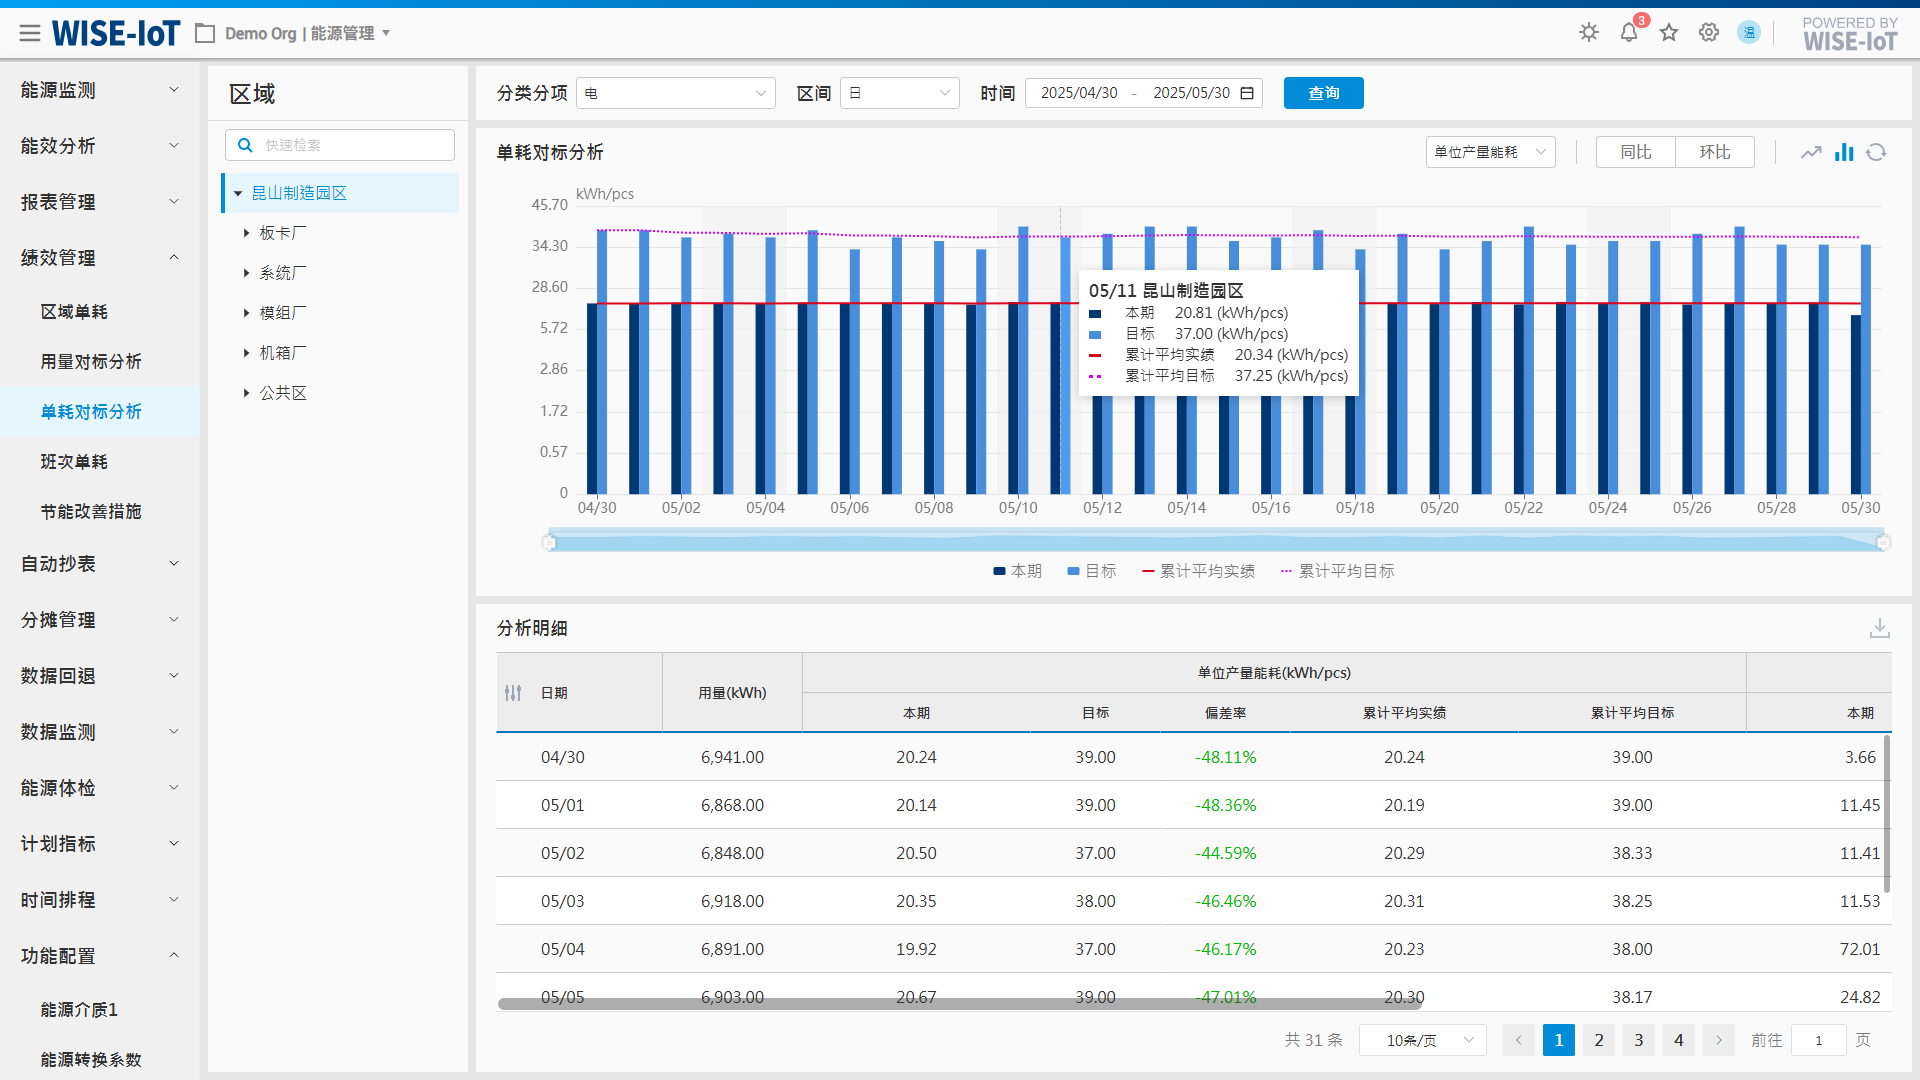
- Filter section
(1) Different areas and energy types can be selected;
(2) Users can select between benchmark time and assessment time.
- Graph section
(1) Select any unit usage indicator (usage-to-output value ratio, usage-to-output ratio, usage per unit area, usage per capita) to be presented in a bar chart;
(2) Select year-on-year analysis to display data for the current period and the same period last year.
(3) Select month-on-month analysis to display data for the current period and the immediately preceding period.
(4) Display the target unit usage indicator data of the selected area;
(5) Calculate and display the cumulative average unit usage within the selected time range for the selected area;
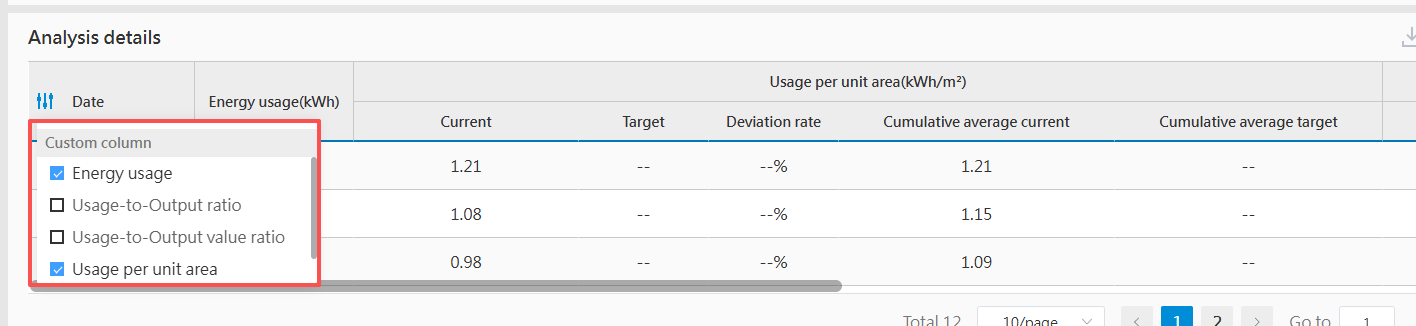
- Table section
(1) Support custom display of energy usage and energy performance indicators.
(2) For year-on-year and month-on-month growth rates, values greater than 0 are displayed in red and small than 0 in green.
Display Settings for EnPIs Dictionary Values
Please refer to 2.4.2.1 for the content in the red box.
Analytical Breakdown - Custom Column Configuration
The content displayed in the red box below originates from the indicator configurations in the global settings and local settings within the [Page Configuration] module. Please refer to the description in the Page Configuration module for details.
Batch energy consumption
Batch configuration matters
To use the batch energy consumption feature, the customer site needs to meet the following conditions:
-
[The customer must provide the batch schedule according to the ECOWatch batch standard interface, i.e., provide the start and end times of batch production for each production line.]
-
[The customer requires the ECOWatch production standard interface to provide batch production reports, specifically: providing production information for each production line batch and affiliated energy department information.]
-
[The batch time periods and metering instruments at the customer's site can accurately calculate the batch energy consumption. Cross-production of products on the same production line is not supported; otherwise, the batch information measured in this way will be inaccurate.]
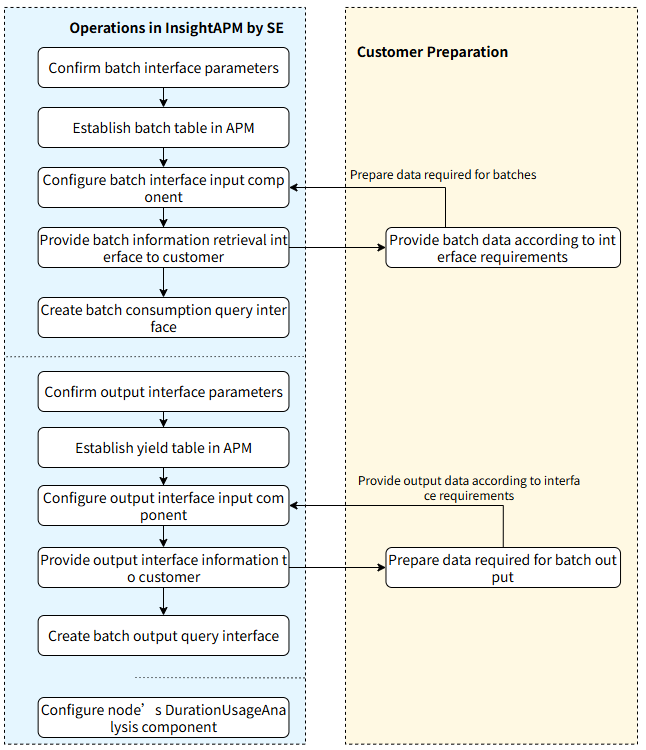
**When using the batch energy consumption function, implementers need to ensure:**The production line nodes corresponding to ECOWatch are configured with the 'DurationUsageAnalysis' component in InsightAPM.
The overall configuration and operation process is as follows. See Sections 4.1, 4.2, and 4.3 for details.
View Batch Energy Consumption Information
After the above implementation and configuration are completed, batch information can be queried on the batch energy consumption page.
Click EnPIs Mgmt.>>Batch Usage,Go to the batch energy consumption page, as shown in the figure below:
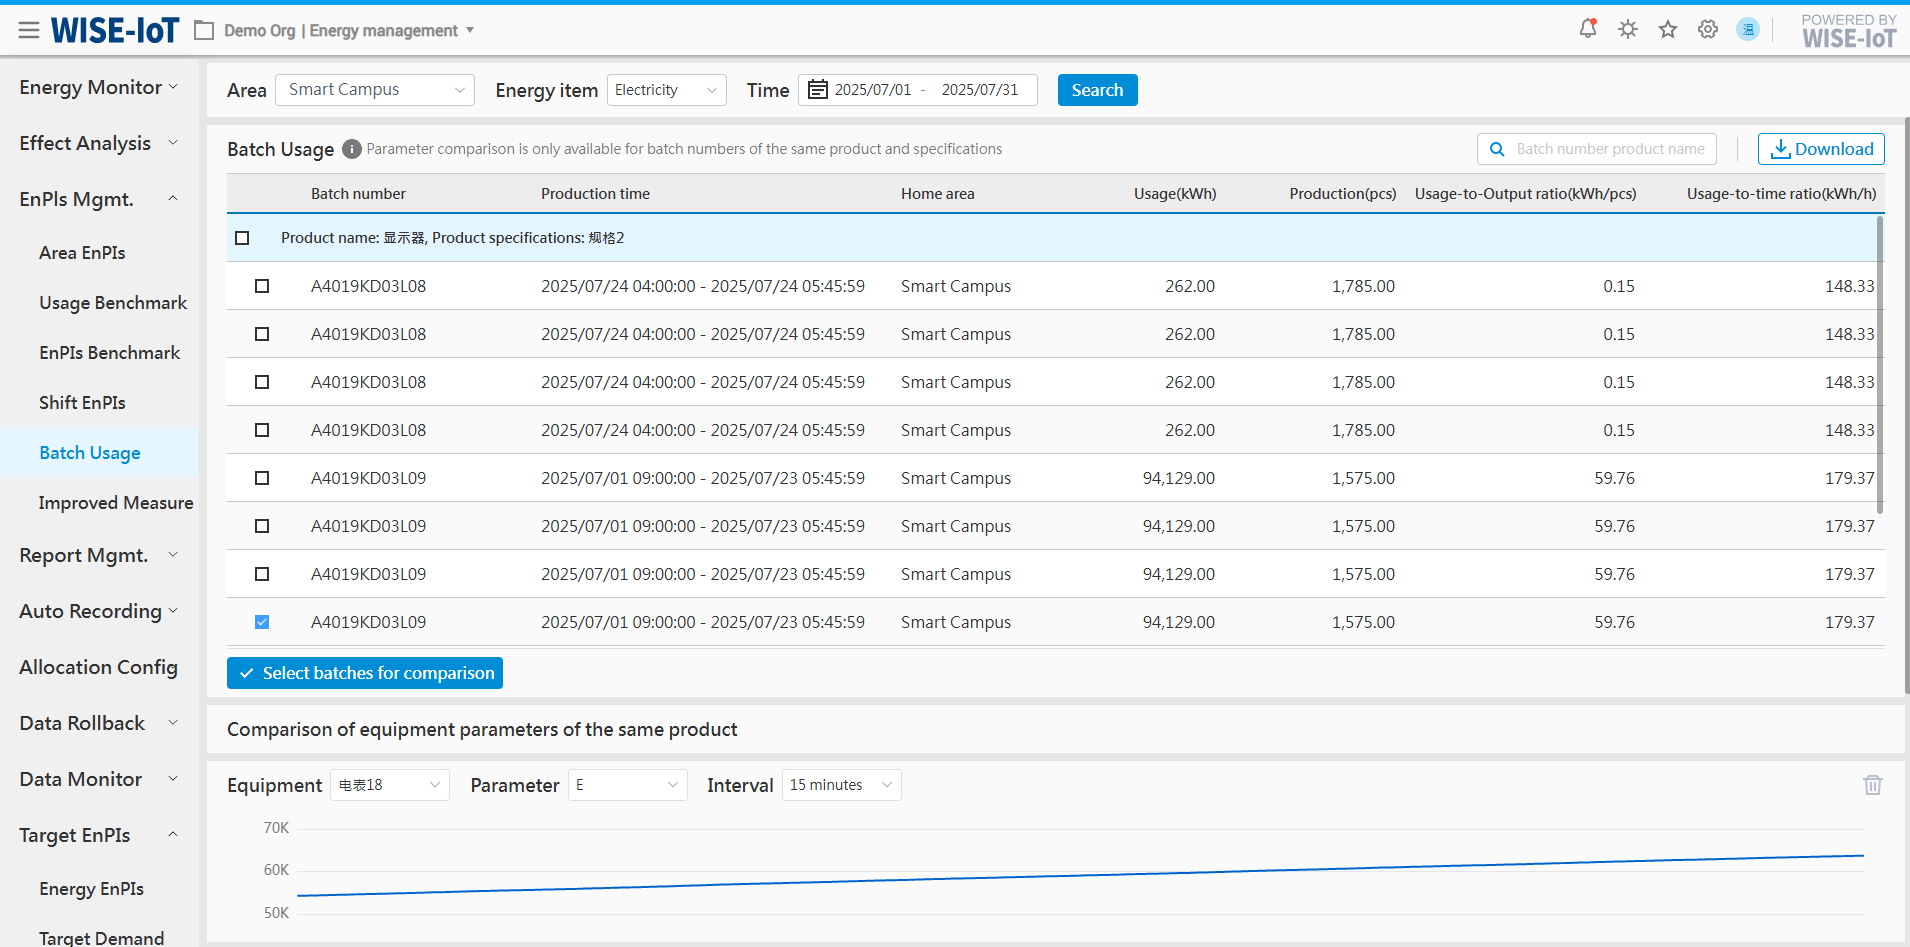
-
Based on query conditions, query batch information for all production lines. The system filters batches for the same product according to the plan.
-
Provide fuzzy search for batch number, product name, or specification name;
-
Click the "Download" button to export the current query data to Excel.
When an anomaly is found in certain batch information, you can in the "Check the batch information, then click "Upon clicking the button, the corresponding product device parameter comparison page will display real-time parameter information for these batches of related devices.
When abnormal batch information is detected, you can check "
 " to select the batch information and then click the "
 " button. The comparison page for device parameters of the same product will then display real-time parameter information of the devices associated with these batches.
Similar Product Equipment Parameter Comparison
On the initial page, this area will remain empty if no batch comparison is selected. Once a selection is made, the system will display content based on the chosen criteria, as shown in the figure below.
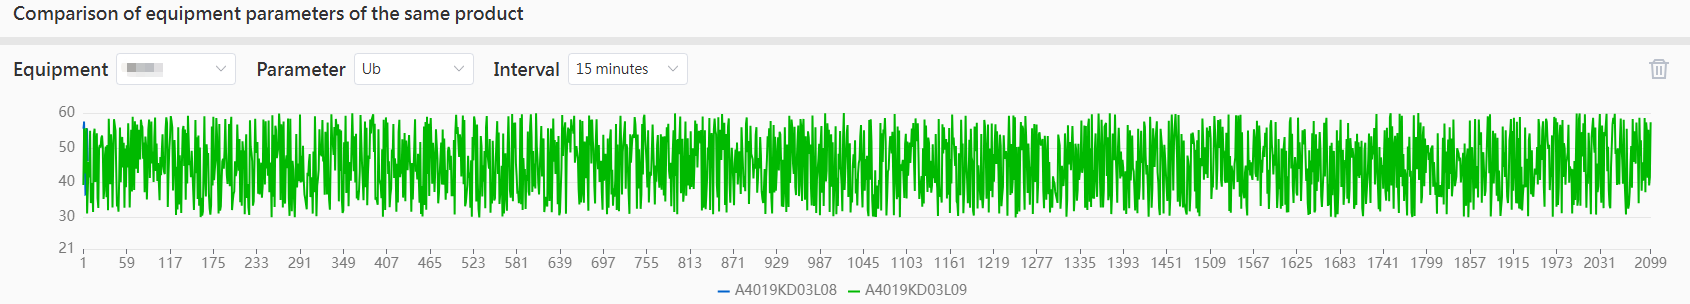
Each graph displays one piece of device parameter information. If you need to view different parameter information for the same device, or different parameter information for different devices, you can click the "Add" button below to add another device panel, as shown in the figure below:
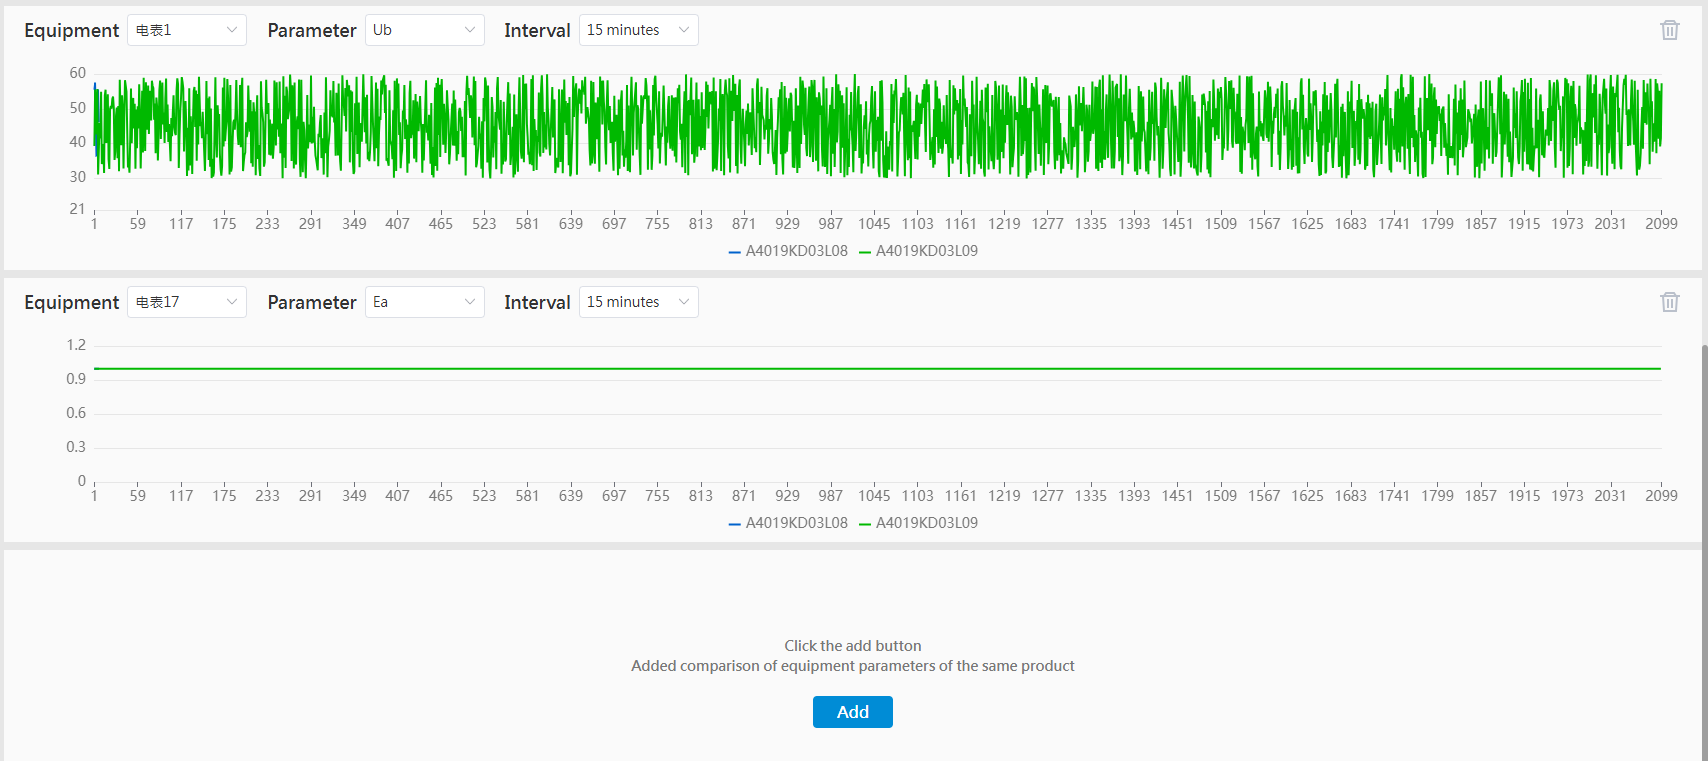
If a certain panel does not need to be displayed, click the top-right corner's""button, can delete this panel.
Shift EnPIs
Shift-based unit consumption is one of the key indicators for evaluating production efficiency. By monitoring and analyzing the shift-based energy consumption and shift-based unit consumption information of each production line, potential energy efficiency improvement opportunities can be identified, such as optimizing production processes and operating methods, improving equipment energy utilization efficiency, and strengthening personnel work efficiency, etc.
Shift Configuration Requirements
For the Shift-Based Unit Consumption Analysis page to display properly, the following conditions must be met:
-
The selected area must have shift period information configured in the TimeSchedule module.
-
The selected area must have corresponding output value and production data available in the interface, as detailed in Section 4.1.
Schedule Query
Click EnPIs Mgmt.>>Shift EnPIs,Enter the regional shift unit consumption analysis page, which defaults to the shift tab page, as shown in the figure below:
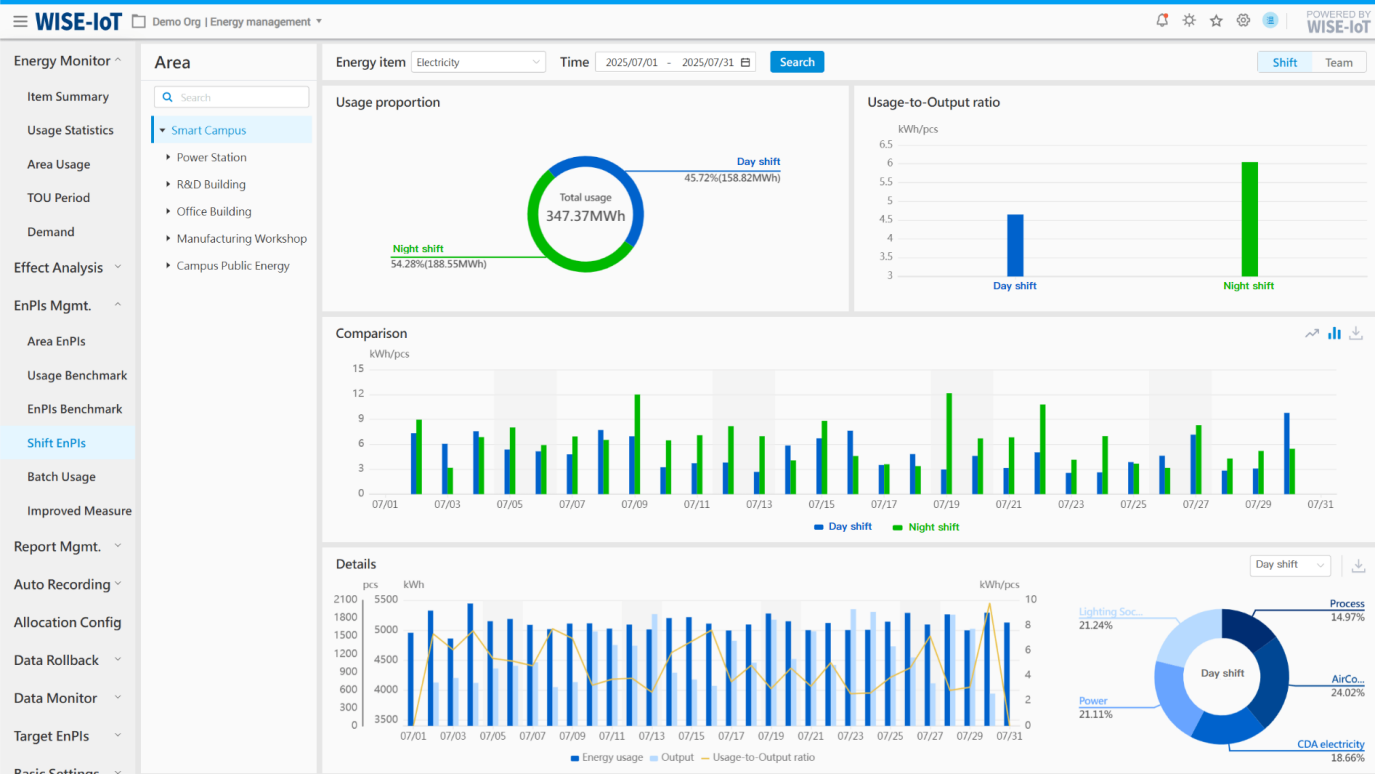
Function Description:
-
Based on the filtering conditions, summarize and display the usage information and unit consumption information for each shift;
-
Based on the regional shift usage and regional output value/production information, calculate and display the unit consumption information for each shift.
Click "
 "button, which allows you to export the displayed information to Excel.
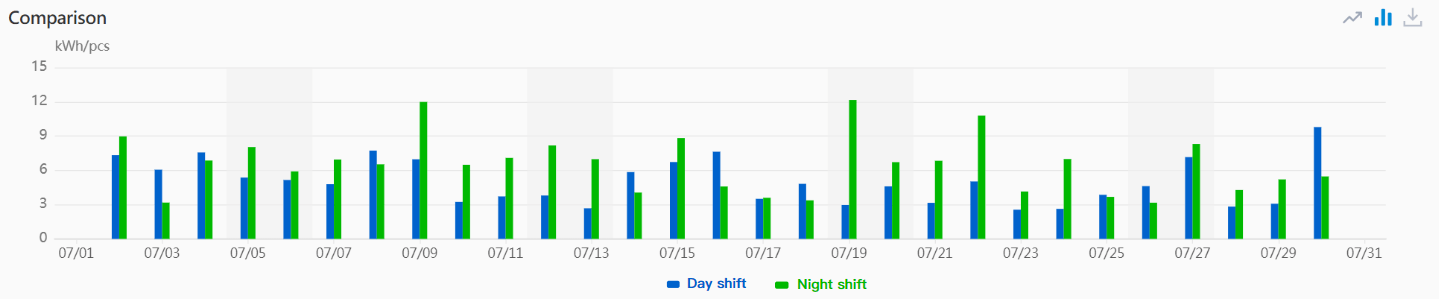
-
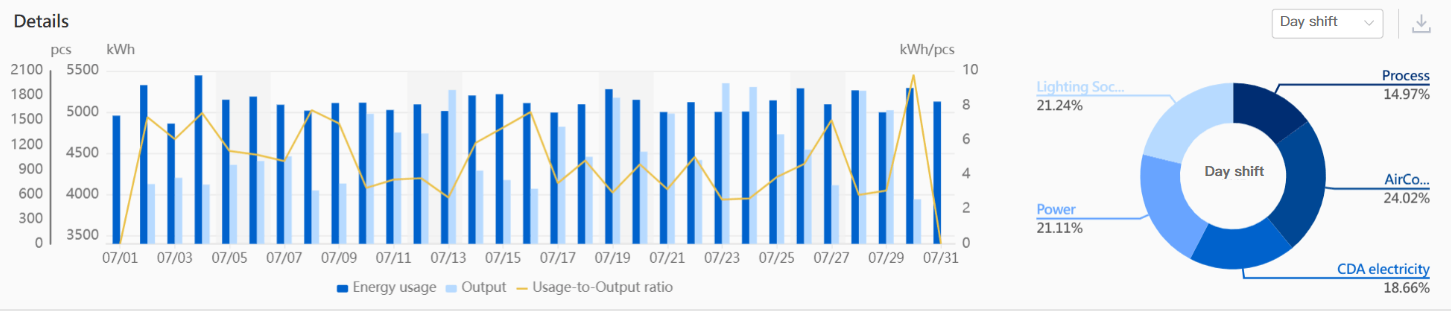
Detailed display of data for each shift, including usage, output, unit consumption, sub-item consumption, and other information.
-
Click "
"button, which can export the displayed information to Excel; -
Click the drop-down box to switch between various shifts and view the details of each shift separately.
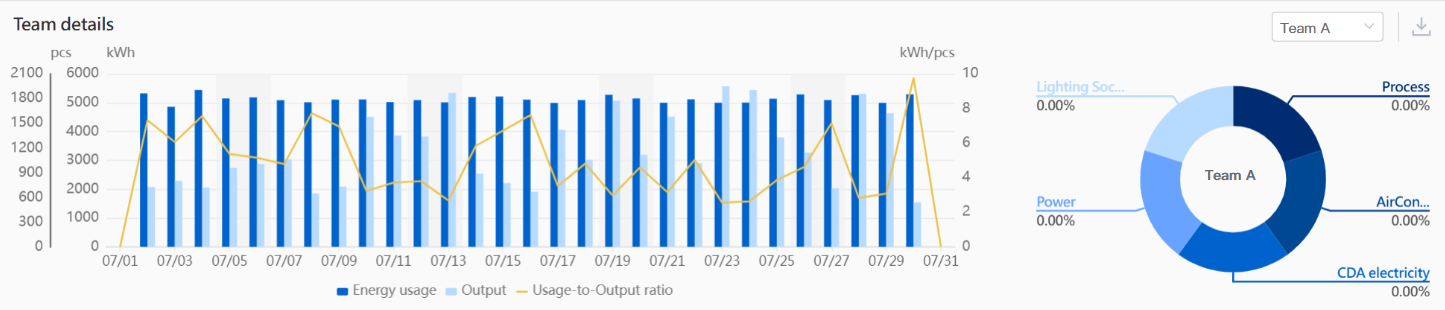
Team Query
Click EnPIs Mgmt.>>Shift Unit Consumption Analysis,Go to the Regional Shift Unit Consumption Analysis page, click the Team tab, as shown below:
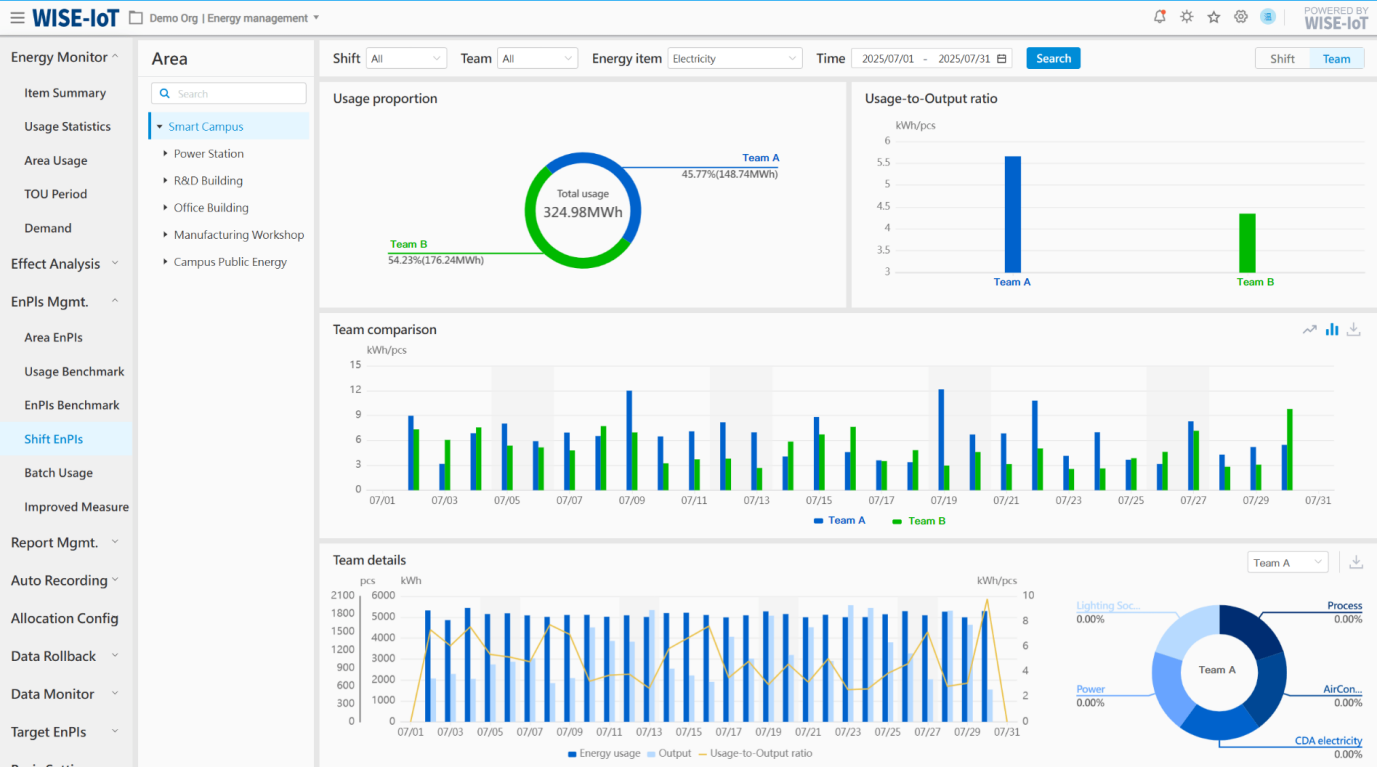
Feature Description:
-
Based on the filtering criteria, calculate and display the usage information and unit consumption information for each team;
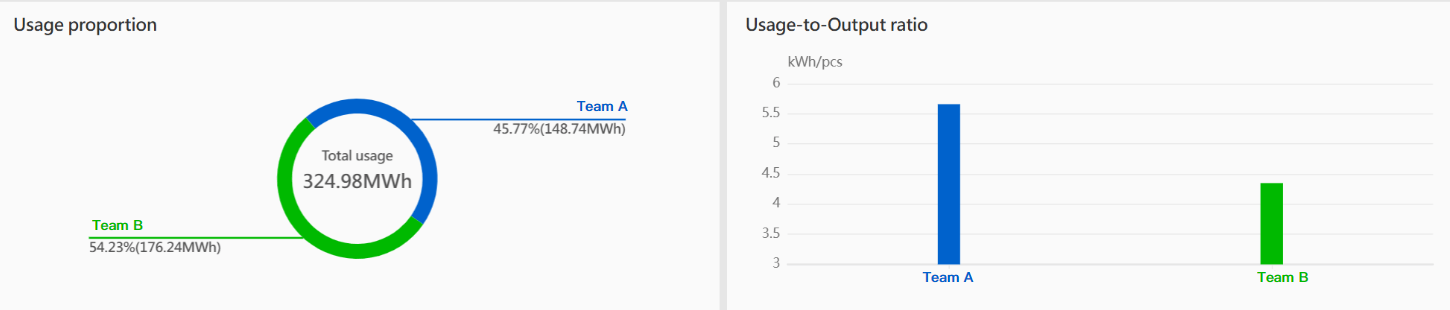
-
Utilizing the area's shift utilization, regional output value/production volume information, and shift information associated with work teams, calculate and display the unit consumption information for each work team.
Click "
 " button, can export the displayed information to Excel.
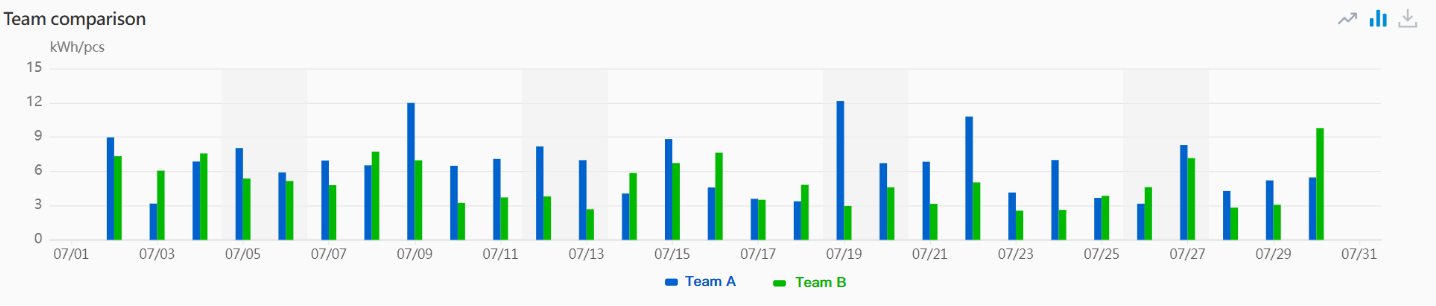
-
Detailed display of data information for each team, including consumption, output, unit consumption, and sub-item consumption.
-
Click "
" button, which can export the displayed information to Excel; -
Click the dropdown box to switch between different teams and view the detailed data for each team separately.
Improved Measures
Click EnPIs Mgmt. > Improved Measures to go to its recording module.
The module maintains detailed records of annual energy-saving retrofit projects implemented enterprise-wide and at departmental (plant) levels.
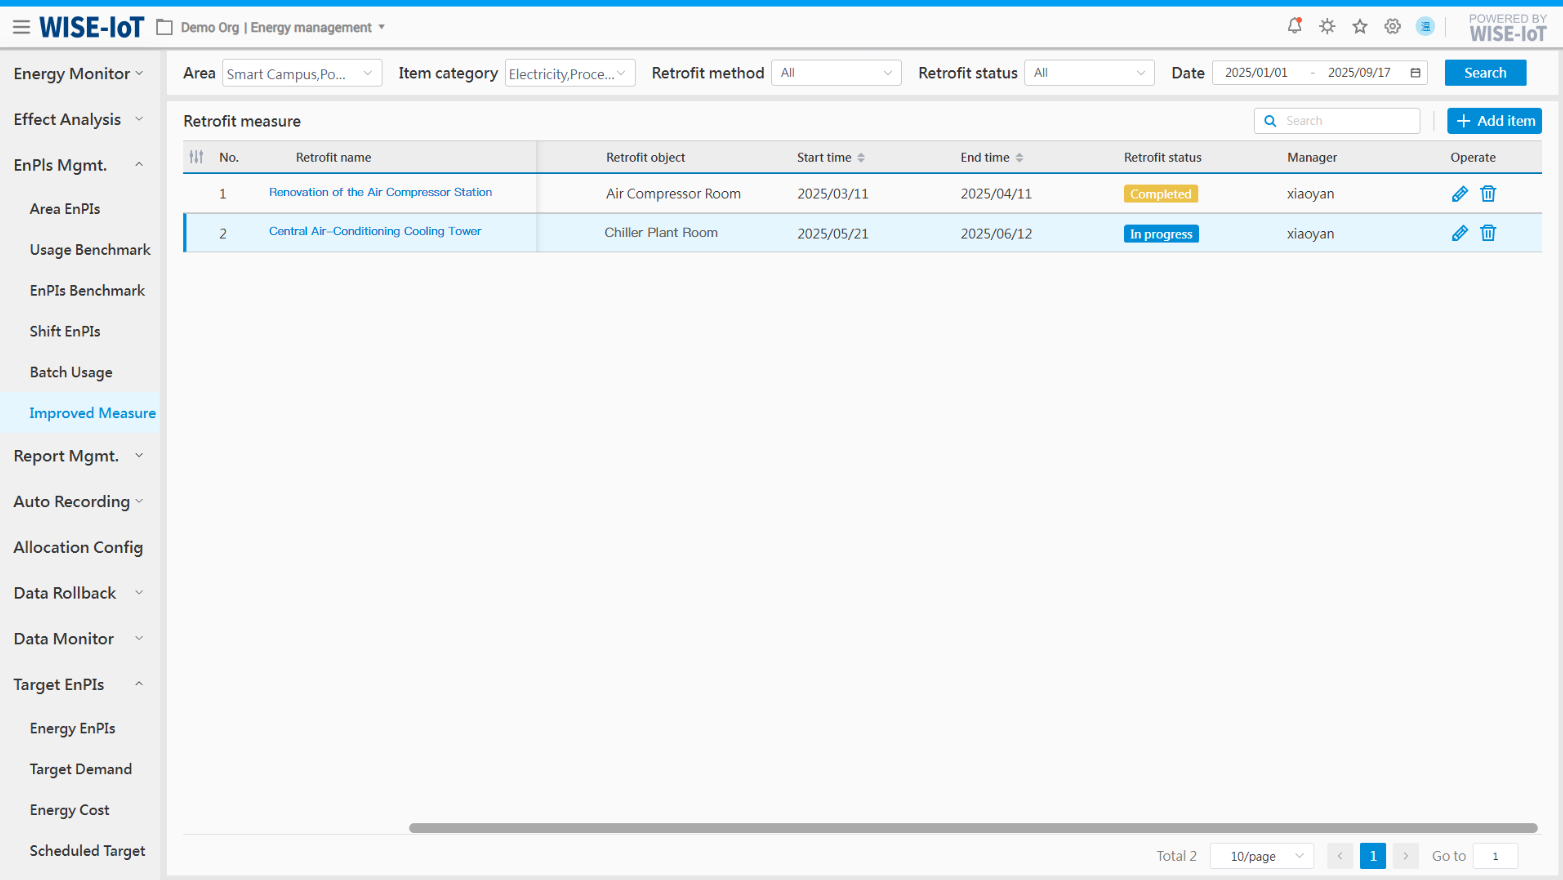
The interface provides diverse filtering criteria, enabling users to query retrofit projects by type. By default, all retrofit projects for the current calendar year are displayed.
-
Provide fuzzy search for retrofit projects and retrofit objects.
-
Click "+ New item" to go to the Retrofit Project Recording interface.
-
Click "
 " in the retrofit project list to edit project details.
 -
Click "
 " in the retrofit project list to delete relevant information of retrofit projects;
 -
In the Energy Saving Improvement Measures list:
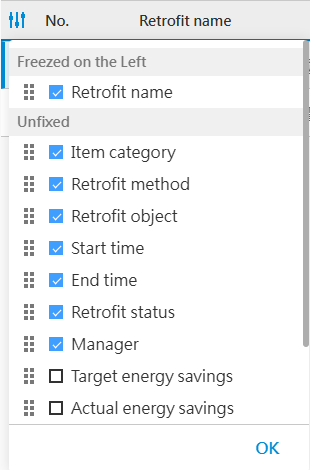
(1) Click the "" button to customize column display;
(2) Sorting is supported by start time, end time, target energy savings, actual energy savings, actual energy saving rate, investment cost, etc.;
(3) Click the "Retrofit Name" in the project list to view detailed project information and energy saving improvement benefits.
Add Retrofit project
Fill in all the required information on the New Retrofit Project page and save it.
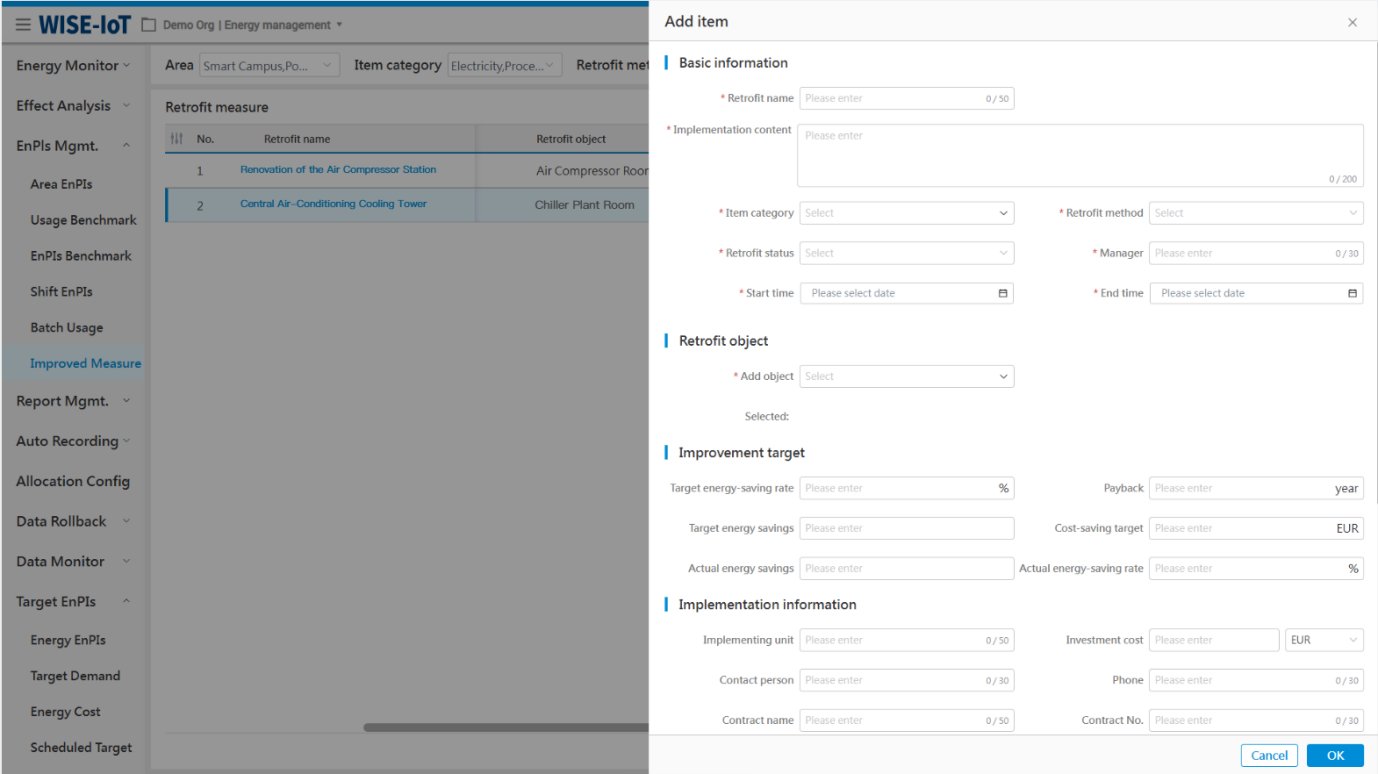
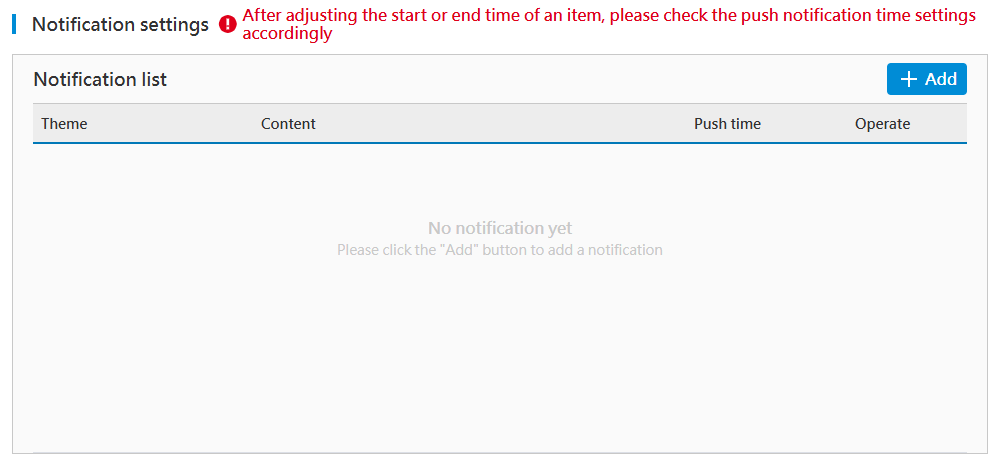
In addition to filling in basic information, the system provides project notification settings, as shown in the figure below.
Click the "Add" button to enter the project notification time setting page, as shown in the figure below.
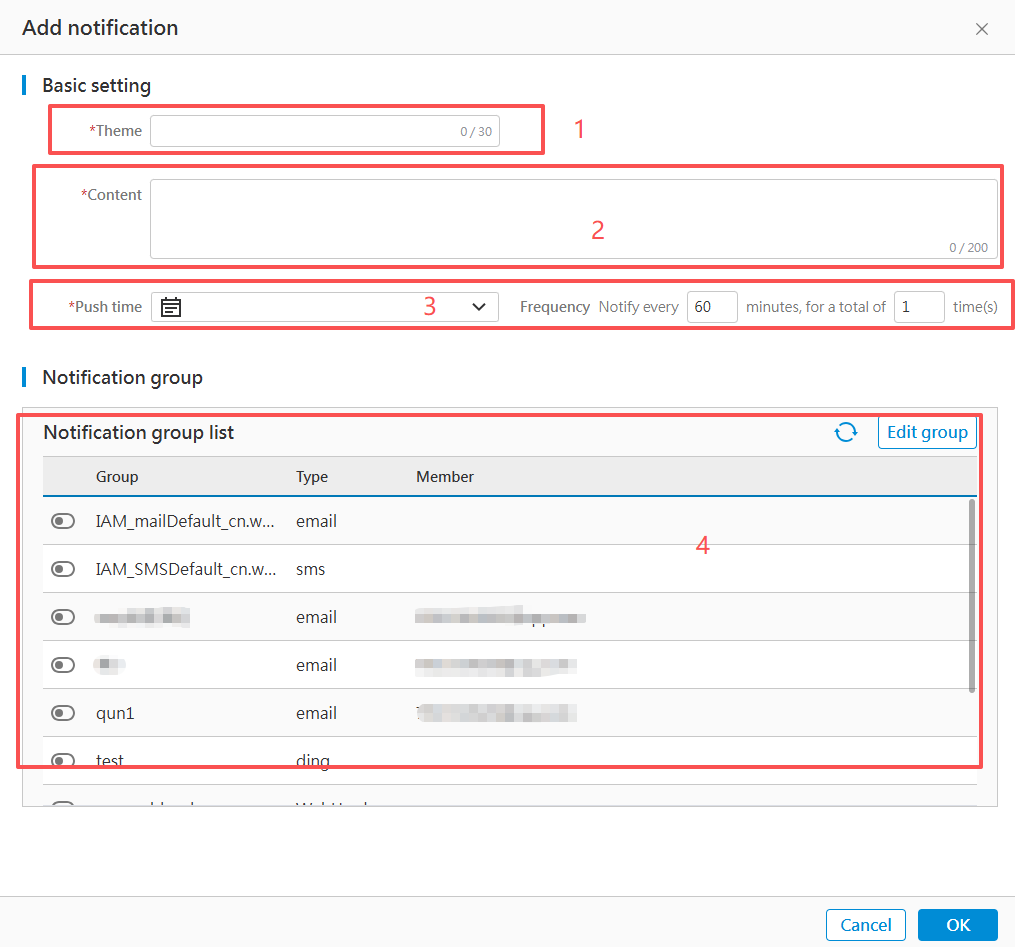
Follow the steps below to configure the settings, then click "OK" to save. Once the overall configuration is saved, the system will trigger the message notification mechanism at the scheduled time based on the project settings, and push the configured information to platforms such as Email, Enterprise WeChat, DingTalk, and Lark.
Review Retrofit Benefits
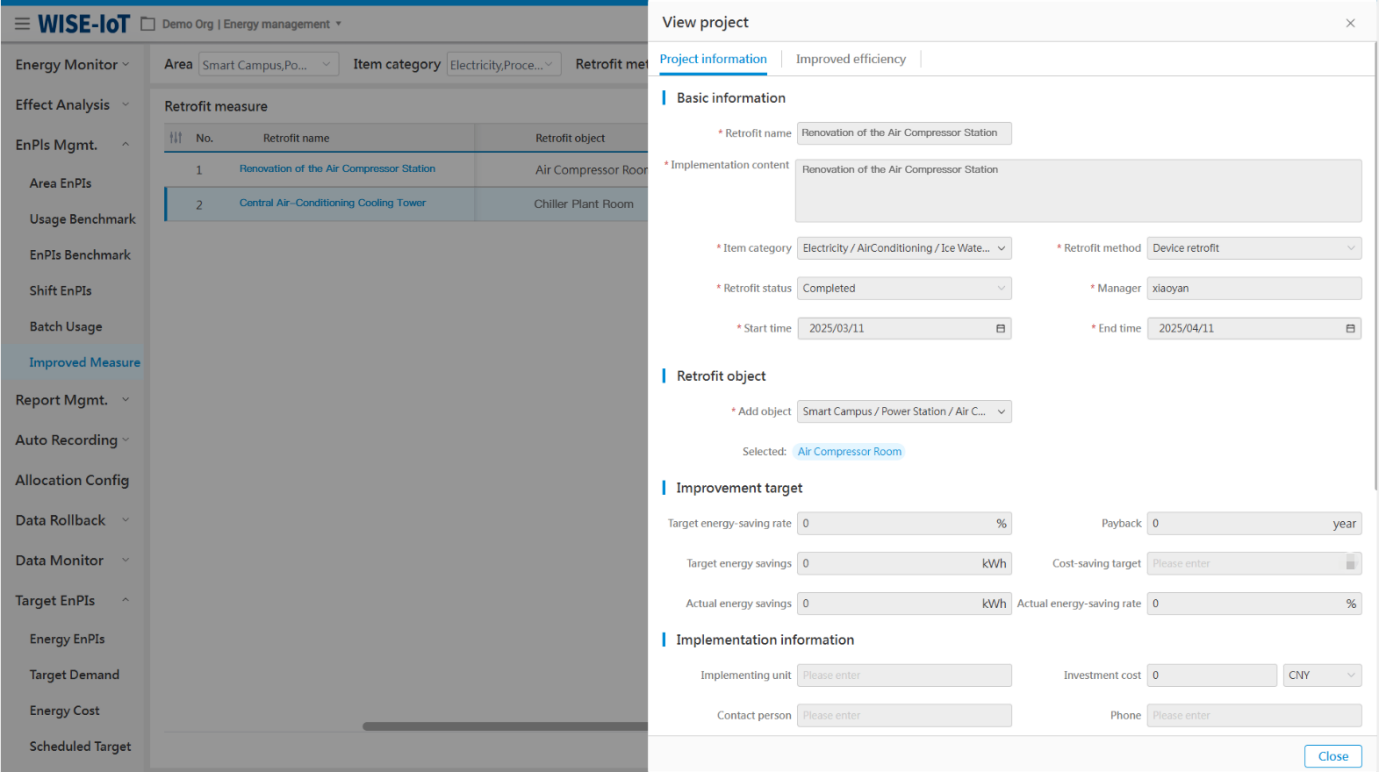
Click the retrofit name in the list to view retrofit projects.
Click "Project Information" to view all details of retrofit projects:
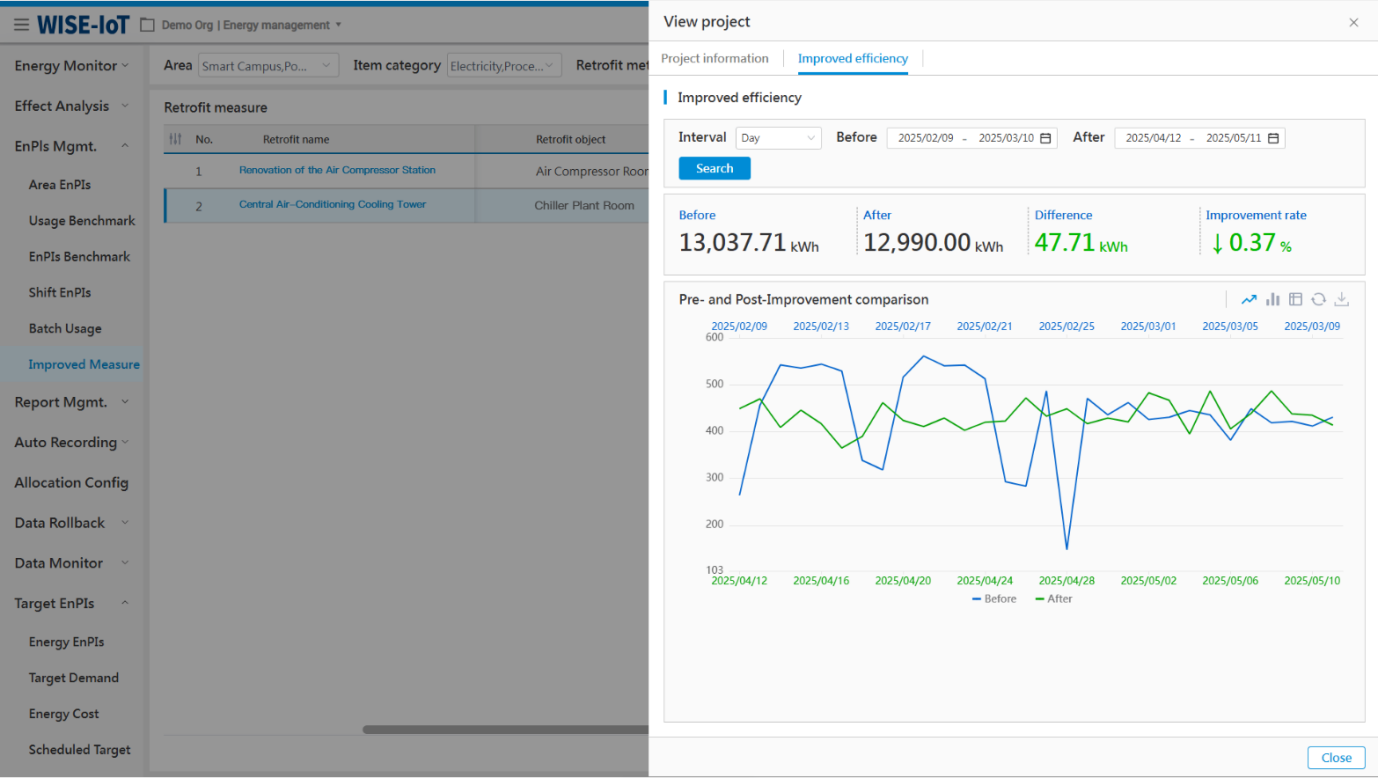
Clicking on "Energy-saving Improvement Analysis" allows users to view usage benchmarking and improvement benefits between pre- and post- retrofit project periods:
Report Management
Annual Report
Click Report Management > Annual Report.
The Annual Energy Usage Report module statistically analyzes and displays the annual energy usage of the enterprise and each area. This report meets ISO50001's annual audit requirements.
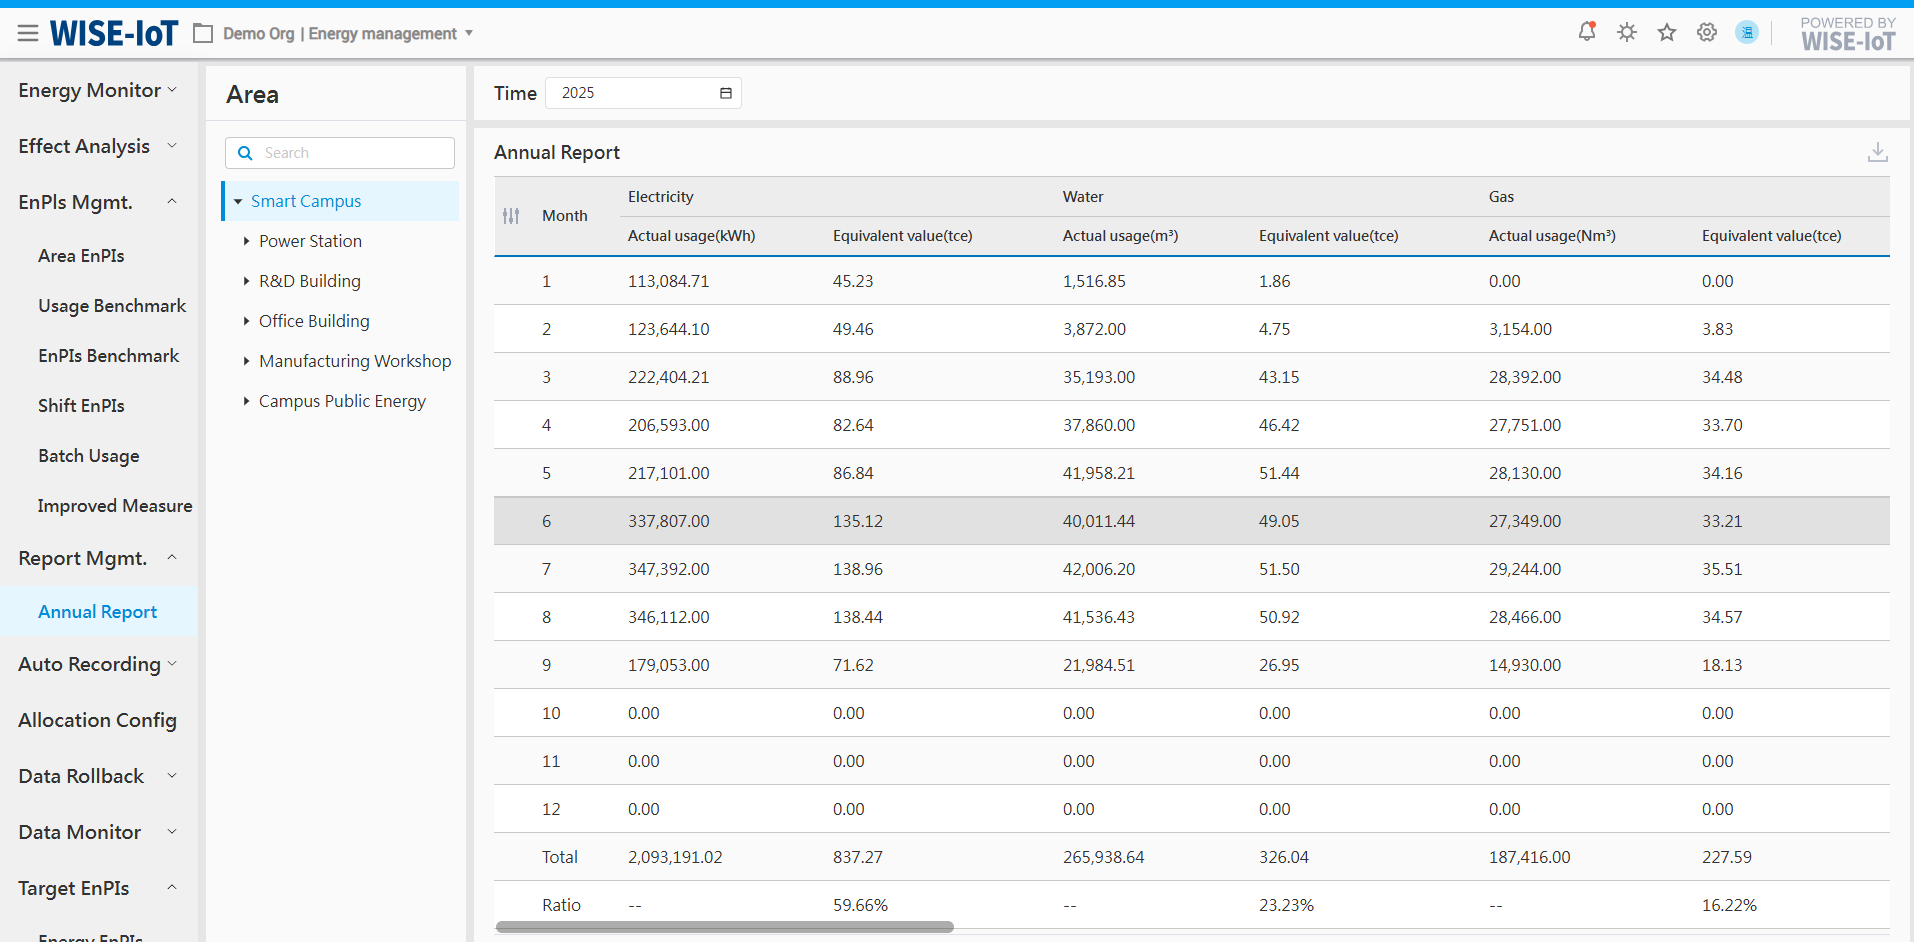
-
The user can select any year as needed;
-
Click "
 " on the left of the list to display/hide columns.
 -
Click "
 " to export the current report in Excel.
Automatic Recording
Automatic meter reading automatically analyzes the data from all energy meters in report. There are three ways to retrieve data: meter reading, meter usage, and scheduled record.
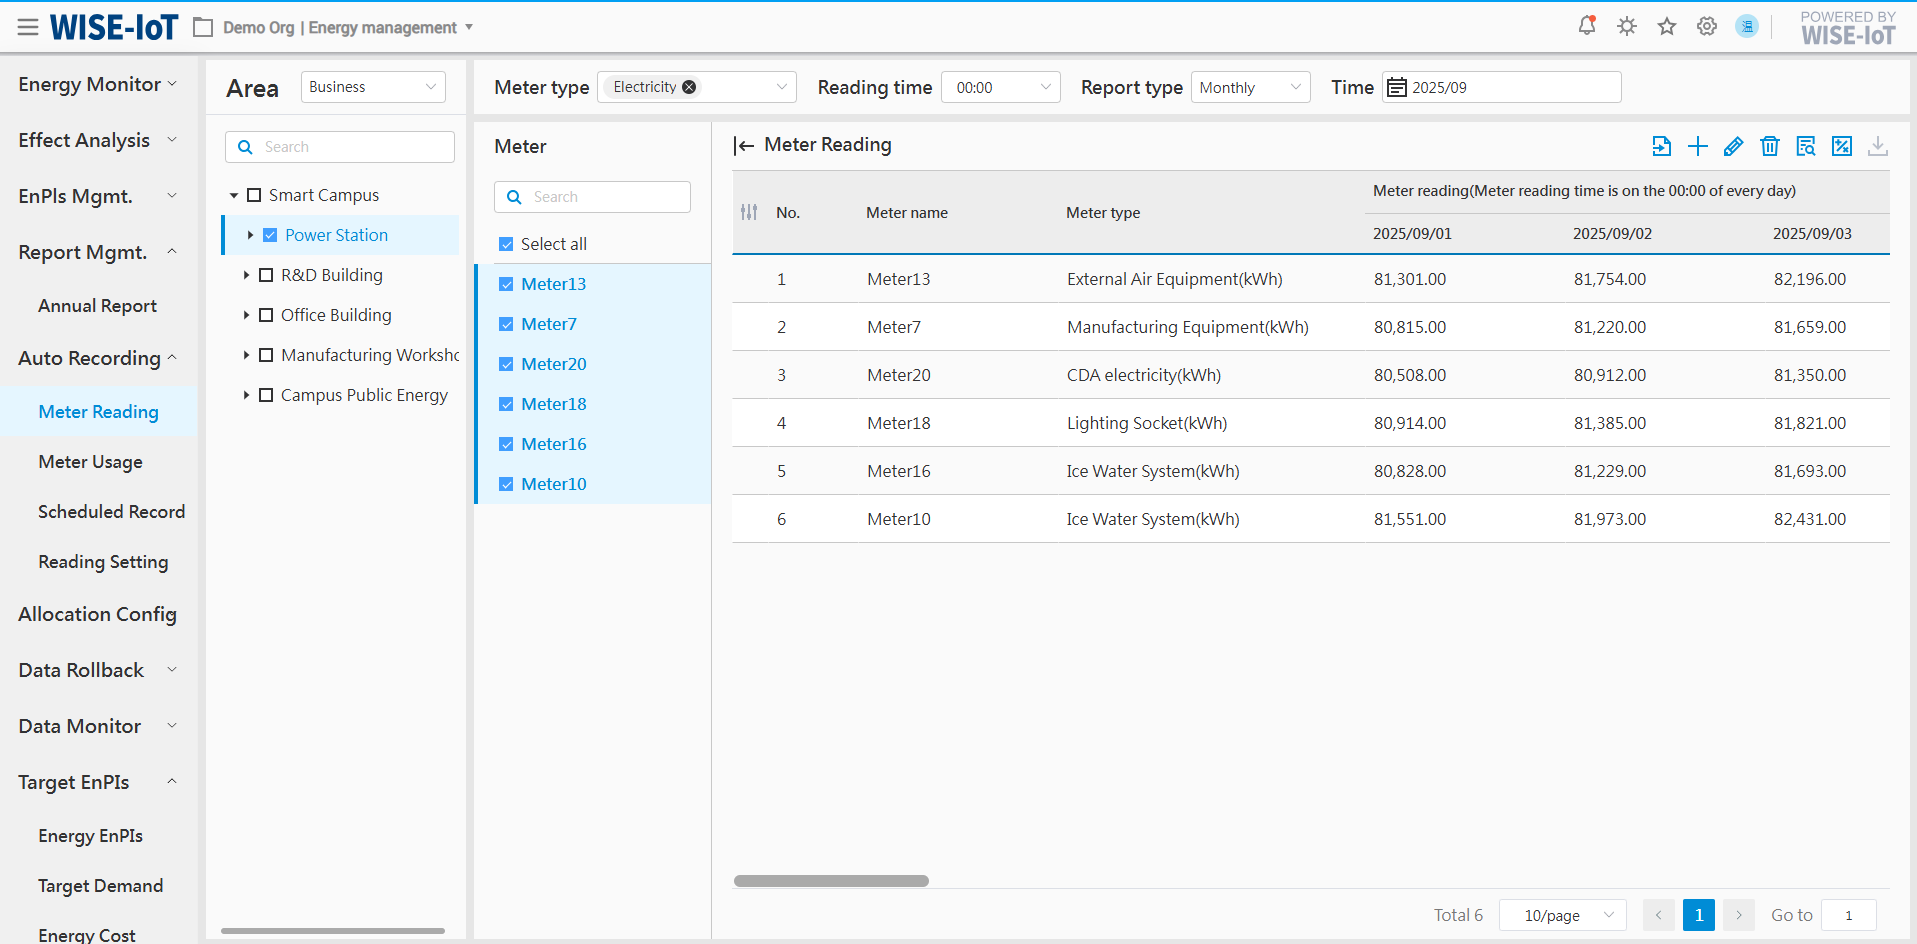
Meter Reading
Click Automatic Reading > Meter Reading.
The Meter Reading module displays the original readings of each meter, including annual reports, monthly reports, daily reports, as well as meter reading for customized time periods.
- Filter area
(1) Meter type: Support selection of meters for different energy types, such as electricity meters, water meters, gas meters, etc.;
(2) Reading time: The range is from 00:00 to 23:00, in hourly units;
(3) Report type: Support annual reports, monthly reports, daily reports, or meter readings for custom time periods;
(4) Time: supports time selection at daily, monthly, or annual granularity based on the selected report type;
- Area/meter selection area
There are two ways to select areas:
(1) Business topology: Click "Select by Business Structure" in the top-right corner of the area to display the business asset groups configured by the user. The system filters associated meter information based on the business topology.
(2) Meter topology: Click "Select by Meter Structure" in the top-right corner of the area to display the meter asset groups configured by the user. The system filters associated meter information based on the meter topology.
Note: To display areas based on meter topology, the meter asset group type must be set to "meter" and the project must be "ECOWatch" in the APM system.
(3) Meter reading area: Click "Select by Meter Reading Area" in the top-right corner of the area to display the meter groups configured by the user in the [Meter Reading Settings] module. The system filters associated meter information based on the meter reading area.
After selecting an area, the right panel displays the raw data of all meter dashboard in that area. It supports selecting individual meters for readings or selecting all.
- Table section
(1) Displays the raw values of each meter at a specific reading time on an hourly, daily, or monthly basis. Click on the right to export the current filtered data to Excel;
(2) Daily report: Display the raw meter values from 00:00 on the selected day to 00:00 the following day;
(3) Monthly report: Display the raw values closest to the meter reading time from the 1st to the 31st (or 30th) of the selected month;
(4) Annual report: Display the raw values closest to the meter reading time for the 1st of each month from January to December of the selected year.
(5) Click "![]() " to import the raw meter data using the system-provided template;
" to import the raw meter data using the system-provided template;
(6) Click "![]() " to access the Add Meter Readings page;
" to access the Add Meter Readings page;
(7) Click "![]() " to access the Edit Meter Readings page;
" to access the Edit Meter Readings page;
(8) Click "![]() " to access the Meter Modification Records page.
" to access the Meter Modification Records page.
Import Meter Readings
Click "
" to import raw meter data using the system-provided template:
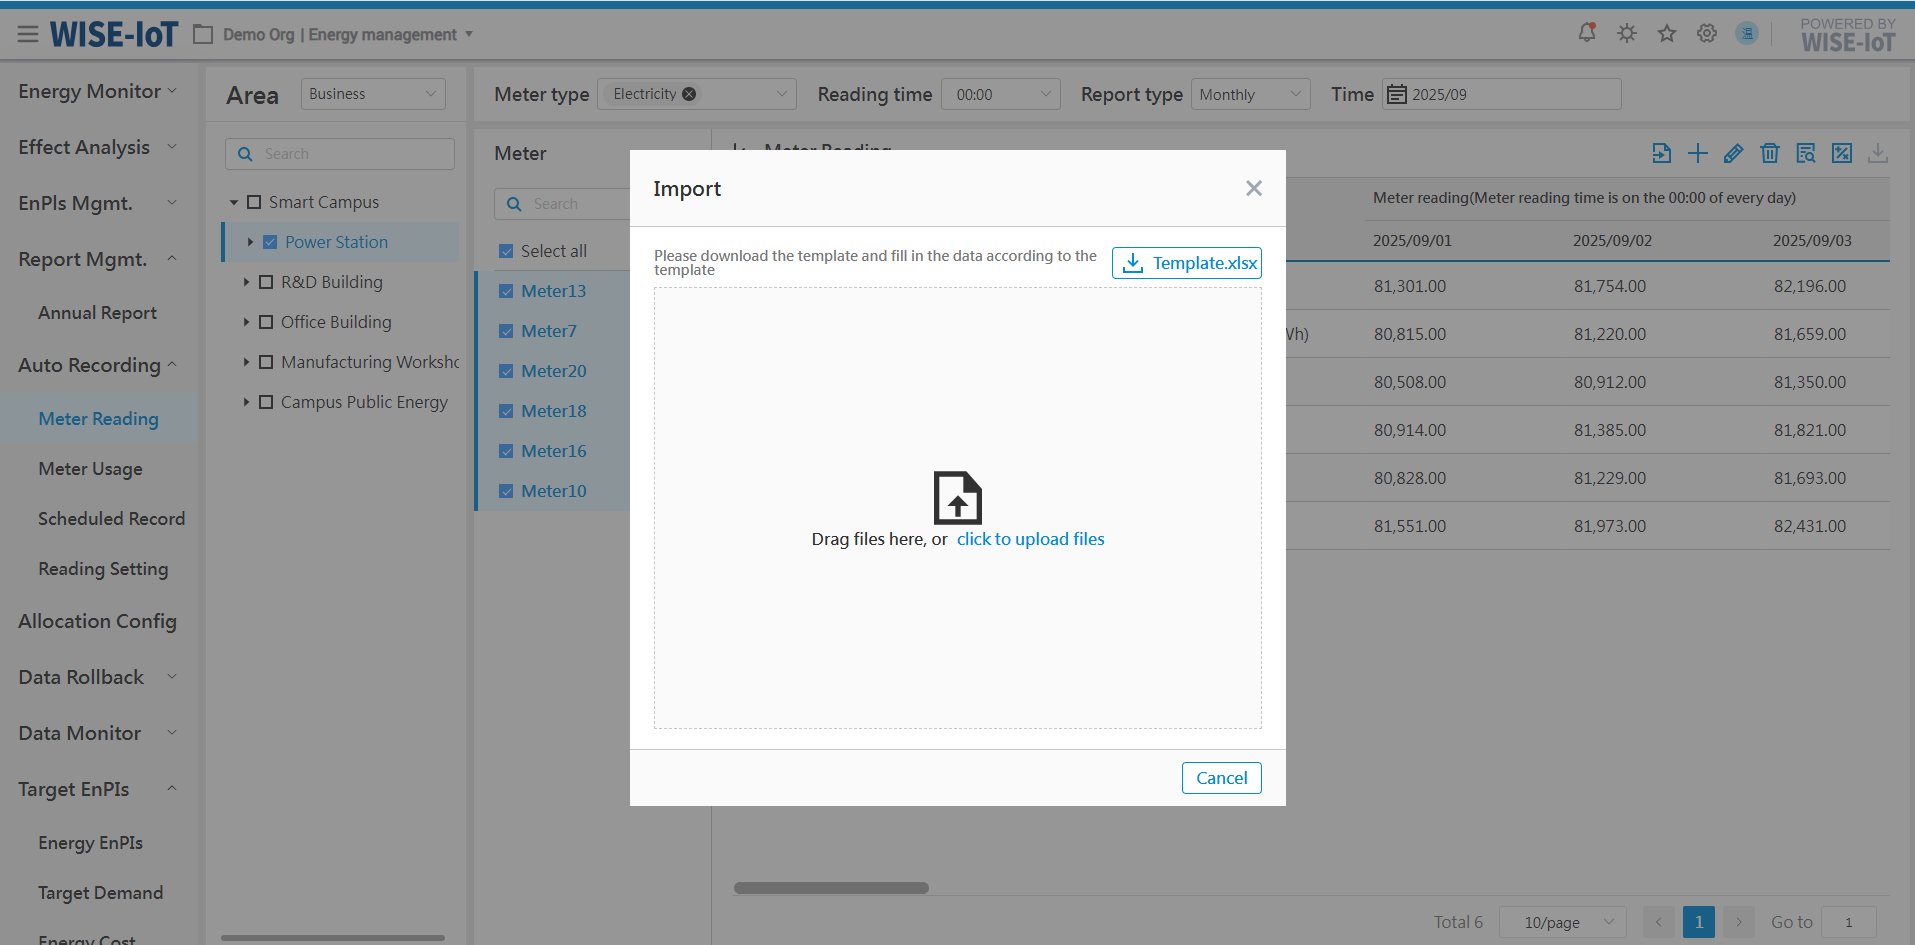
Please follow the below steps:
-
Click "Template.xlsx" at the top right corner of the page to download the import template;
-
Users enter meters requiring backfilled raw meter data in the designated template.
-
Drag the Excel file to the designated page area, or click Upload Document to upload document to the system.
※Meter reading backfilling principle: Backfilling is prohibited for dates with raw data, and permitted for dates without.
Add Meter Readings
Click "
" to enter the Add Meter Readings page.
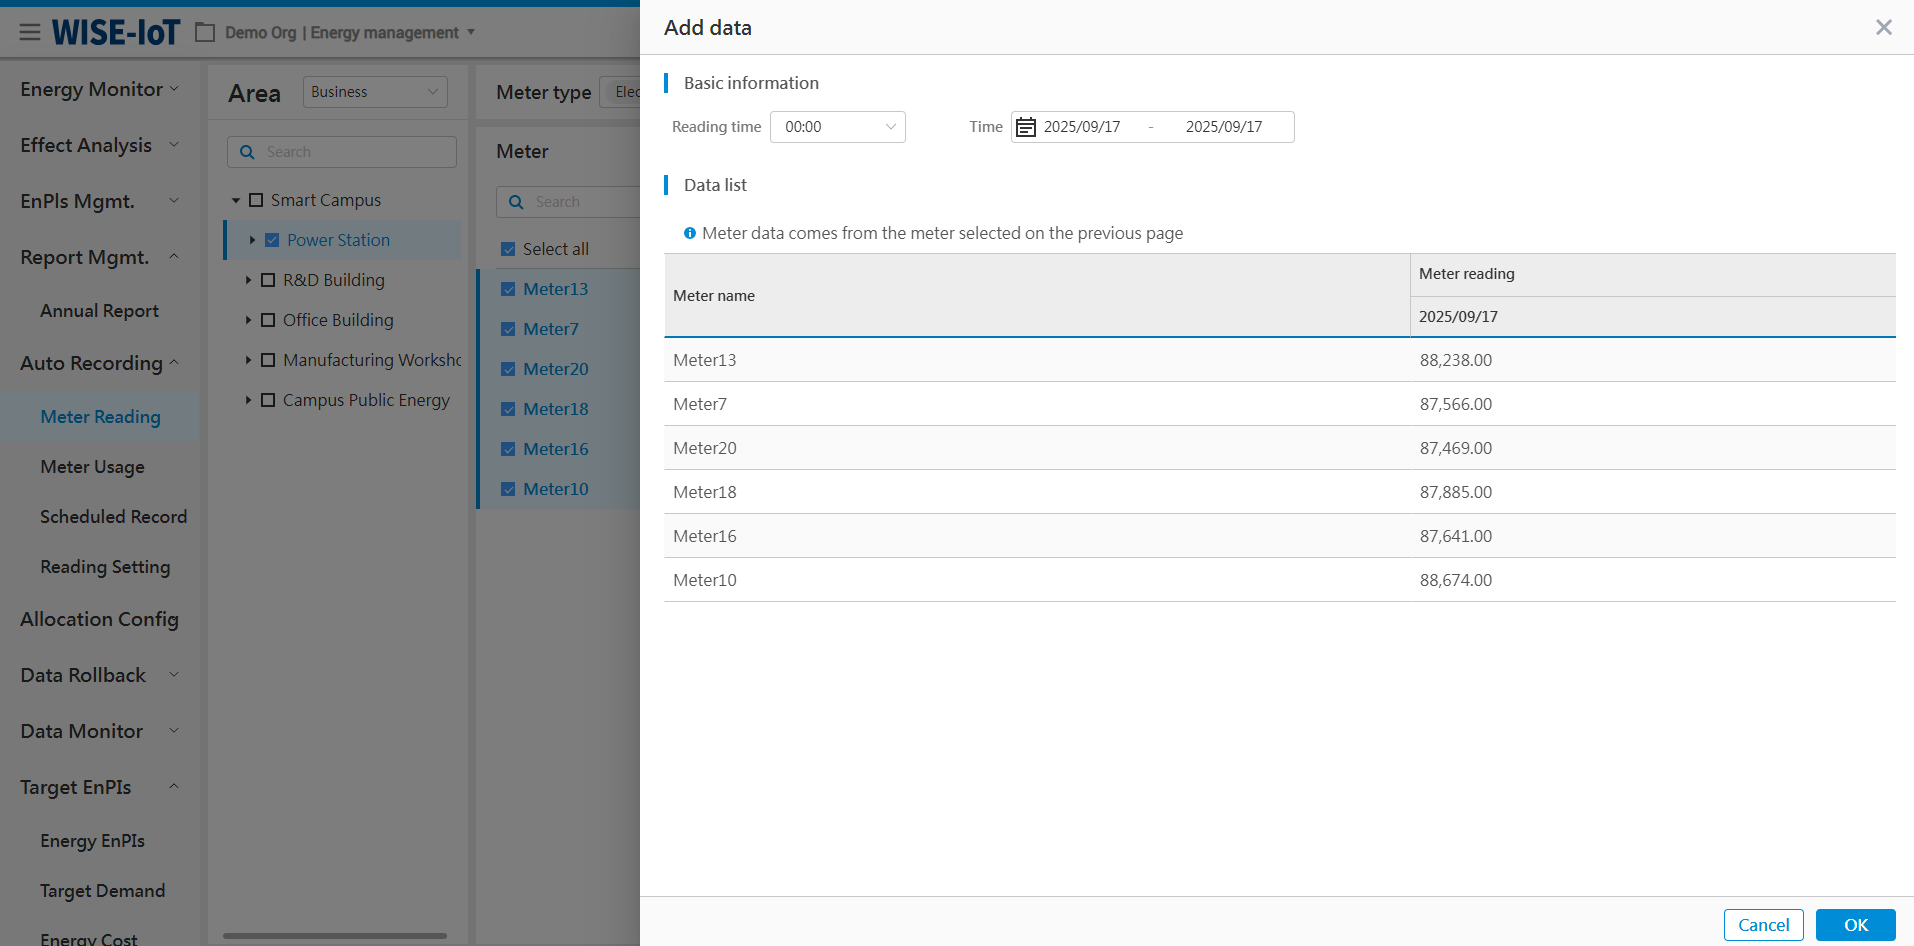
Please follow the below steps:
-
The default meter reading time is 08:00 AM on the backfilling date.
-
Time: Users can select any date within the current month to backfill the data;
-
Meter list: The content displayed is the same as the parent page. Users can input the meter's raw data in blank fields for any date.
-
Click "OK" to save data.
Note: Since the default backfilling time is 08:00, remember to select "08:00" as the meter reading time when querying data on the Meter Reading page.
Modify Meter Readings
Click "
" to enter the Edit Meter Readings page:
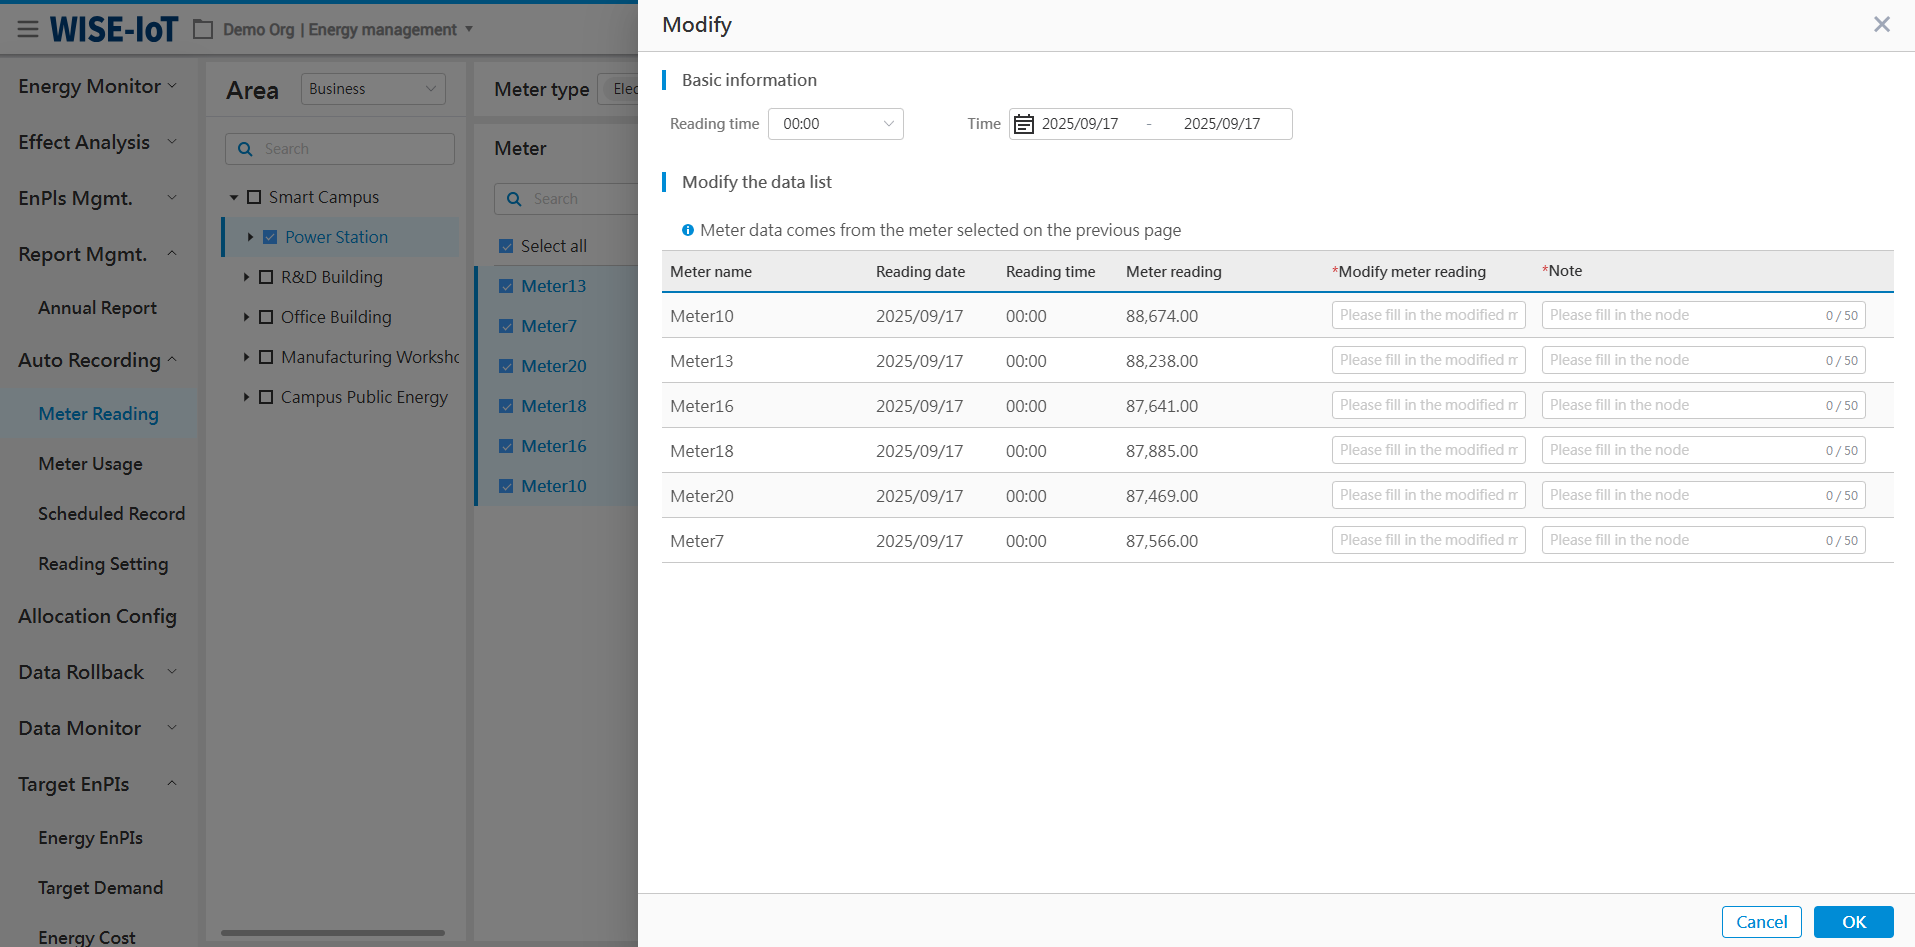
Please follow the below steps:
-
The default meter reading time is 08:00 AM on the backfilling date, and users can select the time as needed.
-
Time: Users can select any date within the current month to backfill the data;
-
Meter list: The content displayed is the same as the parent page. Users can modify the meter readings and make notes.
-
Click "OK" to save the data.
Important: This page requires modifying readings for all meters in the list. To edit only specific meters, return to the parent page, filter out corresponding meters, and then access this page to modify the meter data.
View the Meter Reading Modification Records
Click "
" to go to the Meter Modification Records page:
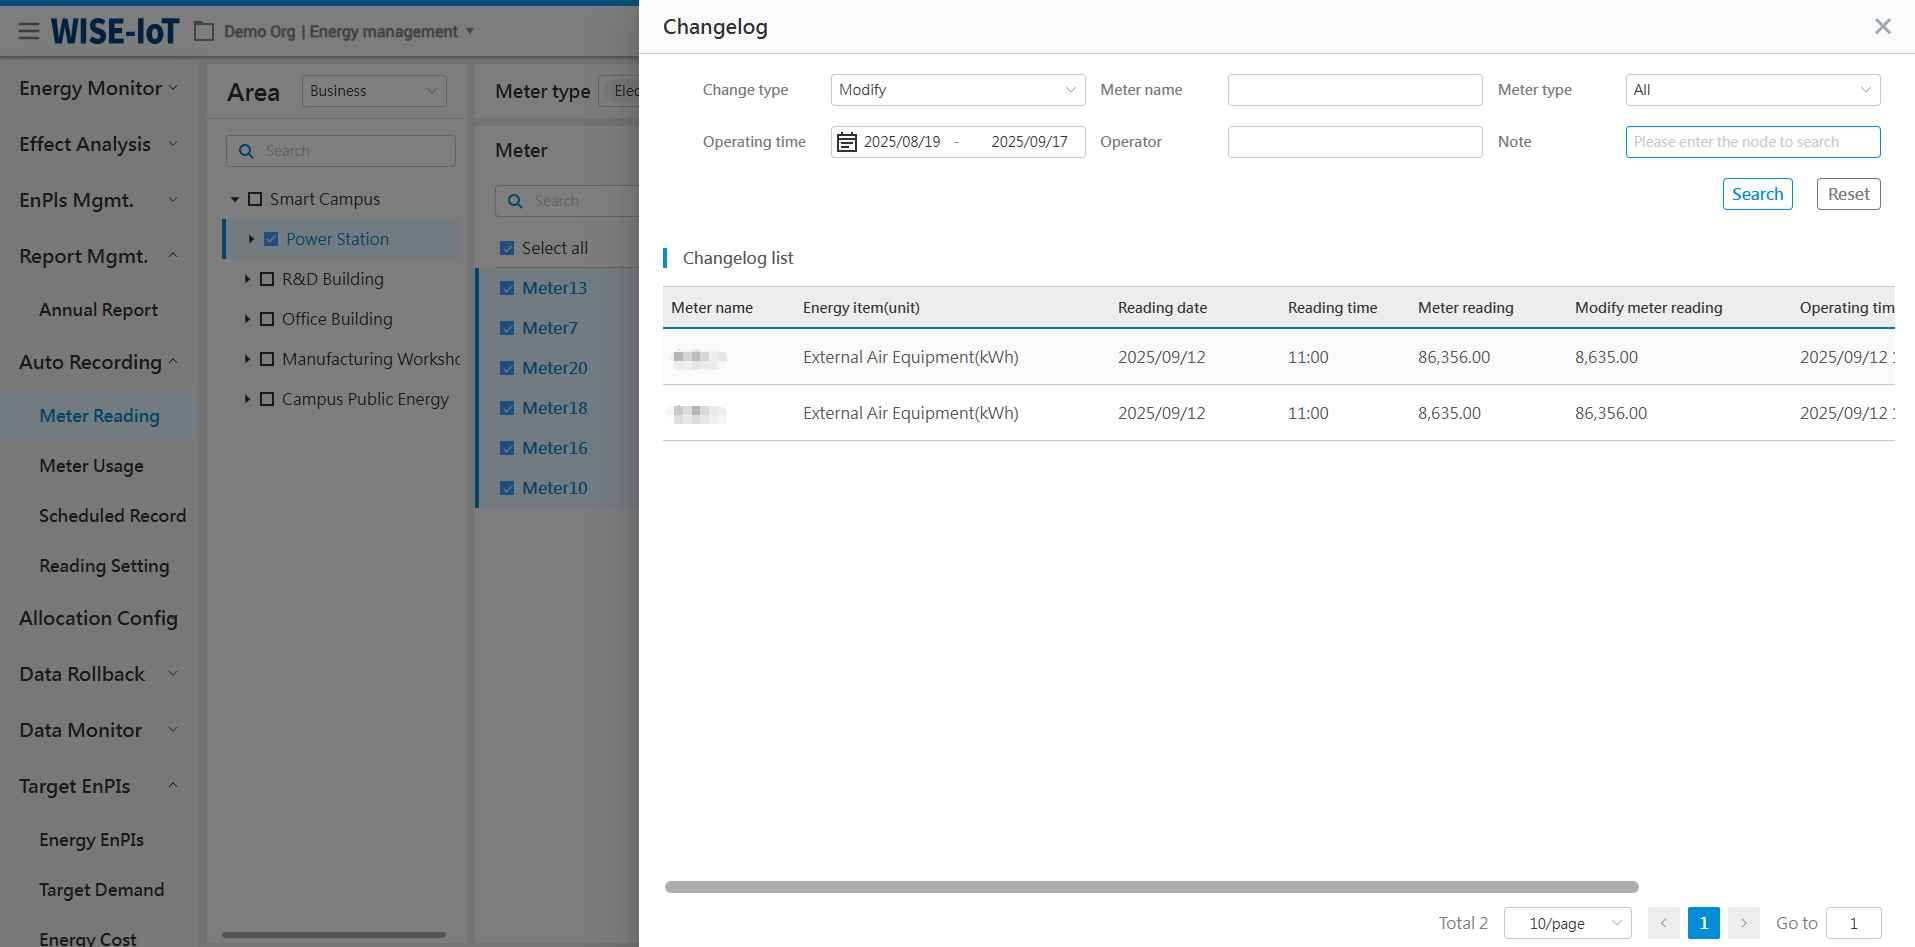
Default display: The system will show modification records for all meters over the last 30 days. These records can be filtered using the above filter criteria.
Settle Meter Data
Click "![]() " to go to the Meter Data Settlement page:
" to go to the Meter Data Settlement page:
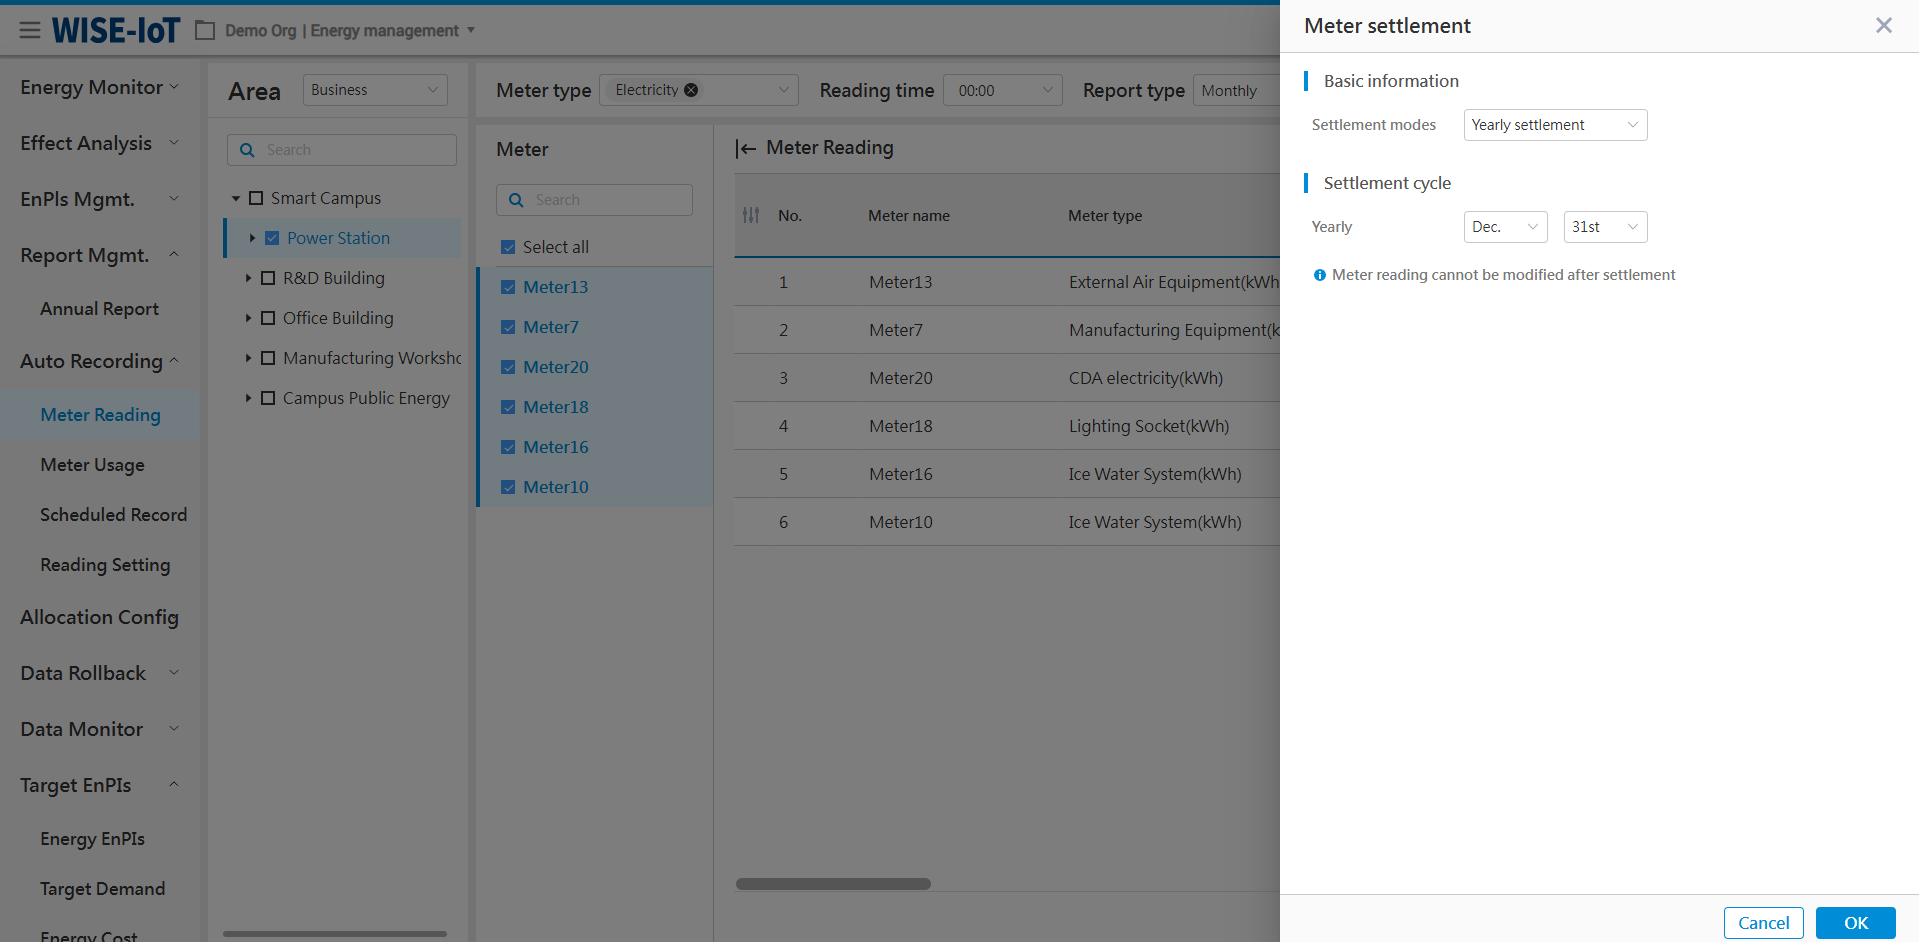
The settlement time configuration is related to the addition and modification of meter readings. After setting the settlement time, meter readings prior to the settlement time cannot be added or modified.
The system defaults the settlement time to the last day of each month, meaning users cannot add or modify data of the previous month. Users can edit the settlement time on this page. Example: If a user sets monthly data settlement on the 15th, they can click Day [ ] of the month, enter 15, confirm with OK, then meter readings before the 15th at 00:00 become uneditable on Add Meter Readings page and Modify Meter readings page.
Ways to Display Import/Add/Modify/Modify Records/ Download Buttons
For early-stage clients, the "Import/Add/Modify" buttons are not displayed. Administrators must enable them via the Desk System Settings page as follows:
- Click "
 " on the top right corner, select "System Settings" to go to the settings page, find Application Management > Energy Management, click Edit to go to the ECOWatch Energy Management Menu Editing page:
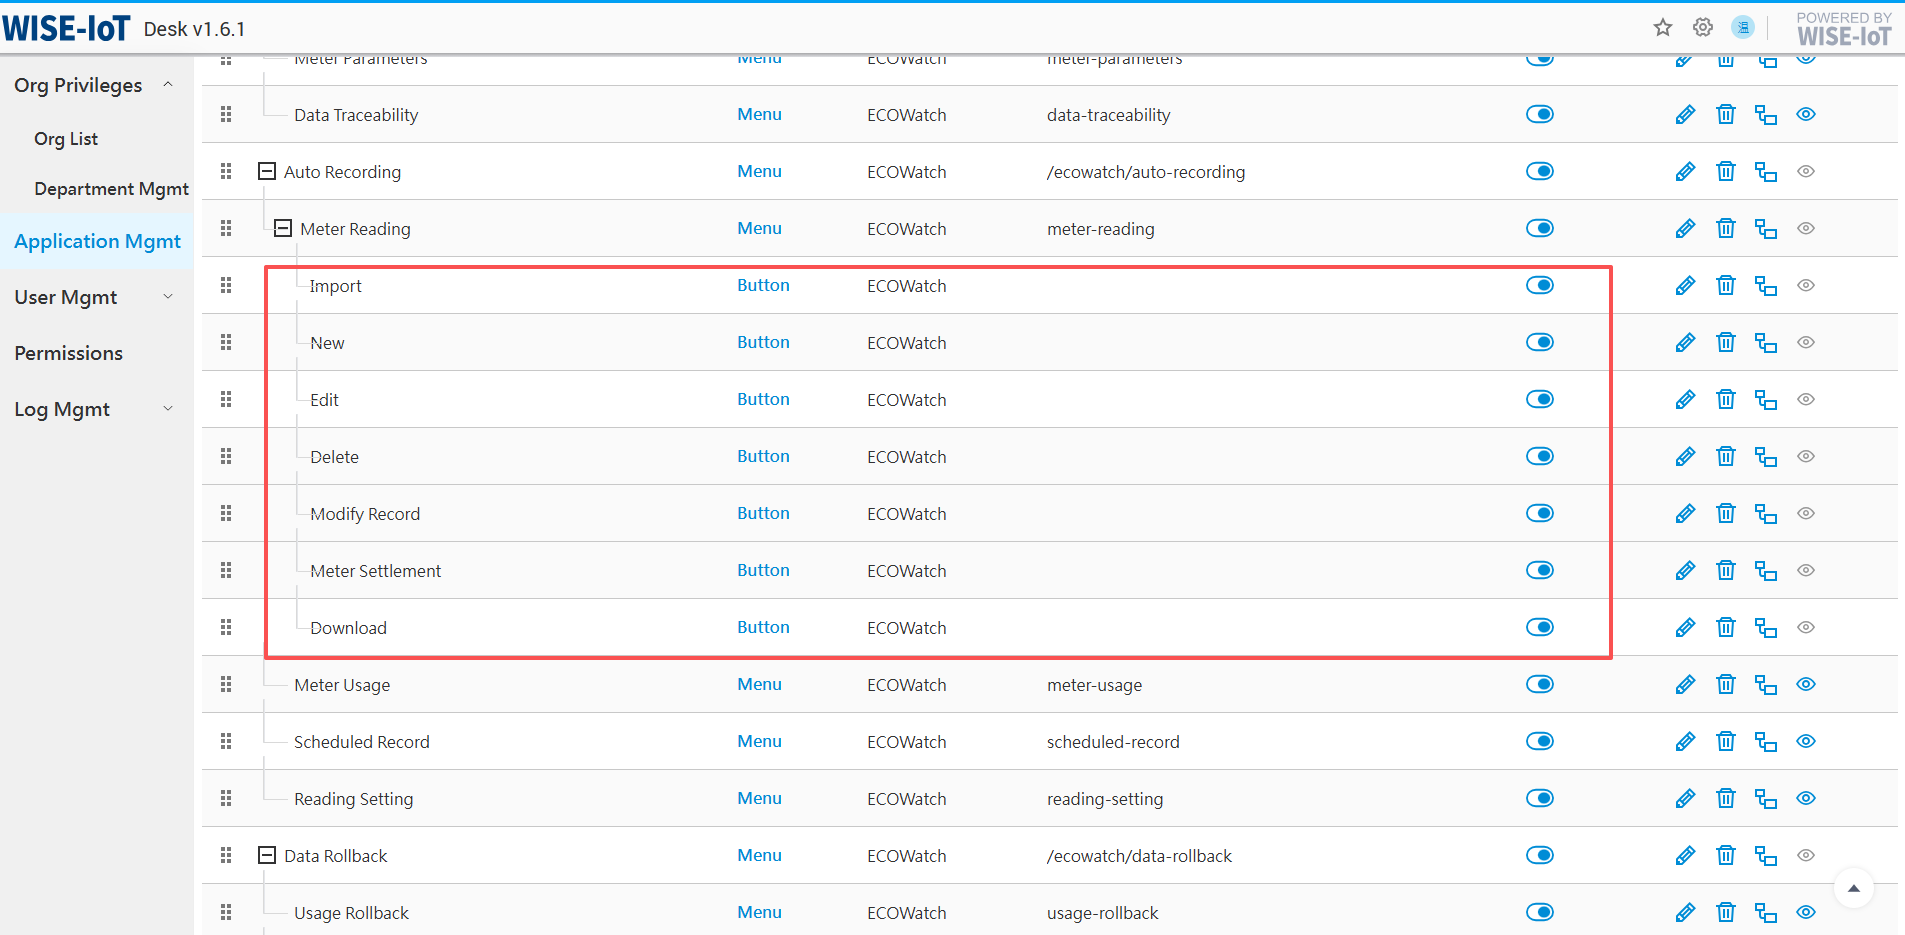
- In the "Energy Management" menu, find Meter Reading under Automatic Meter Reading and click
 on the right to add a sub-menu:
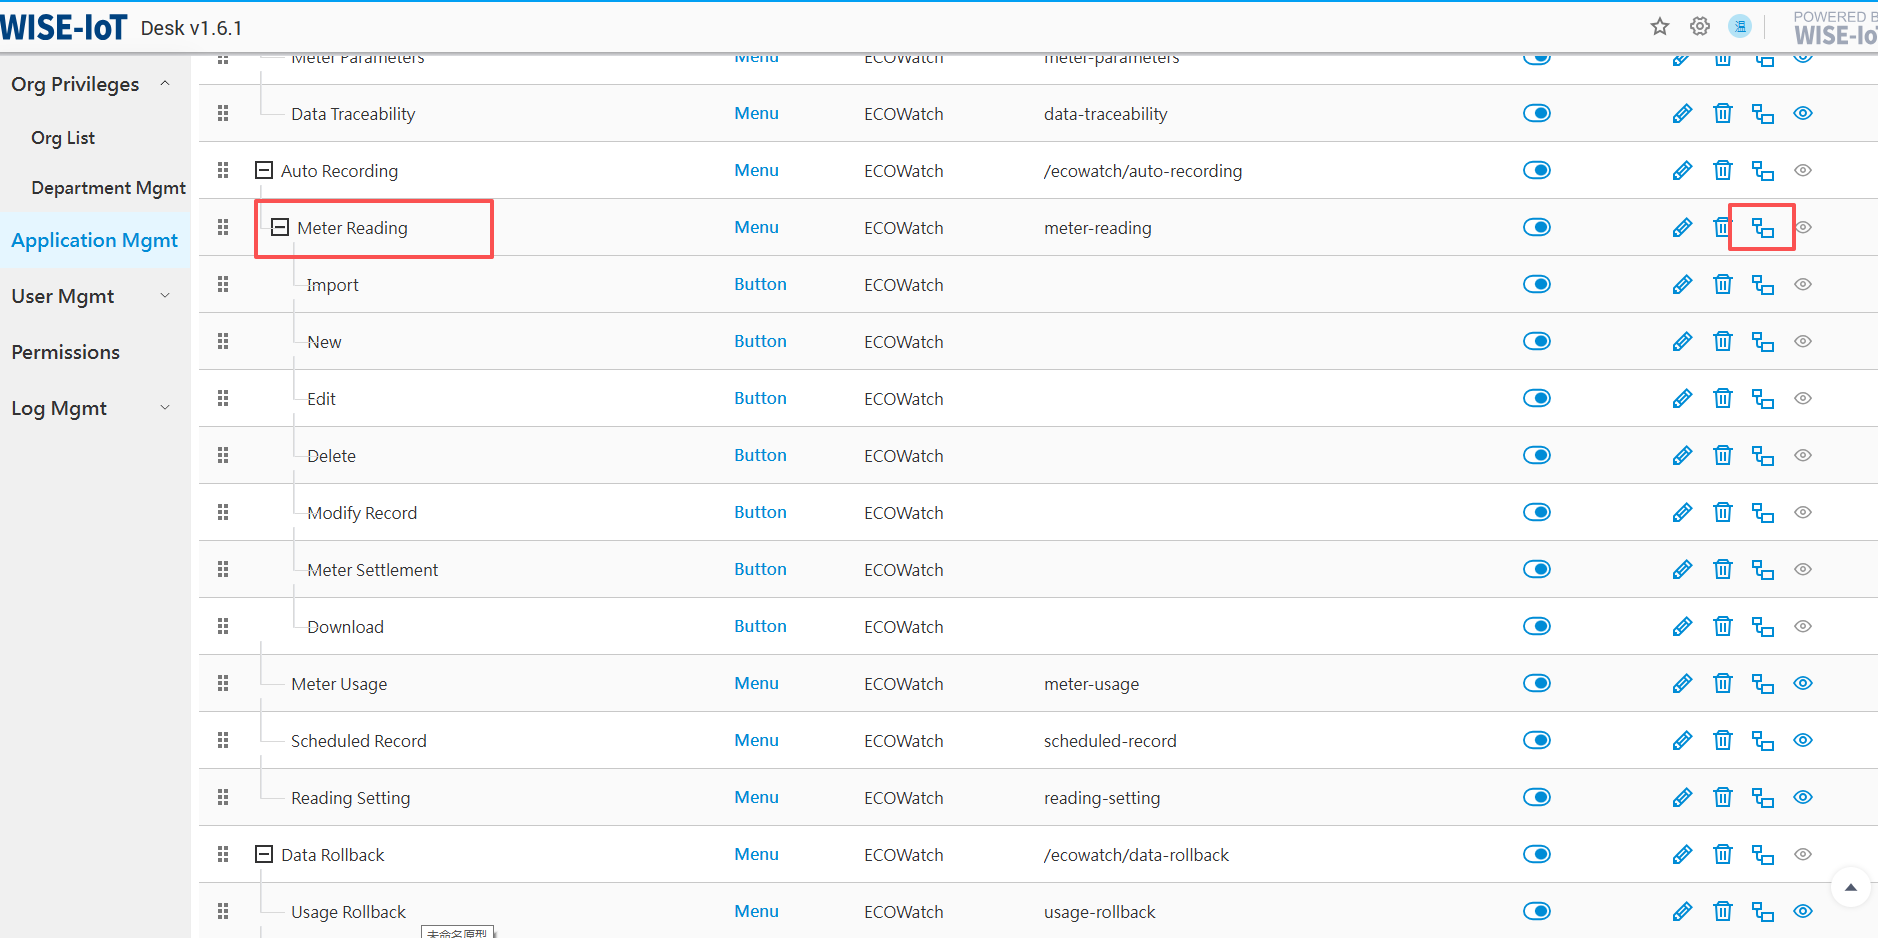
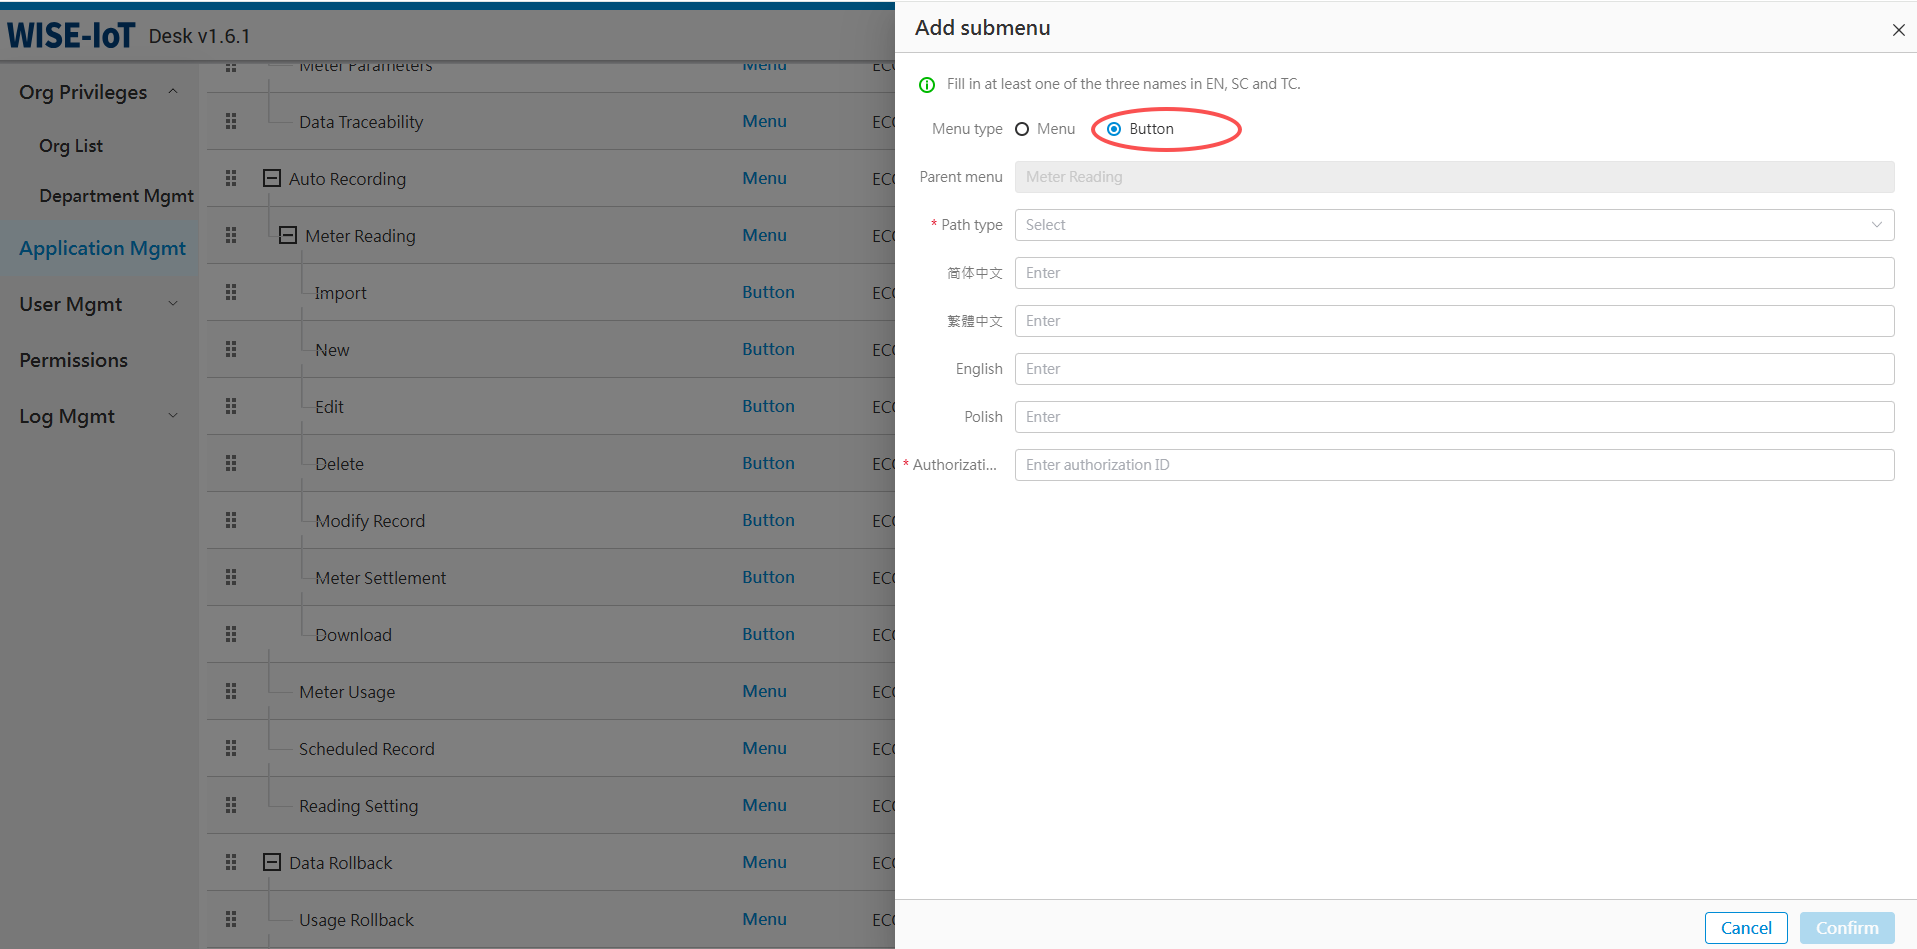
- Enter the following information in the menu. Here take "Batch Import" as an example. Add "Batch Import/Add/Modify/Modify Records/ Download" buttons one by one, and then you can view and use them in ECOWatch meter reading.
After the administrator adds the above buttons, please assign permissions to users who require access to these buttons. This ensures that when they re-enter org, they can view and use the button on the Automatic Meter Reading > Meter Reading page.
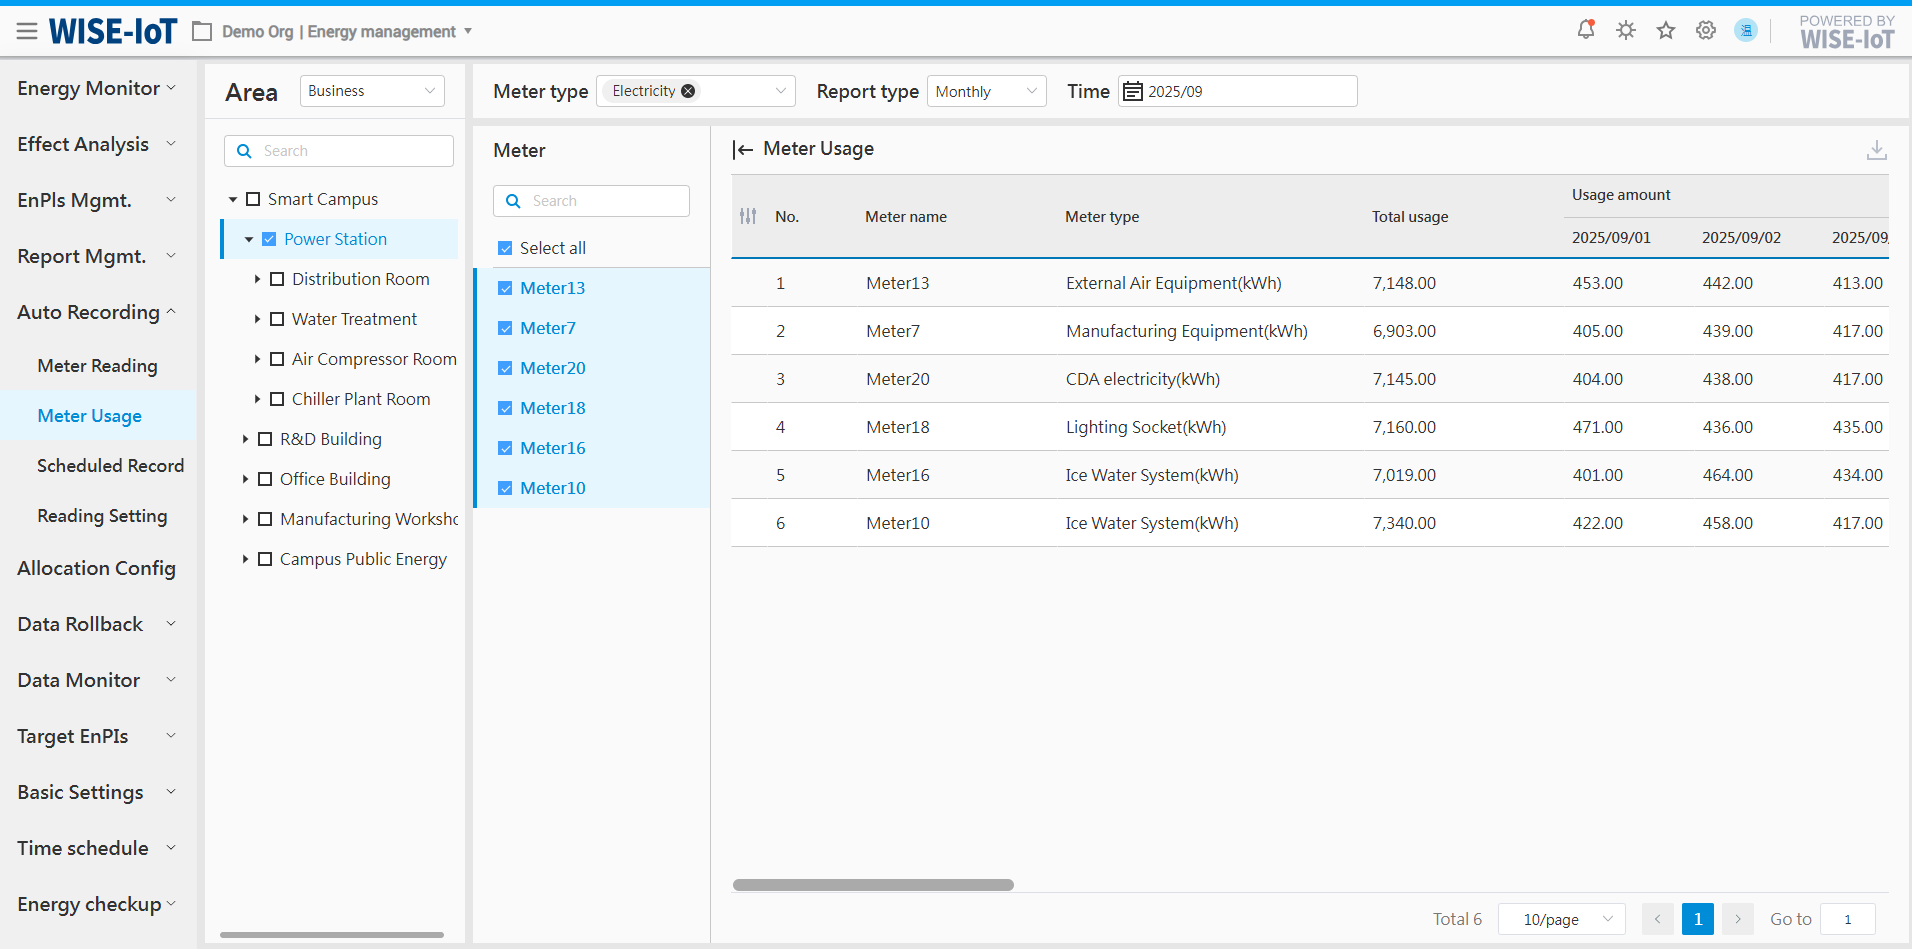
Meter Usage
Click Automatic Meter Reading > Meter Usage to go to the Meter Usage module.
The module shows hourly, daily, and monthly usage data for each meter, and generates annual reports, monthly reports, daily reports, and custom time-range reports.
- Filter area
(1) Meter type: Support selection of meters for different energy types, such as electricity meters, water meters, gas meters, etc.;
(2) Report type: Support annual reports, monthly reports, daily reports, or meter readings for custom time periods;
Note: For usage statistics, all statistical periods in the system start at 00:00.
- Area/meter selection area
There are two ways to select an area:
(1) Business topology: Click "Select by Business Structure" in the top-right corner of the area to display the business asset groups configured by the user. The system filters associated meter information based on the business topology.
(2) Meter topology: Click "Select by Meter Structure" in the top-right corner of the area to display the meter asset groups configured by the user. The system filters associated meter information based on the meter topology.
Note: To display areas based on meter topology, the meter asset group type must be set to "meter" and the project must be "ECOWatch" in the APM system.
(3) Meter reading area: Click "Select by Meter Reading Area" in the top-right corner of the area to display the meter groups configured by the user in the [Meter Reading Settings] module. The system filters associated meter information based on the meter reading area.
After selecting an area, the right panel displays the raw data of all meter dashboard in that area. It supports selecting individual meters for readings or selecting all.
- Table section
(1) Display the hourly, daily, and monthly cumulative usage of each meter. Click ![]() on the right to export the filtered data to Excel;
on the right to export the filtered data to Excel;
(2) Daily report: Display cumulative usage from 00:00 to 23:00 of the selected day. Specifically, 00:00 cumulative usage corresponds to cumulative usage during 00:00:00 ~ 00:59:59, 01:00 cumulative usage corresponds to cumulative usage during 01:00:00 ~ 01:59:59,... continuing in this pattern for subsequent hours
(3) Monthly report: Display daily cumulative usage from the 1st to the 31st (or 30th) of the selected month;
(4) Annual report: Display monthly cumulative usage from January to December of the selected year.
Scheduled Meter Reading
The Scheduled Meter Reading module streamlines operations for facility personnel by enabling customizable reading rules. ECOWatch automatically generates meter readings based on these configurations and pushes the information to designated recipients' email addresses.
Scheduled Meter Reading List
Click Automatic Meter Reading > Scheduled Meter Reading.
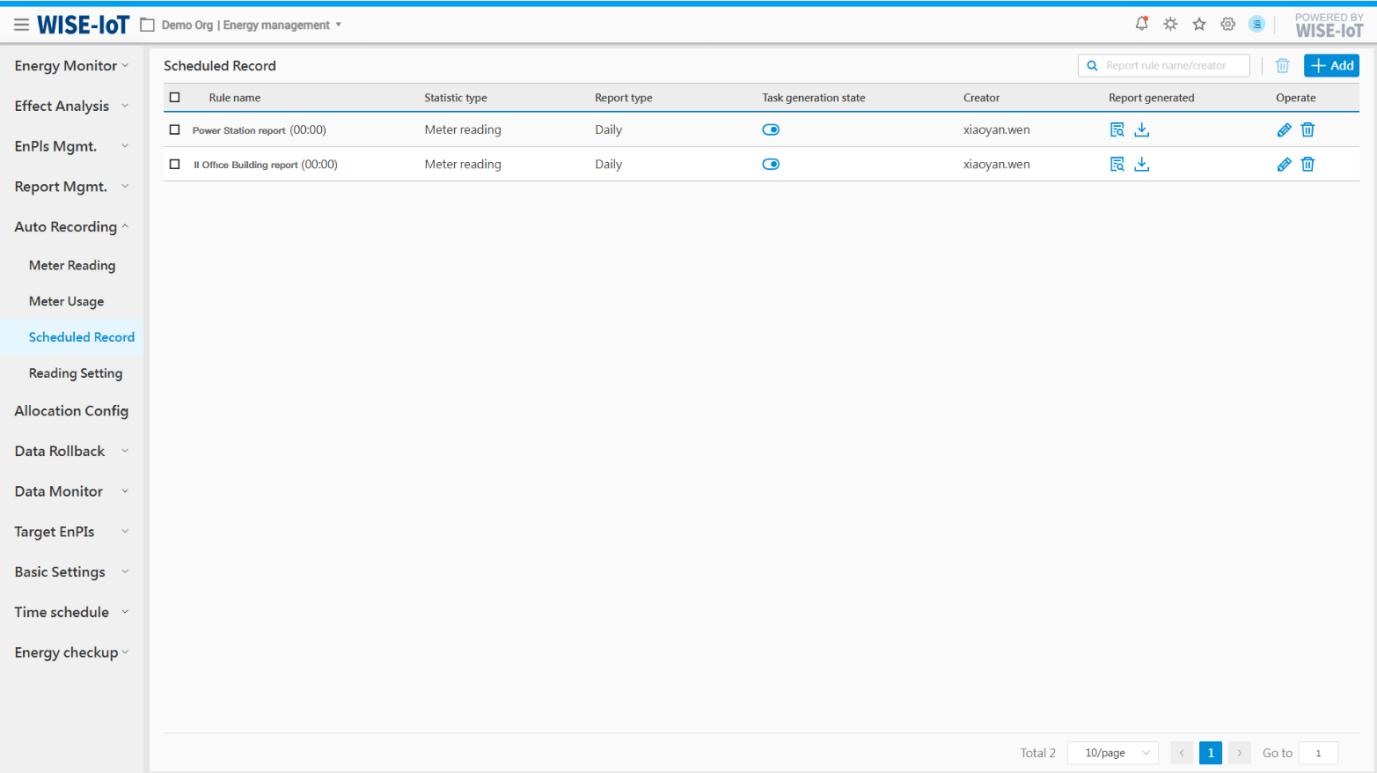
-
Click [New] to enter the Meter Reading Rule Setting page.
-
Task generation status: Control whether the report rules are executed. If disabled, the system will not generate meter reading tasks.
-
Created by: Display report rules created by different users.
-
Preview meter reading file: Click "
 " to view all report files in the Meter Reading File interface.
 -
Click [
 ] to download system-generated report files as a zip package.
 -
Click [
 ] to modify report rules. Note: Public rules shared by others cannot be edited.
 -
Click [
] to remove report rules and generated meter reading files after confirmation. Note: Public rules shared by others cannot be deleted. -
Click [
 ] to remove selected report rules, excluding those without deletion permissions.
Add Report Rules
Click [Add] to enter the Rule Setting page. Details are as follows:
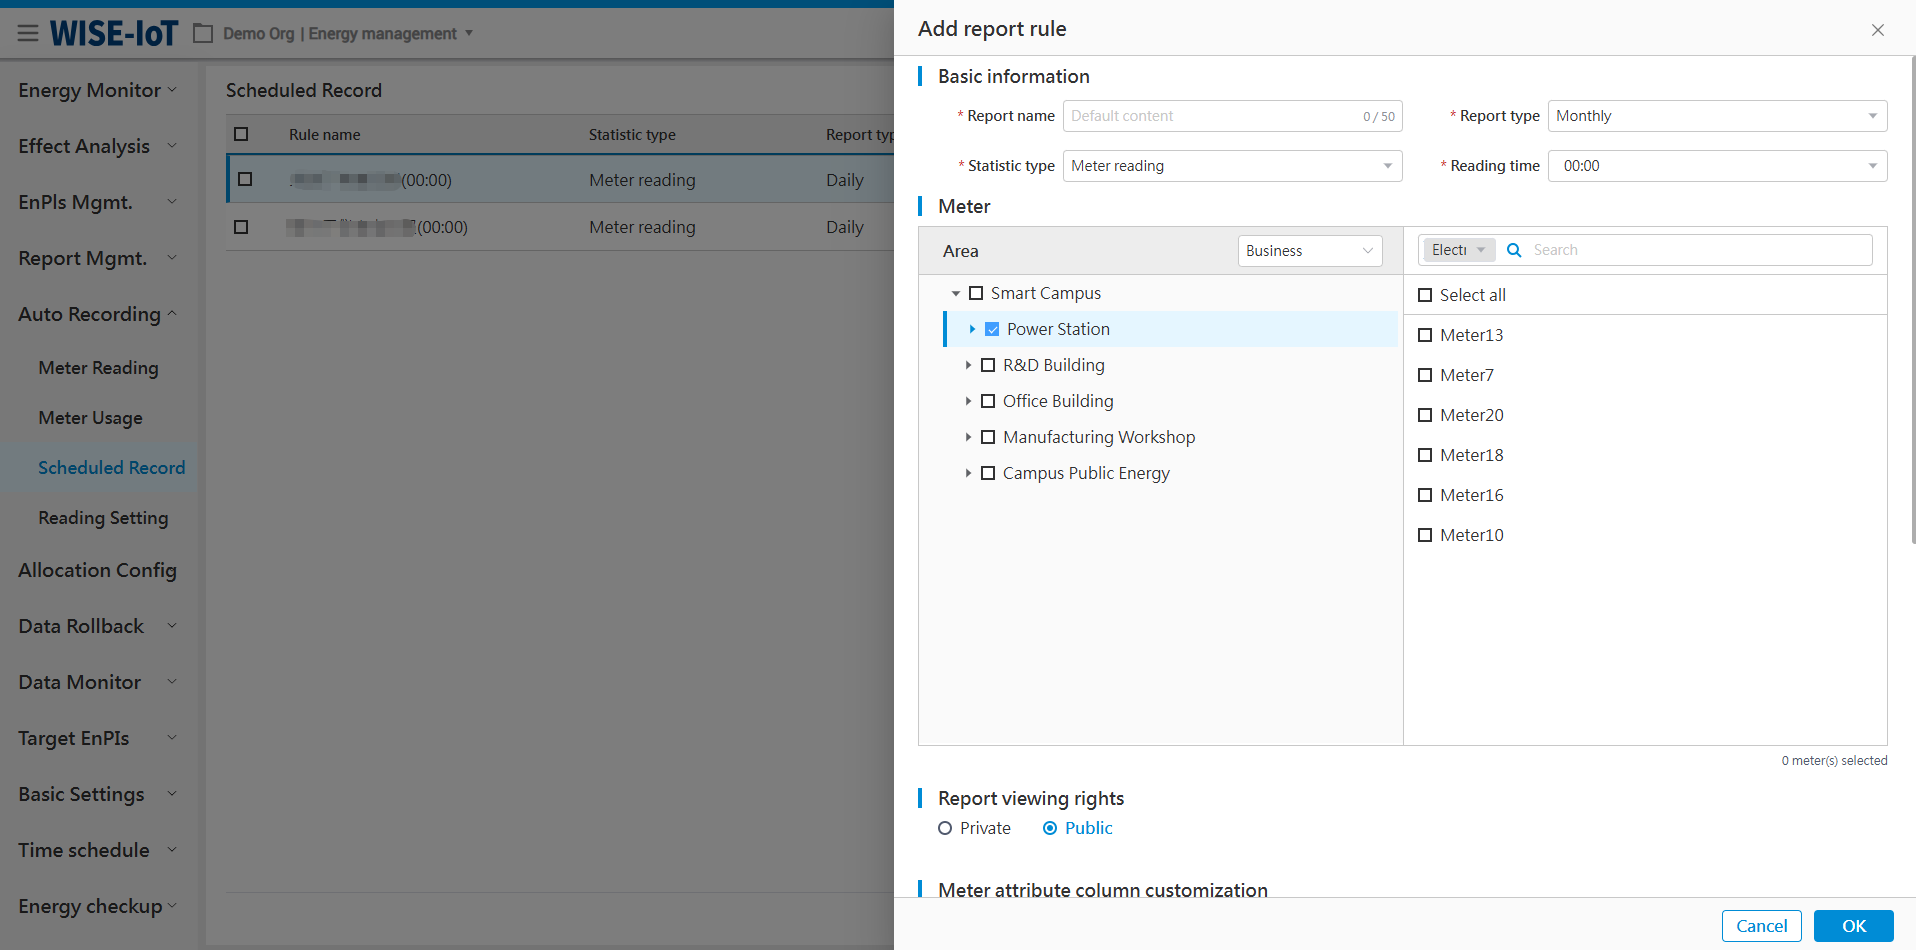
-
The interface provides two meter reading methods: meter reading and meter usage. Users can set a specific time for meter reading.
-
Meter selection: In the dropdown menu in the area section, users can select by Business Structure, Meter Structure, and Meter Reading Area. The right side displays meters filtered based on the left-hand area selection, and provides a fuzzy search function for meters.
※ To display by meter topology, the asset group type must be set to "meter" and the project to ECOWatch in the APM system.
-
Report view permissions: When set to private, the report rule is accessible solely to its creator. When set to public, all authorized users can view the report rules and download report files associated with the report rules.
-
Customizable meter attribute columns: The fields selected by the user will be automatically populated into the corresponding columns of the attached Excel file.
-
Meter reading notification group: Configure group members to receive notifications. As meter reading files are Excel attachments, they must be sent to designated personnel via email.
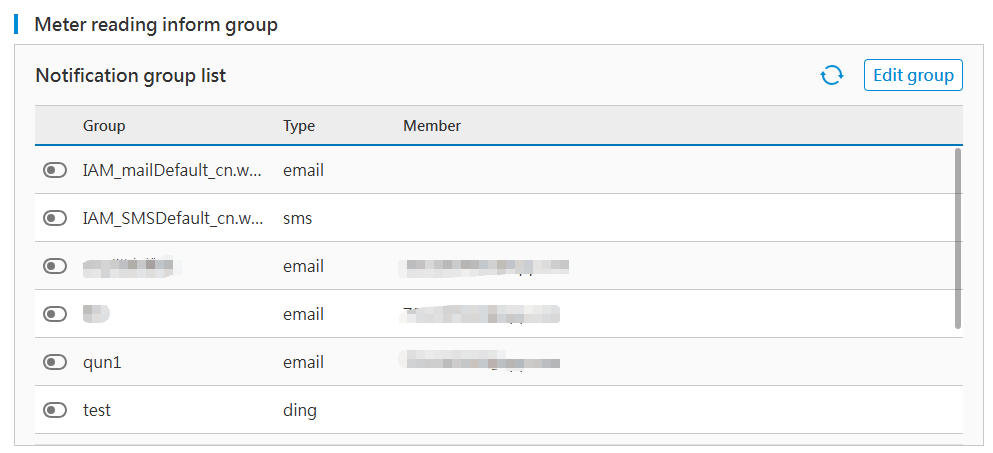
(1) The interface displays a list of notification groups pre-configured in messagepush, disabled by default. To activate notifications for any group, simply toggle its switch on.
(2) If users need to add/change recipients in the group or have other requirements, please click "Edit Group" to enter the messagepush page for editing.
The message notification feature requires prior activation of the MessagePush service. Once activated, group configurations can be defined. Refer to the MessagePush Configuration Manual for group configurations.
(3) Report language: Selectable according to actual needs. Support simplified Chinese, Traditional Chinese, English, etc. Upon selection, the system will generate meter reading reports in the chosen language based on predefined rules and schedules.
View Meter Reading Files
Click [![]() ] to view reports, and users can view and download report files, see below for details:
] to view reports, and users can view and download report files, see below for details:
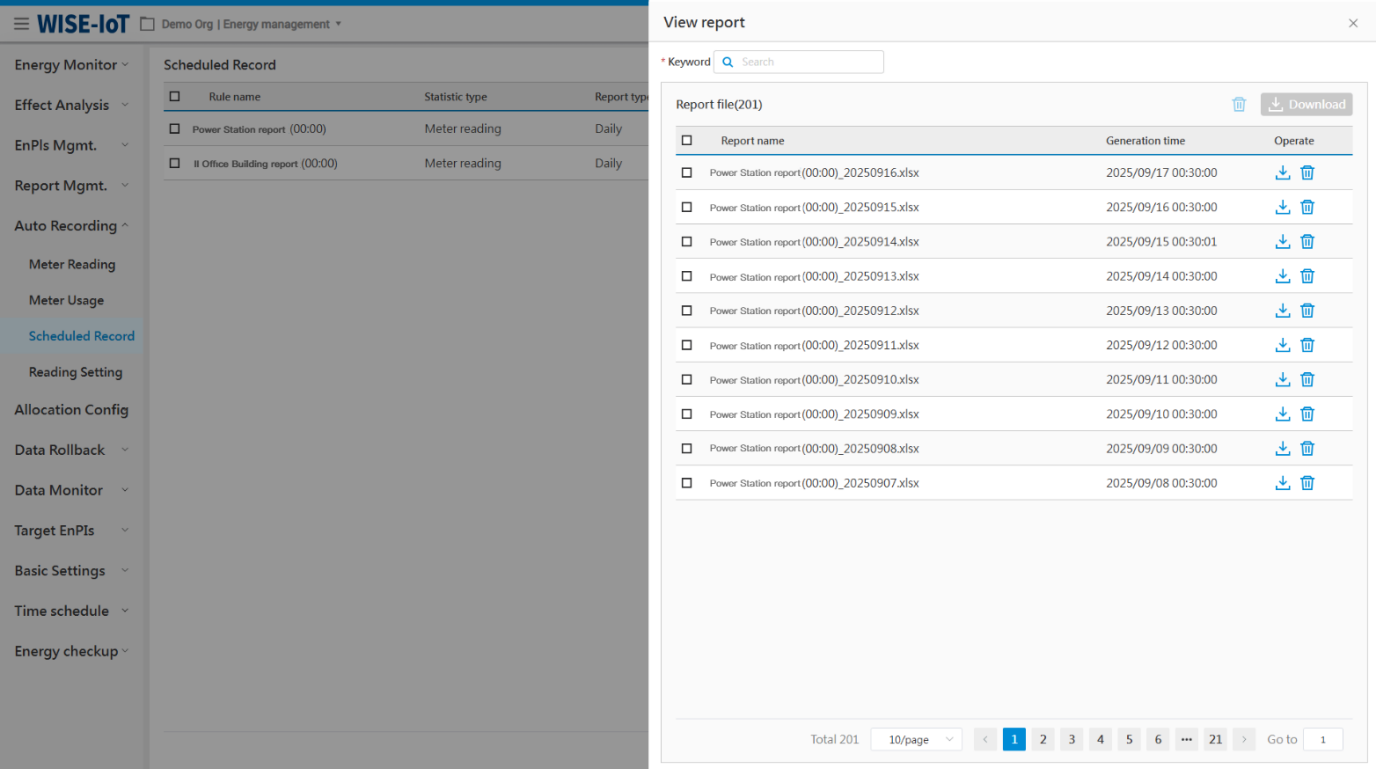
-
Support keyword search by file name.
-
To delete a single report, select it and click
 on the right. To batch delete reports, select reports and click at the top-right to remove all reports on the current page.
 -
Select a report and click
 on the right to download.
Reading Setting
Once a meter reading area is configured, it will be reflected in the automatic meter reading function. When performing energy meter reading on the interface, you can select "Monitor Area" to filter and display data.
When configuring meter reading areas, users can obtain relevant meter information by selecting an area node within the business topology structure or selecting a node within the meter structure.
After selecting an area node, click [Add], and the meters displayed on the Add Meter Reading Area page will be all meters under the jurisdiction of this area.
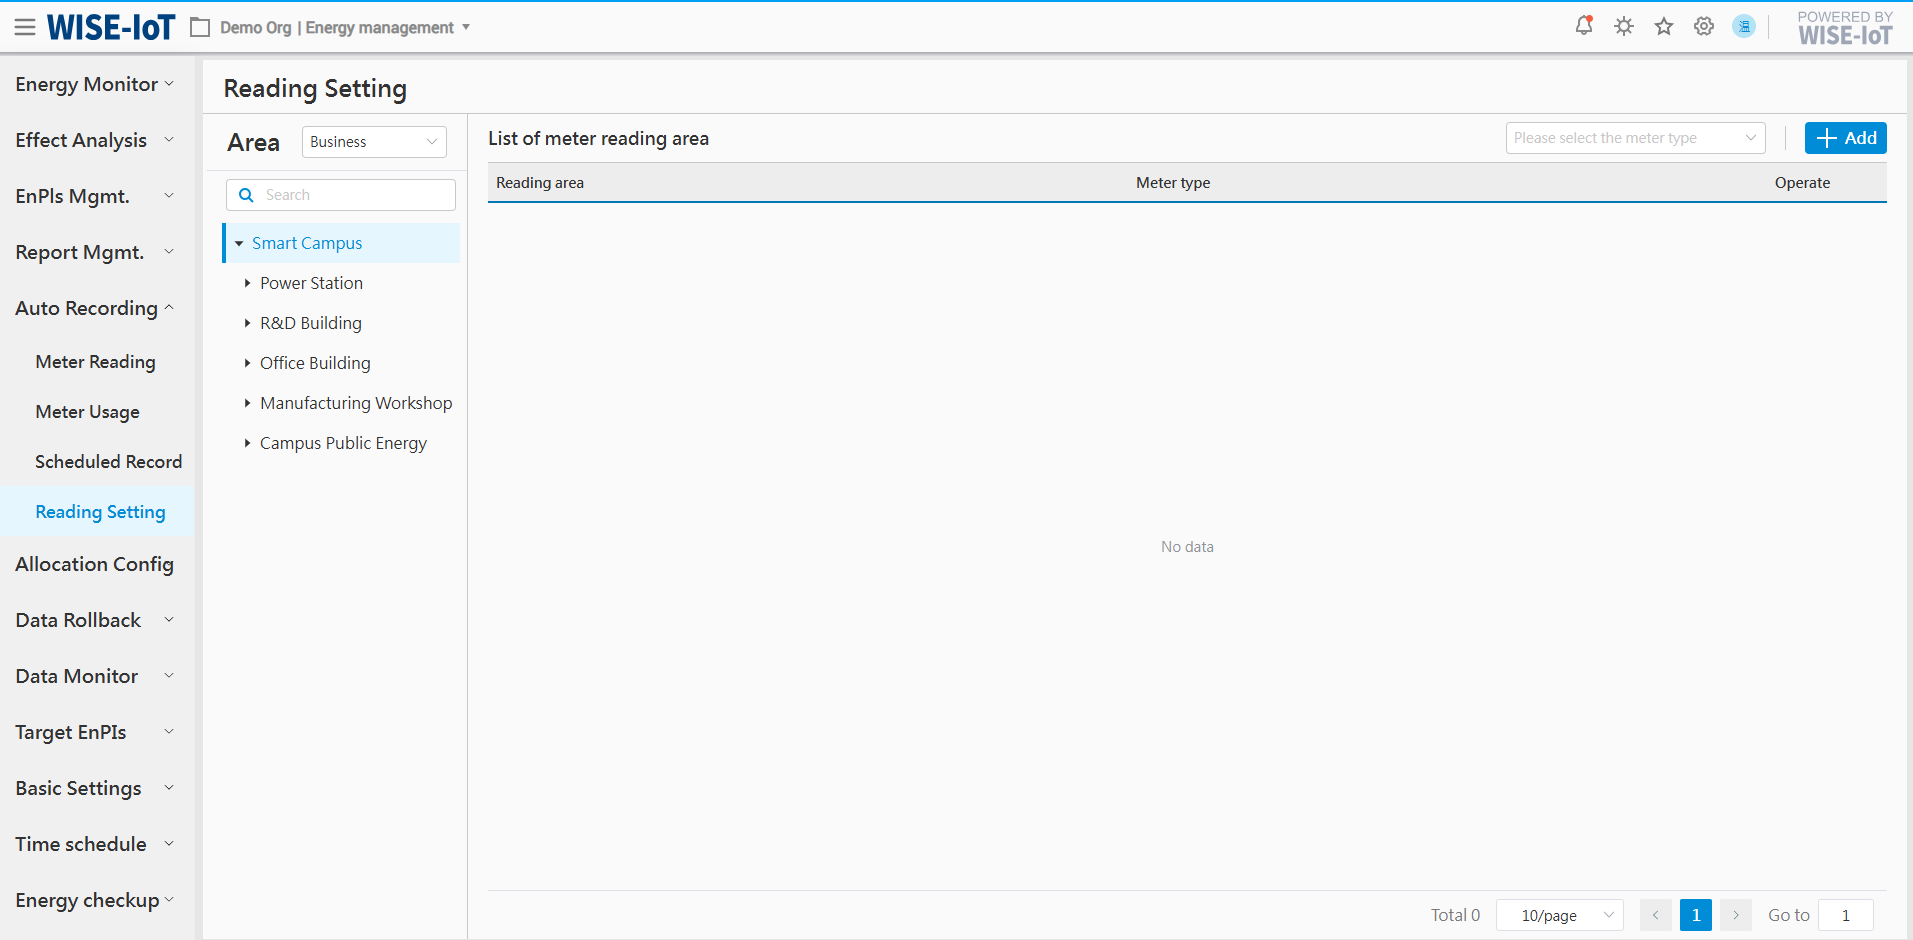
Select [Meter Type], enter [Reading Name], and ensure that the [Meter Reading Name] is unique within the same plant.
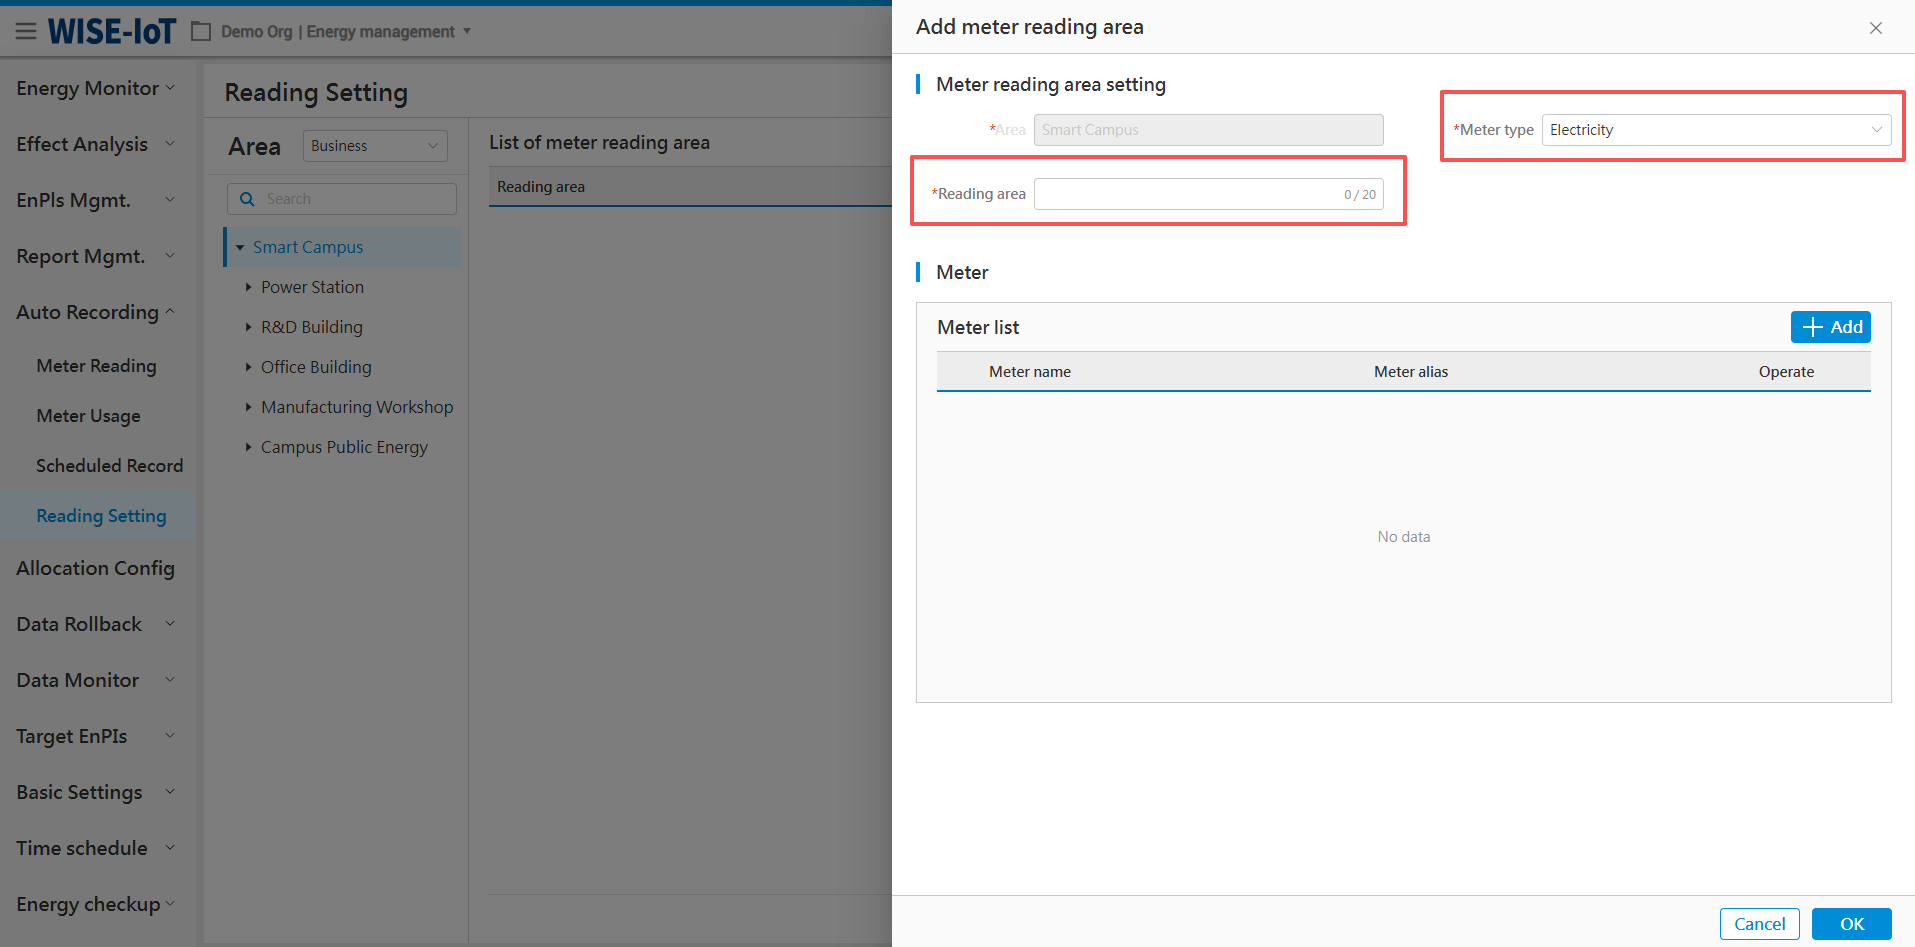
Continue to click[Add].
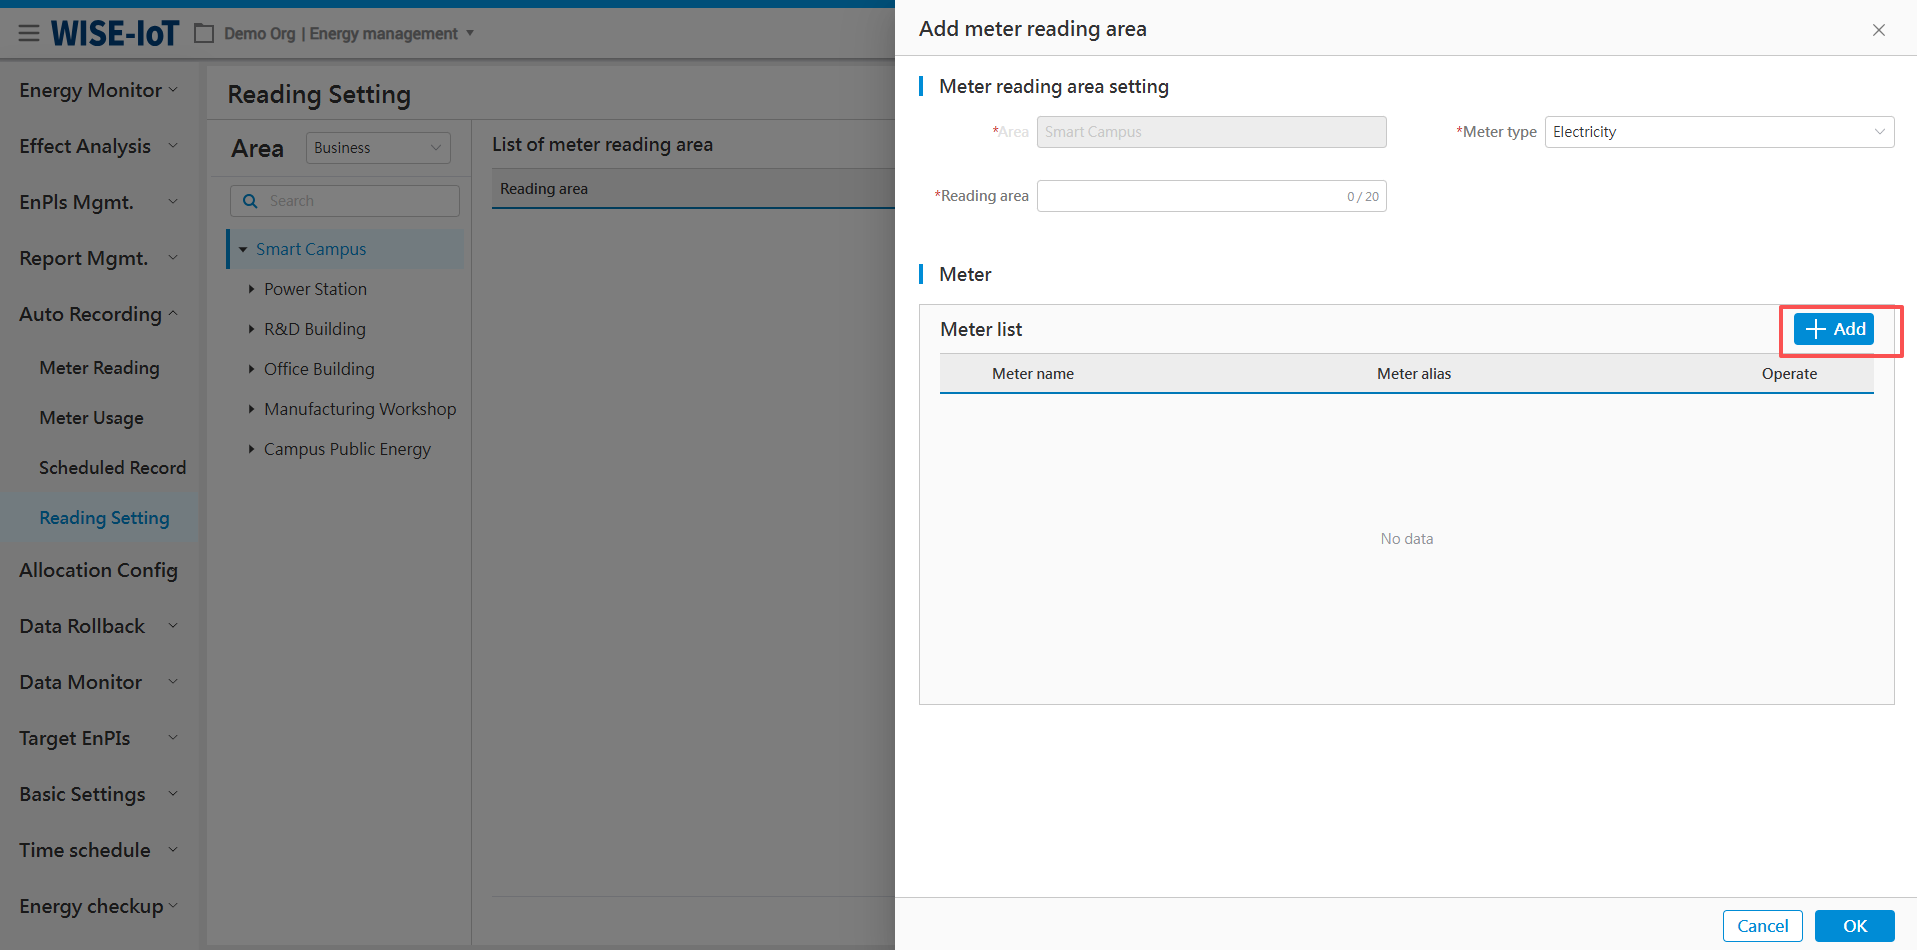
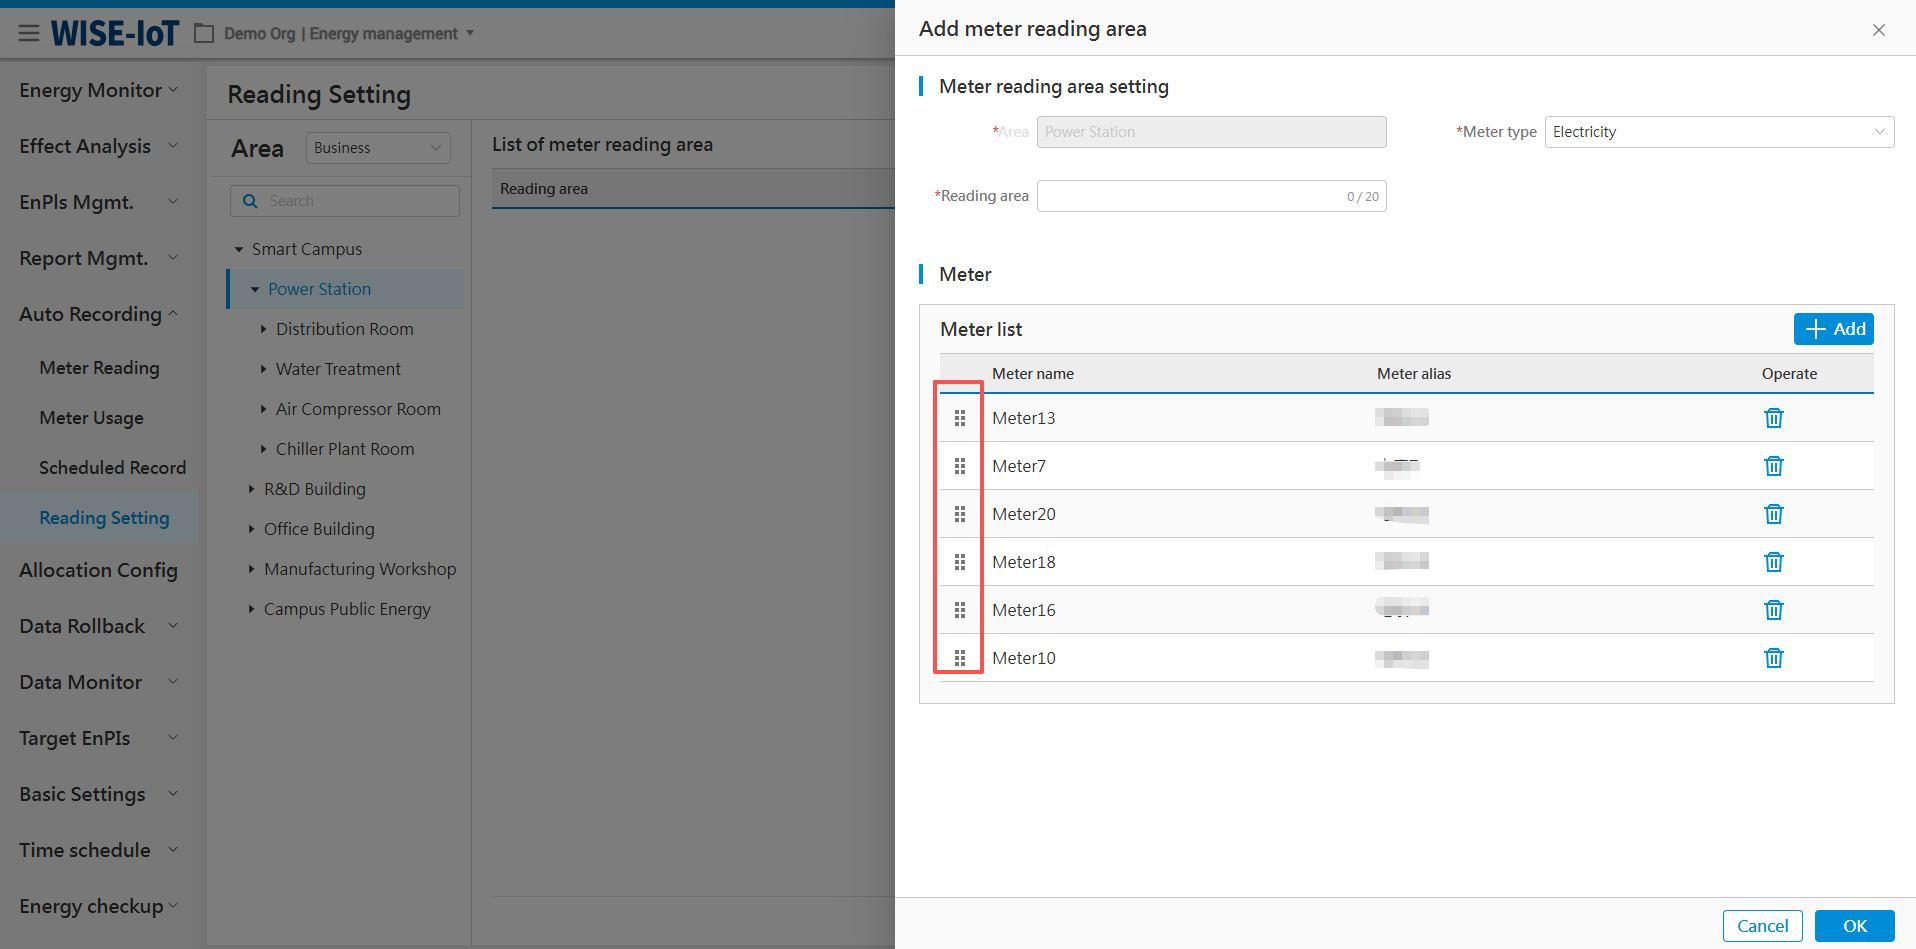
All meters displayed in this pop-up window are associated with the meter type selected on the parent page (e.g., electricity). Select the meter and click [Ok] to proceed.

Meters selected in the popup window will be displayed on the page. Click and drag ![]() to reorder the meters. Once the meter sequence is set, click [OK] to complete the meter reading area configuration.
to reorder the meters. Once the meter sequence is set, click [OK] to complete the meter reading area configuration.
Allocation Management
Allocation Report
Click Allocation Management > Allocation Report to go to its management module.
A. Select Area, Energy Type, and Time Period to generate an allocation report.
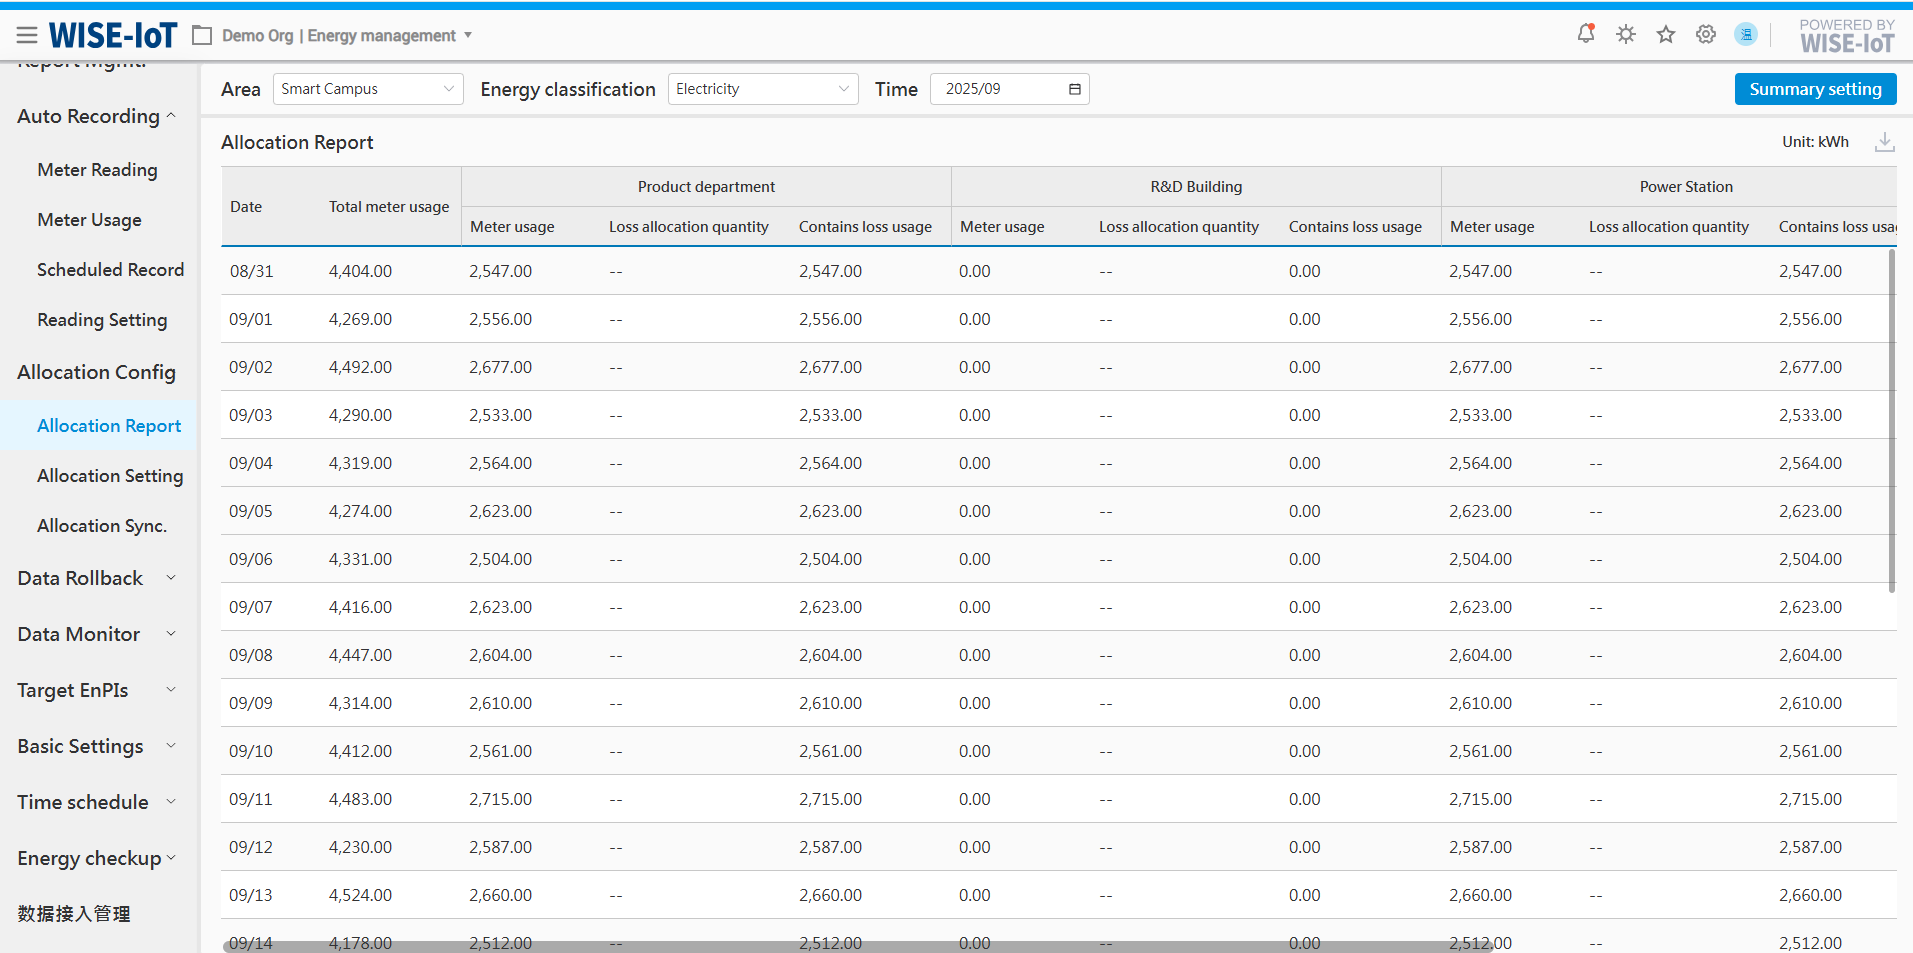
Note: The default time period for the report is from the last day of the previous month to the second-to-last day of the current month.
B. Click ![]() in the upper right corner of the list to download the allocation report.
in the upper right corner of the list to download the allocation report.
Allocation Result Summary Settings
Click ![]() in the top-right corner of the page to access the screen below:
in the top-right corner of the page to access the screen below:
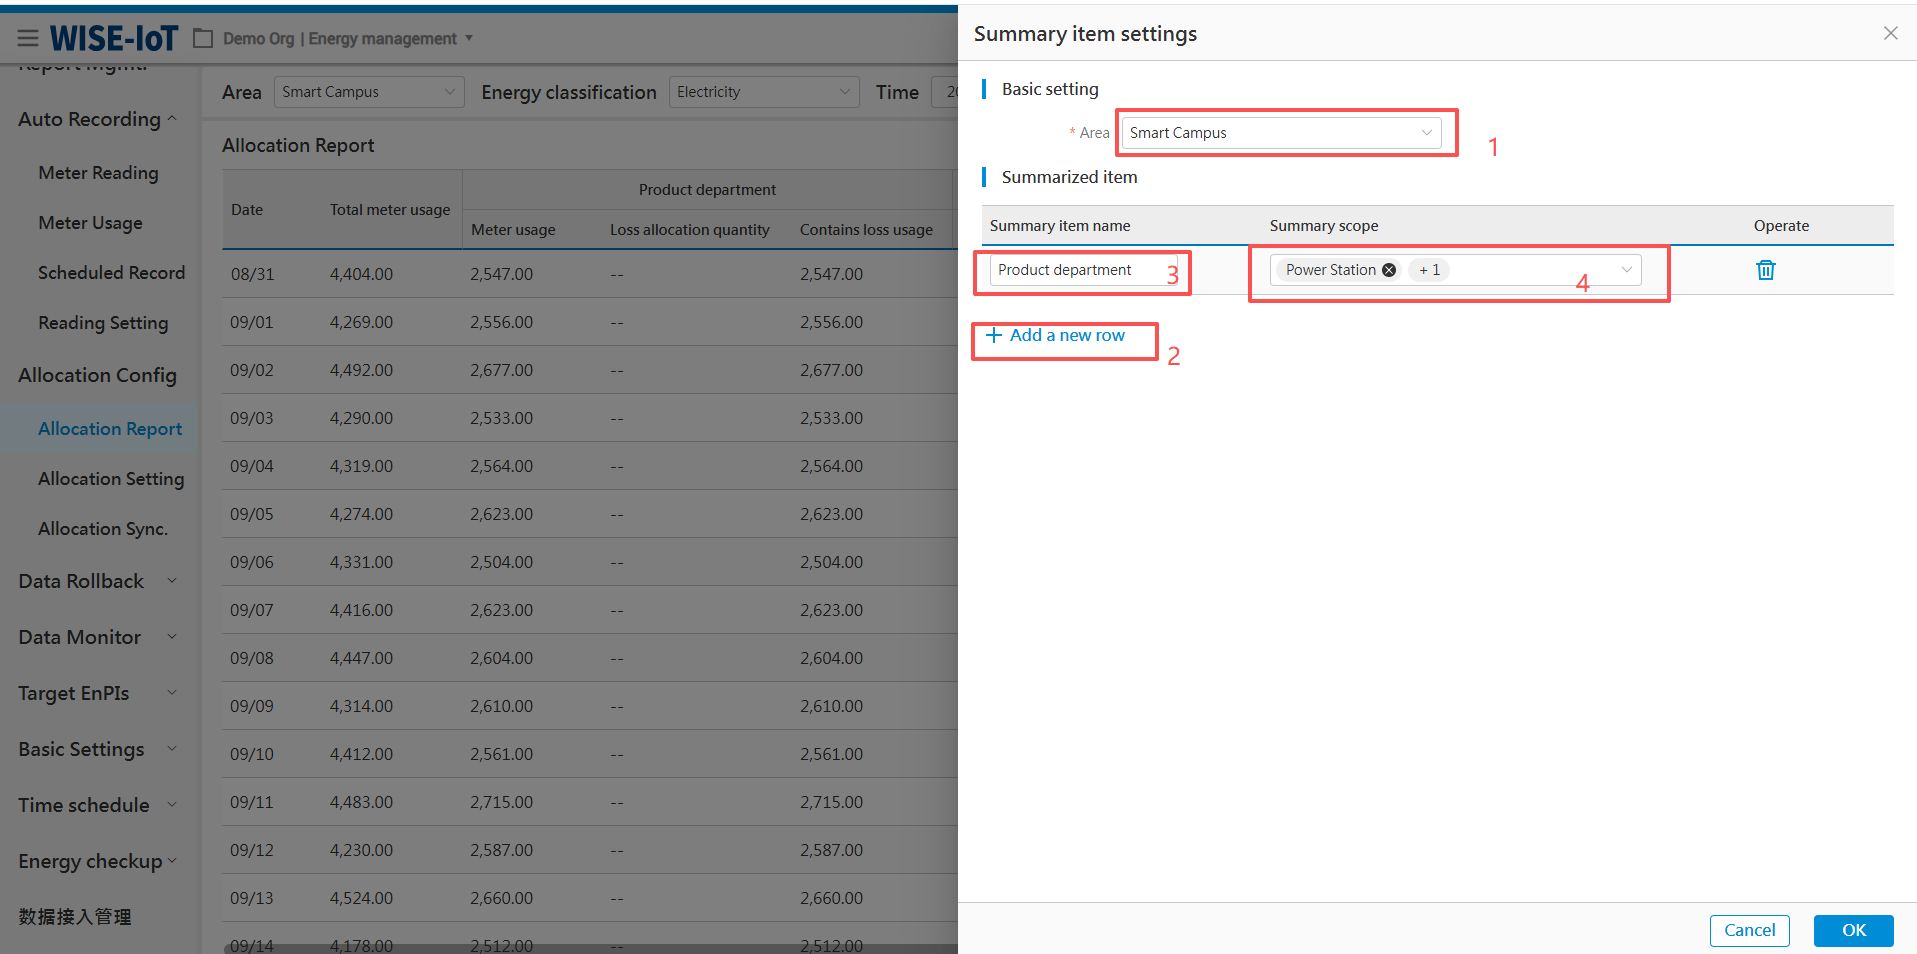
Follow the steps in the figure above, click [OK], and the report will display the newly added summary items.
Allocation Setting
Click Allocation Management > Allocation Setting to access the Allocation Formula Setup page. The Allocation Setting falls into two parts:
A. Metered usage allocation
Metered usage allocation involves distributing the usage measured by meters according to predefined allocation rules.
B. Loss allocation
Loss allocation involves distributing the loss between master and sub-meters according to specified ratios.
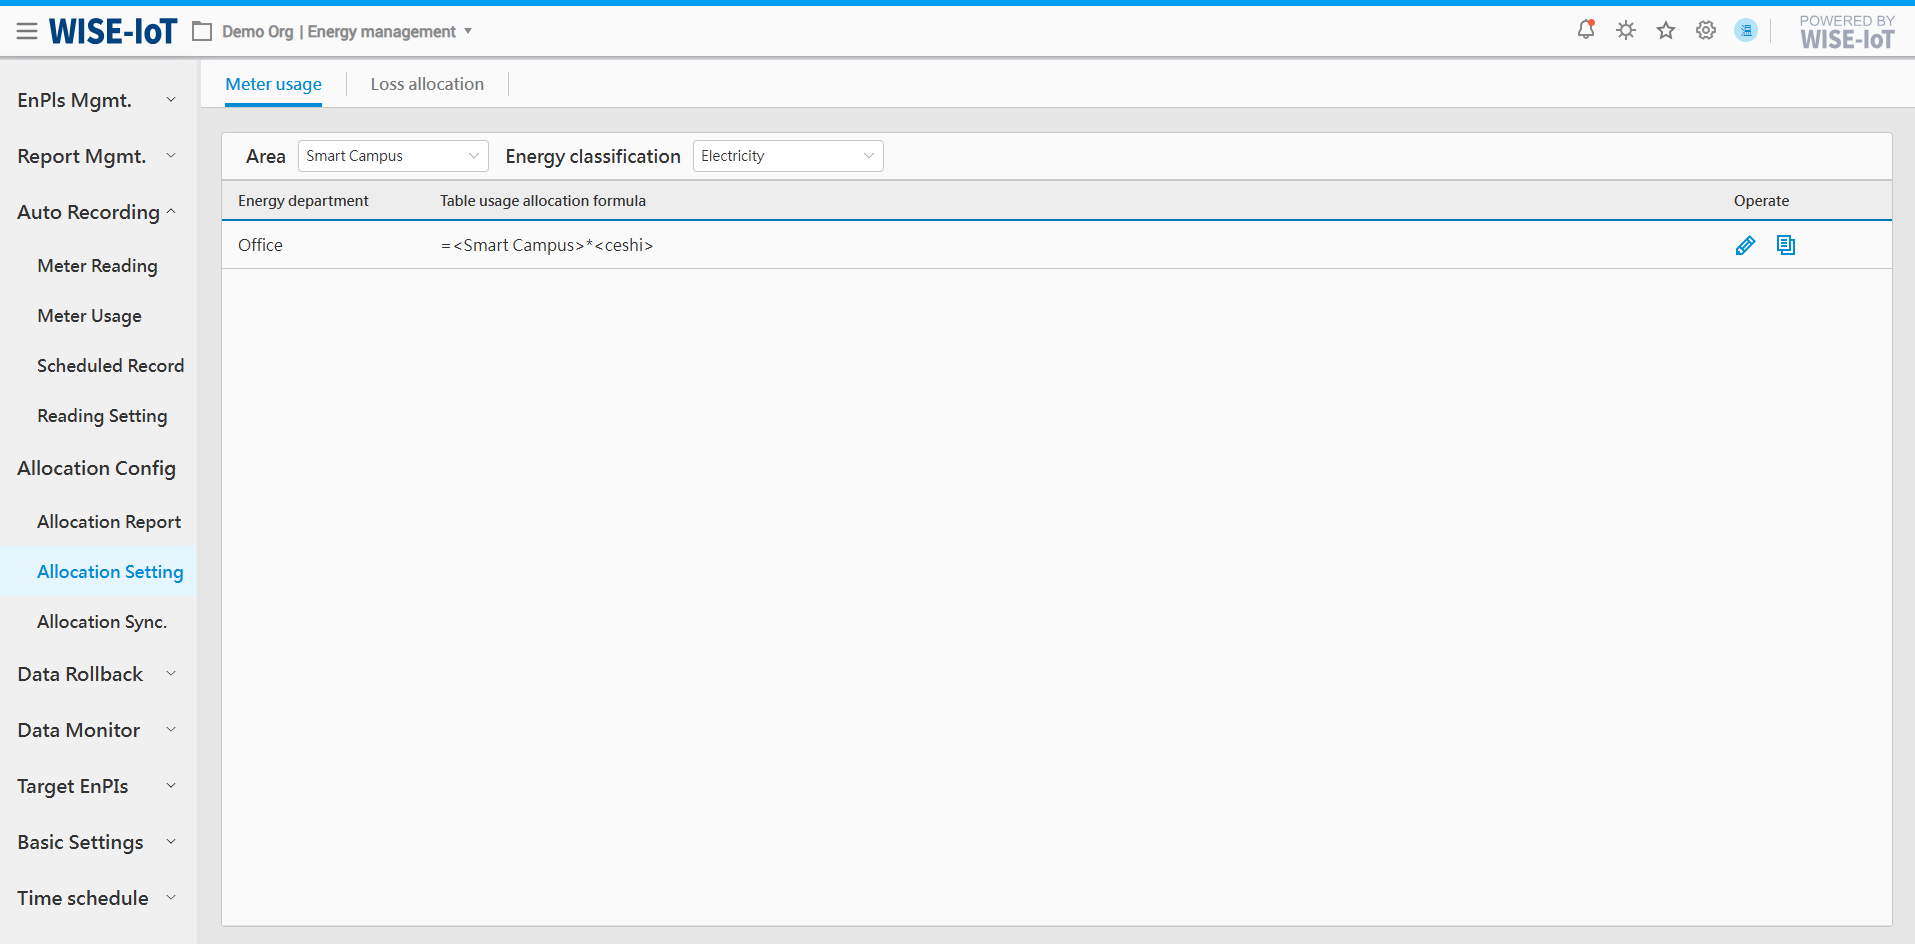
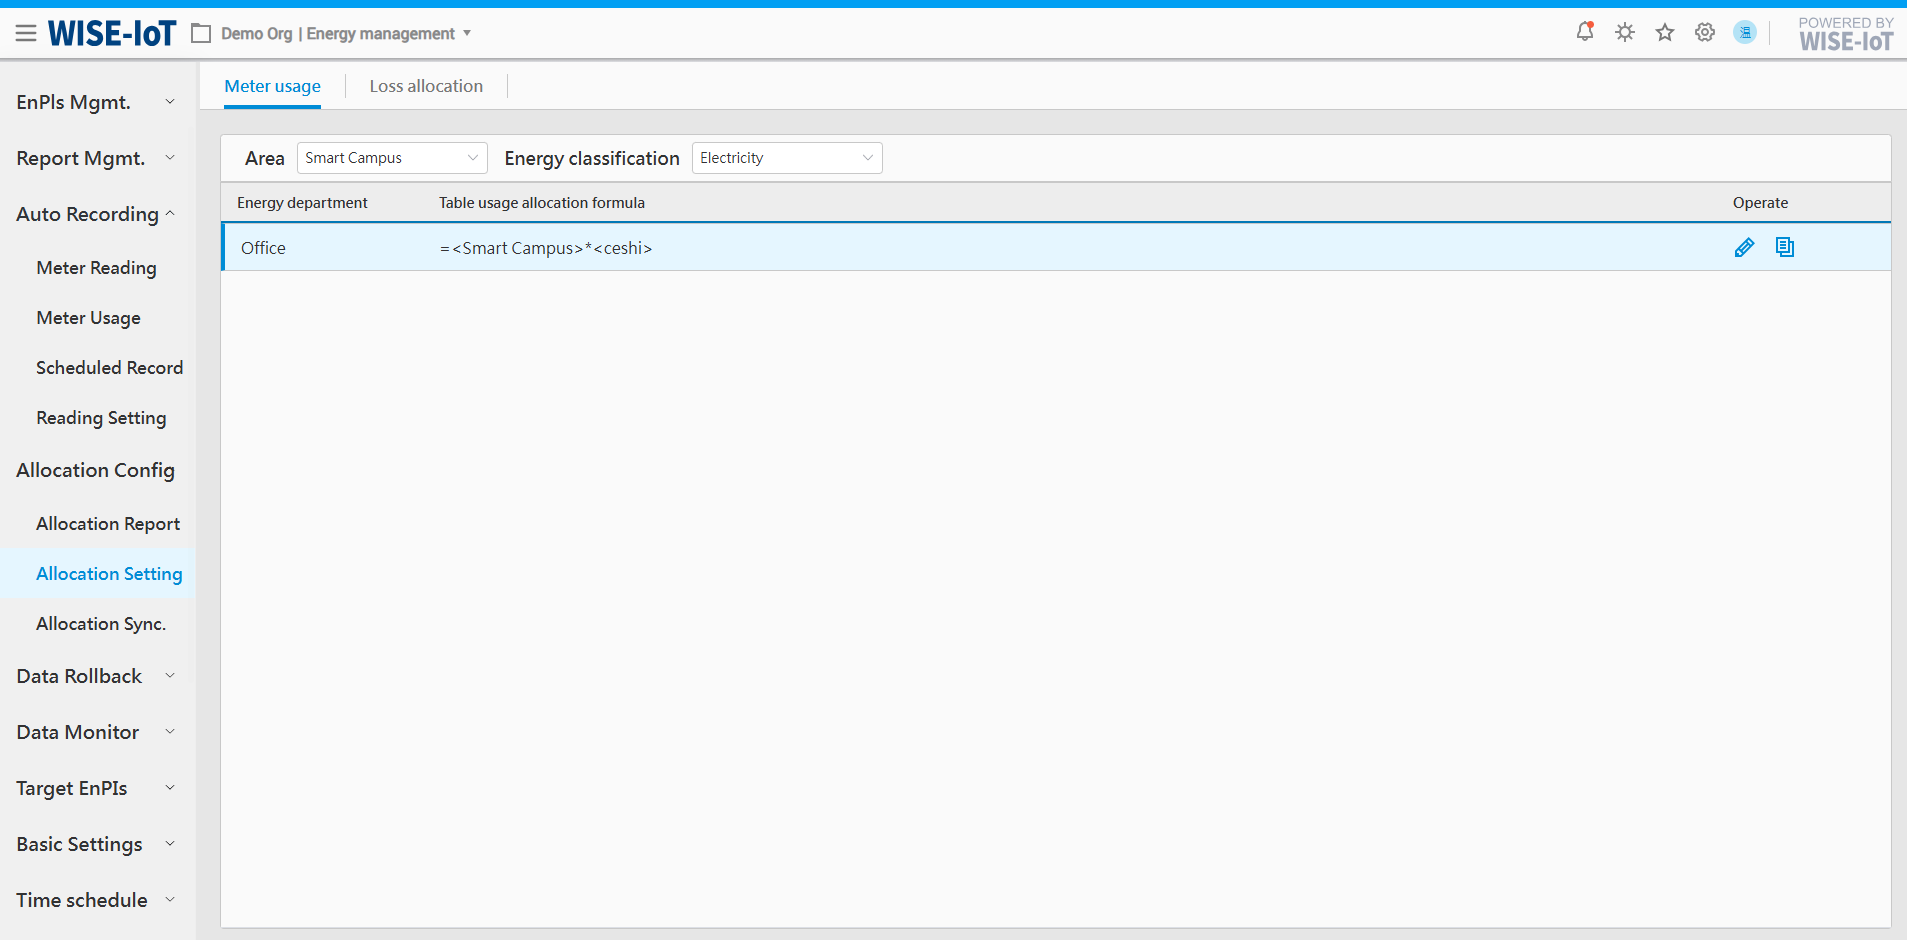
Metered Usage
Click Allocation Management > Allocation Setting > Metered Usage to access the Metered Usage Allocation Setup page:
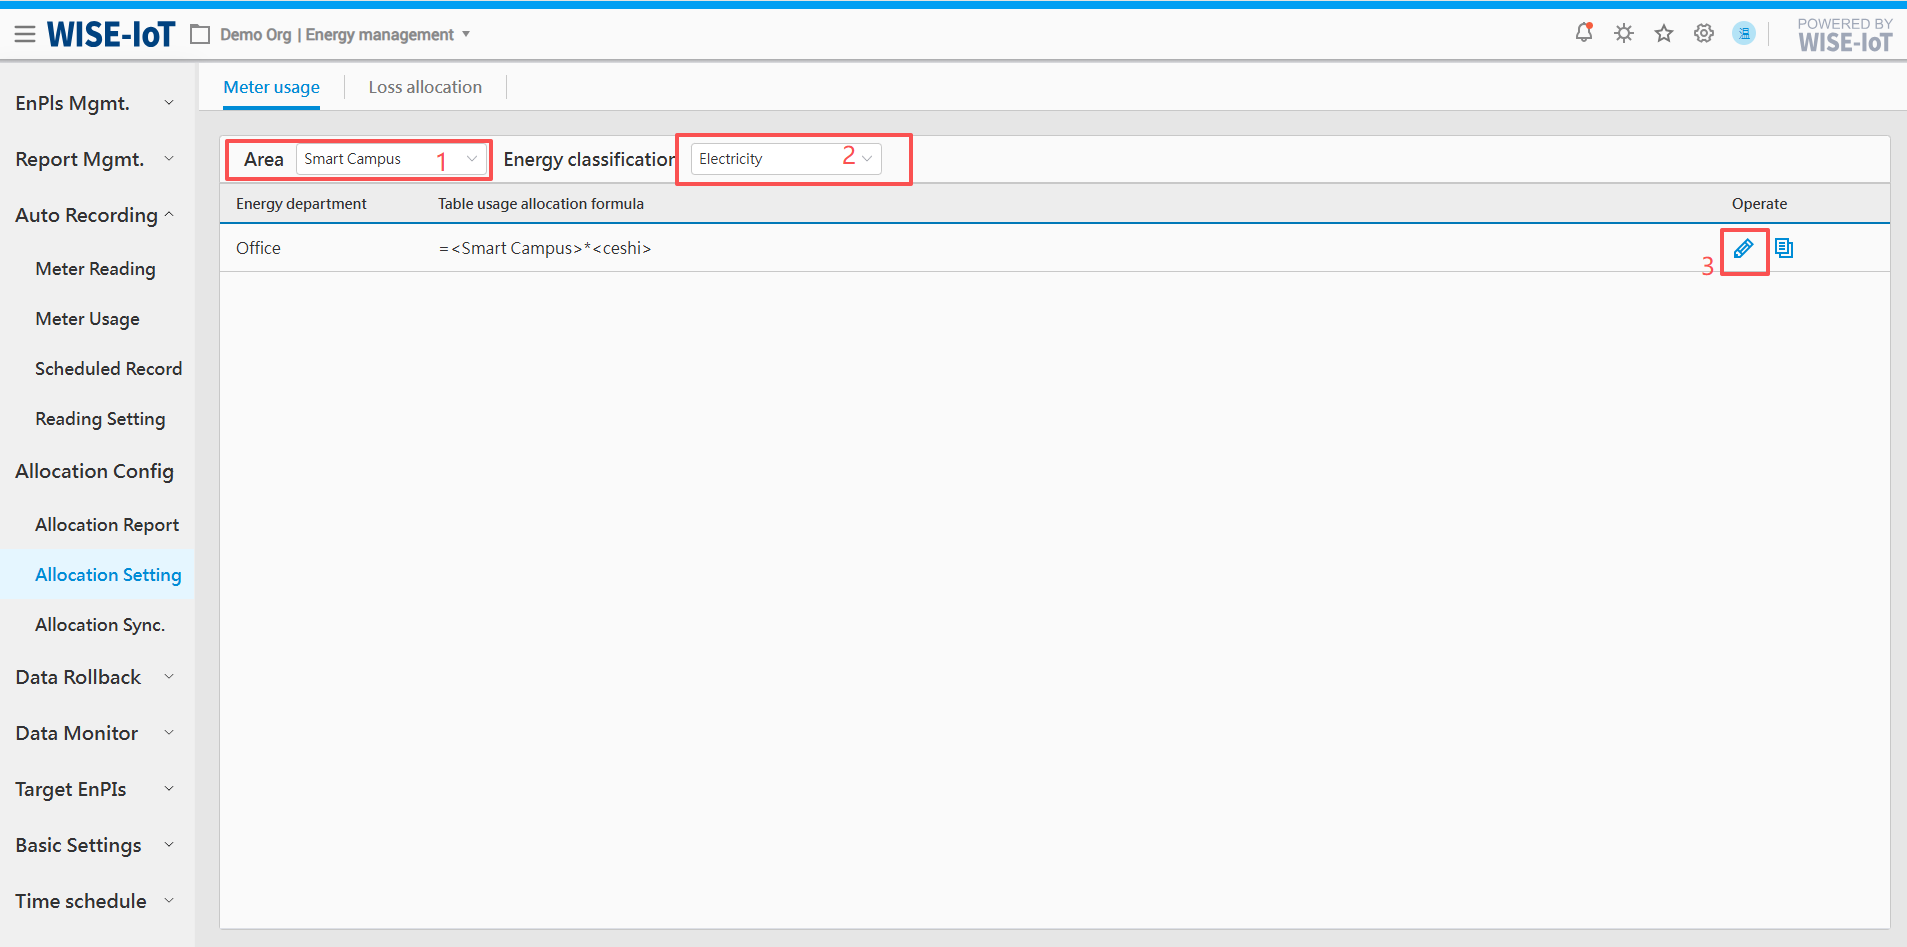
After selecting ① and ② in the figure above, click ![]() at ③ to edit the allocation formula.
at ③ to edit the allocation formula.
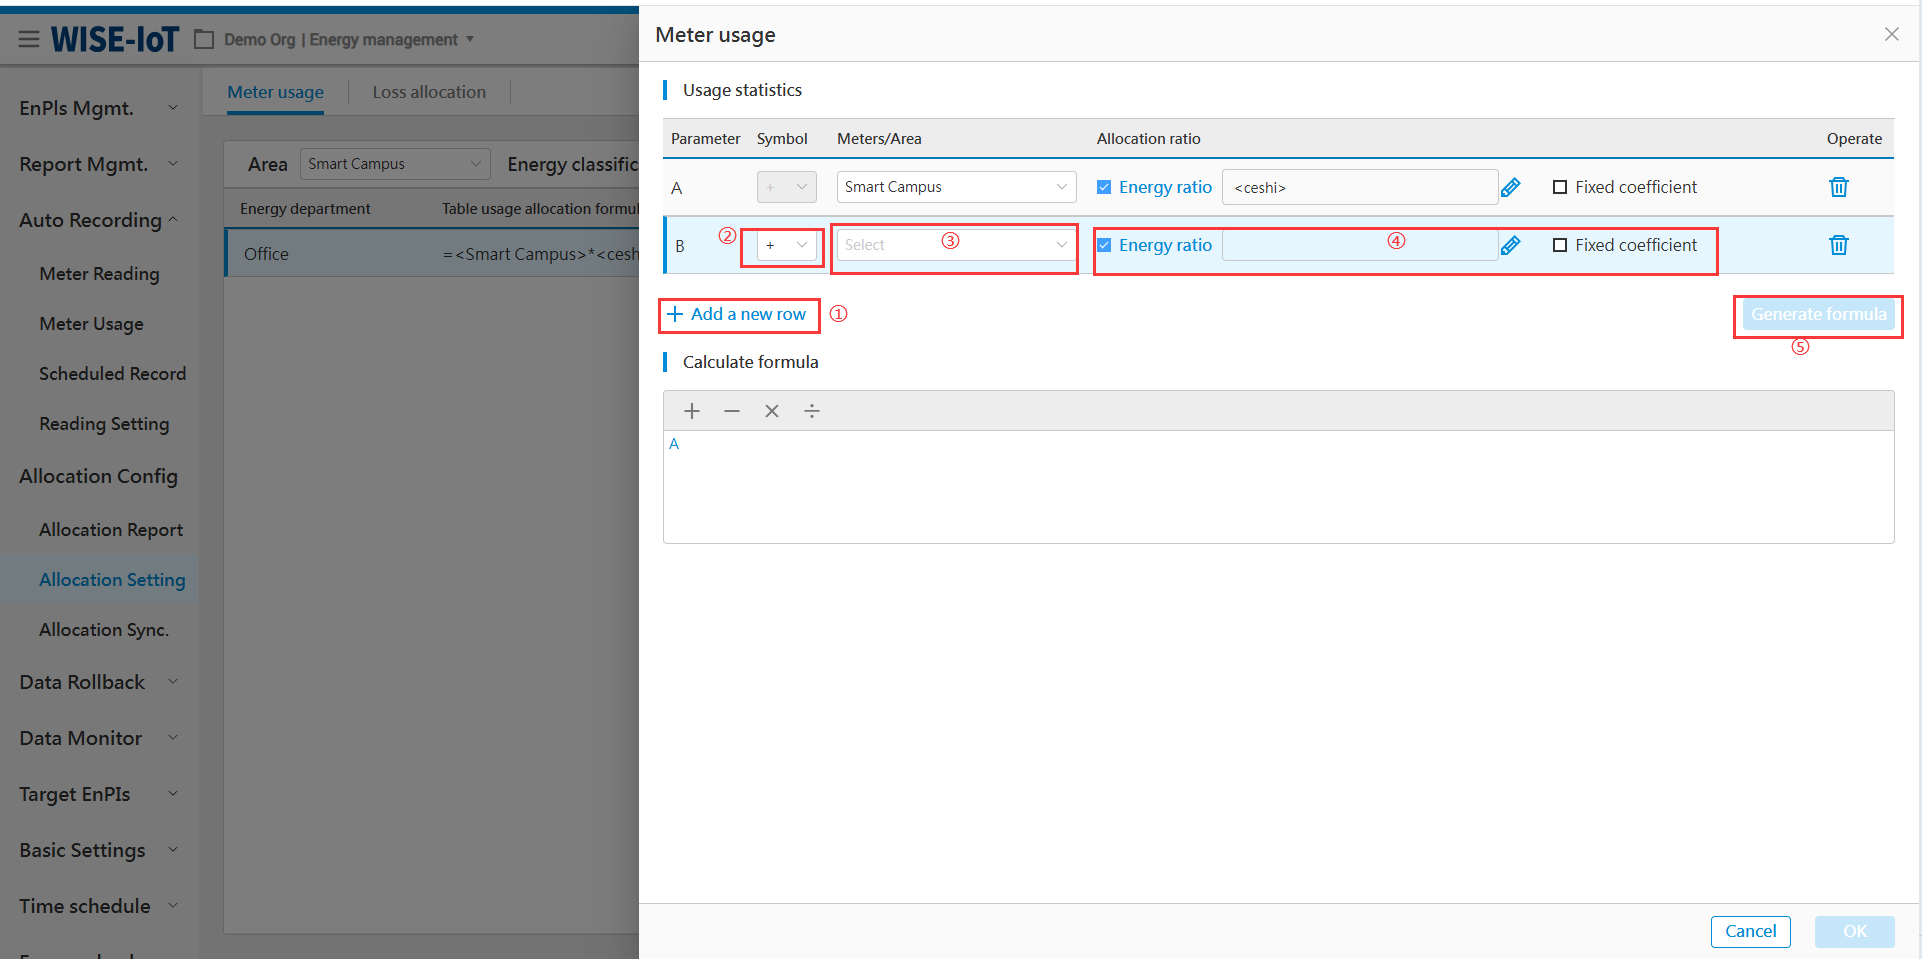
The allocation formula for metered usage primarily involves two steps:
- Step1: Usage statistics
Follow the steps in the figure above to complete the setup.
- Add a row
Each time a meter or area allocation is added, a new row needs to be added.
② Operation logic:
The operation logic allows selection of + or -;
+ signifies that the energy department needs to calculate allocated usage by adding (selected <meter/area> usage × allocation ratio).
- signifies that the energy department needs to calculate allocated usage by subtracting (selected <meter/area> usage × allocation ratio).
③Meter/zone:
The optional data sources for <meter/area> are derived from the business topology. Fuzzy search can assist users in quickly locating the <meter/area> requiring allocation.
④Allocation ratio
Allocation ratio fall into two types: energy-based allocation ratio (dynamic ratio) and fixed ratio.
Users may select both ratio types, in which case the calculation follows: <meter/area> usage * < energy-based allocation ratio>* <fixed ratio>.
Select <fixed ratio>, whose default value is 1. Decimal values are permitted (maximum 6 decimal places allowed).
For detailed implementation of energy allocation ratios, please refer to the Energy-based Ratio.
After completing the above configurations, click ![]() to proceed to Step 2.
to proceed to Step 2.
- Step2: Calculation formula
After Generate Formula is clicked, the system will create formulas based on the meters and allocation ratios selected in the usage statistics area. Users can modify formulas within the formula calculation section.
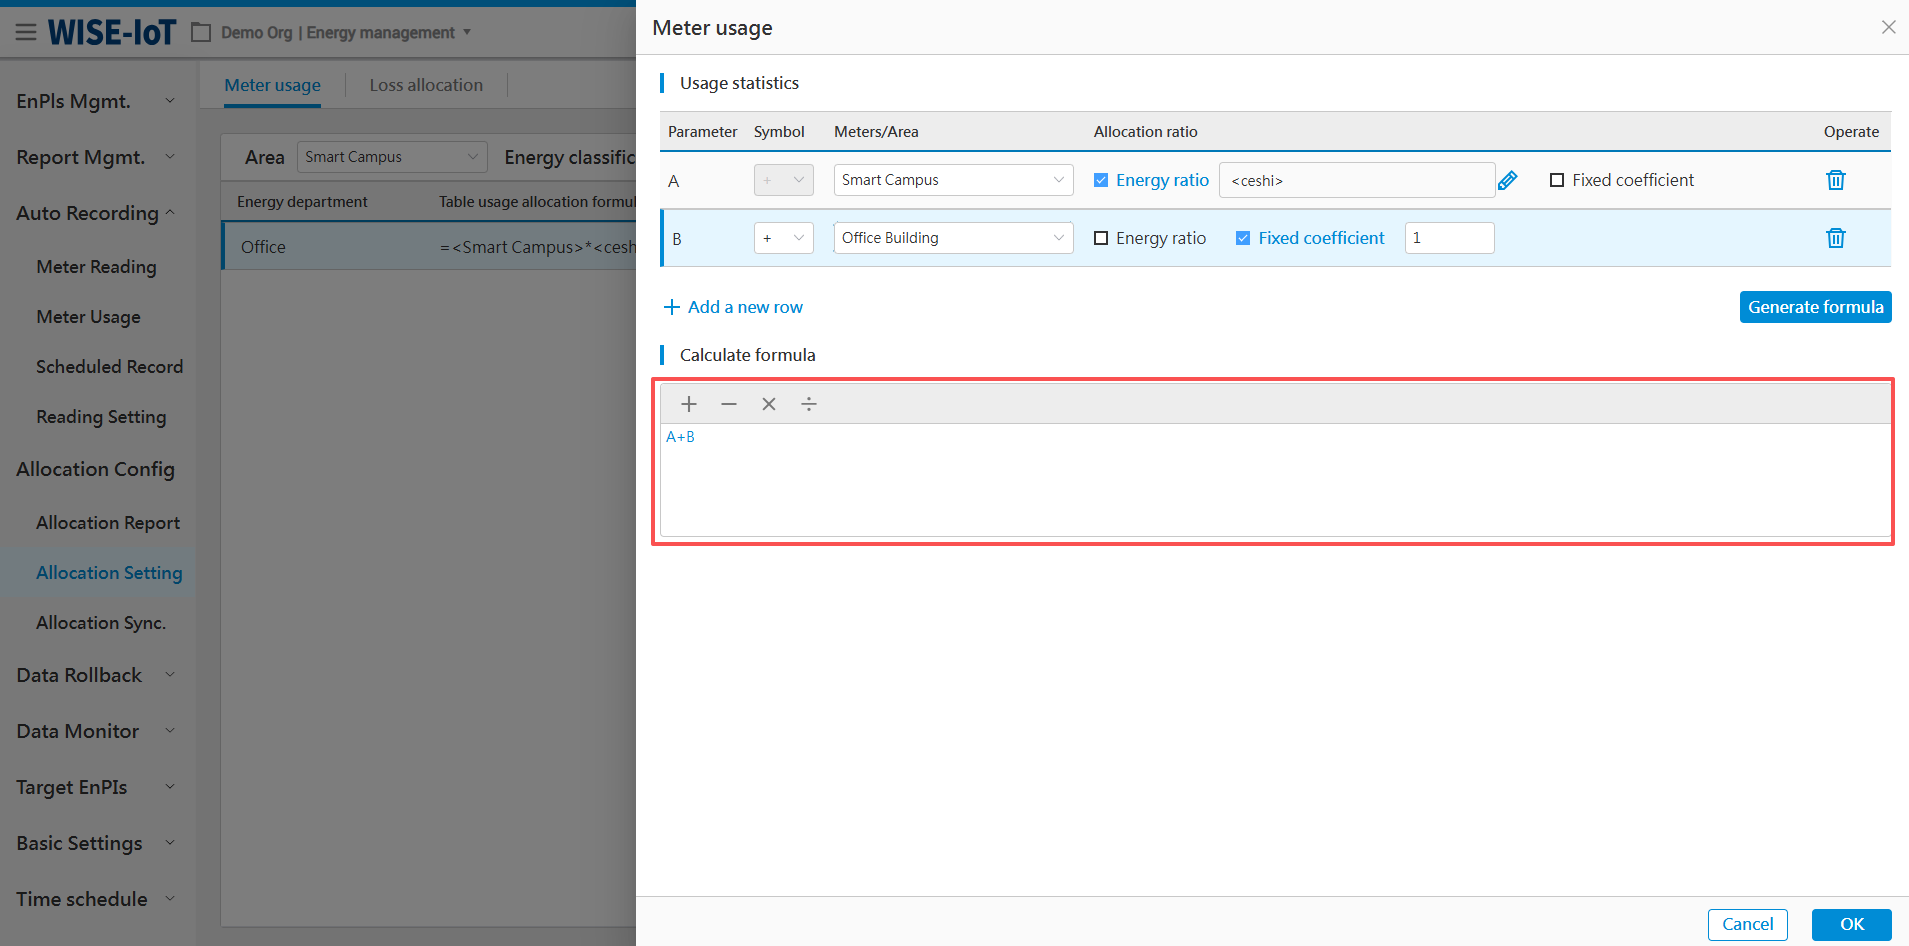
- 3. Confirmation
After clicking OK, the configuration of metered usage formula is done.
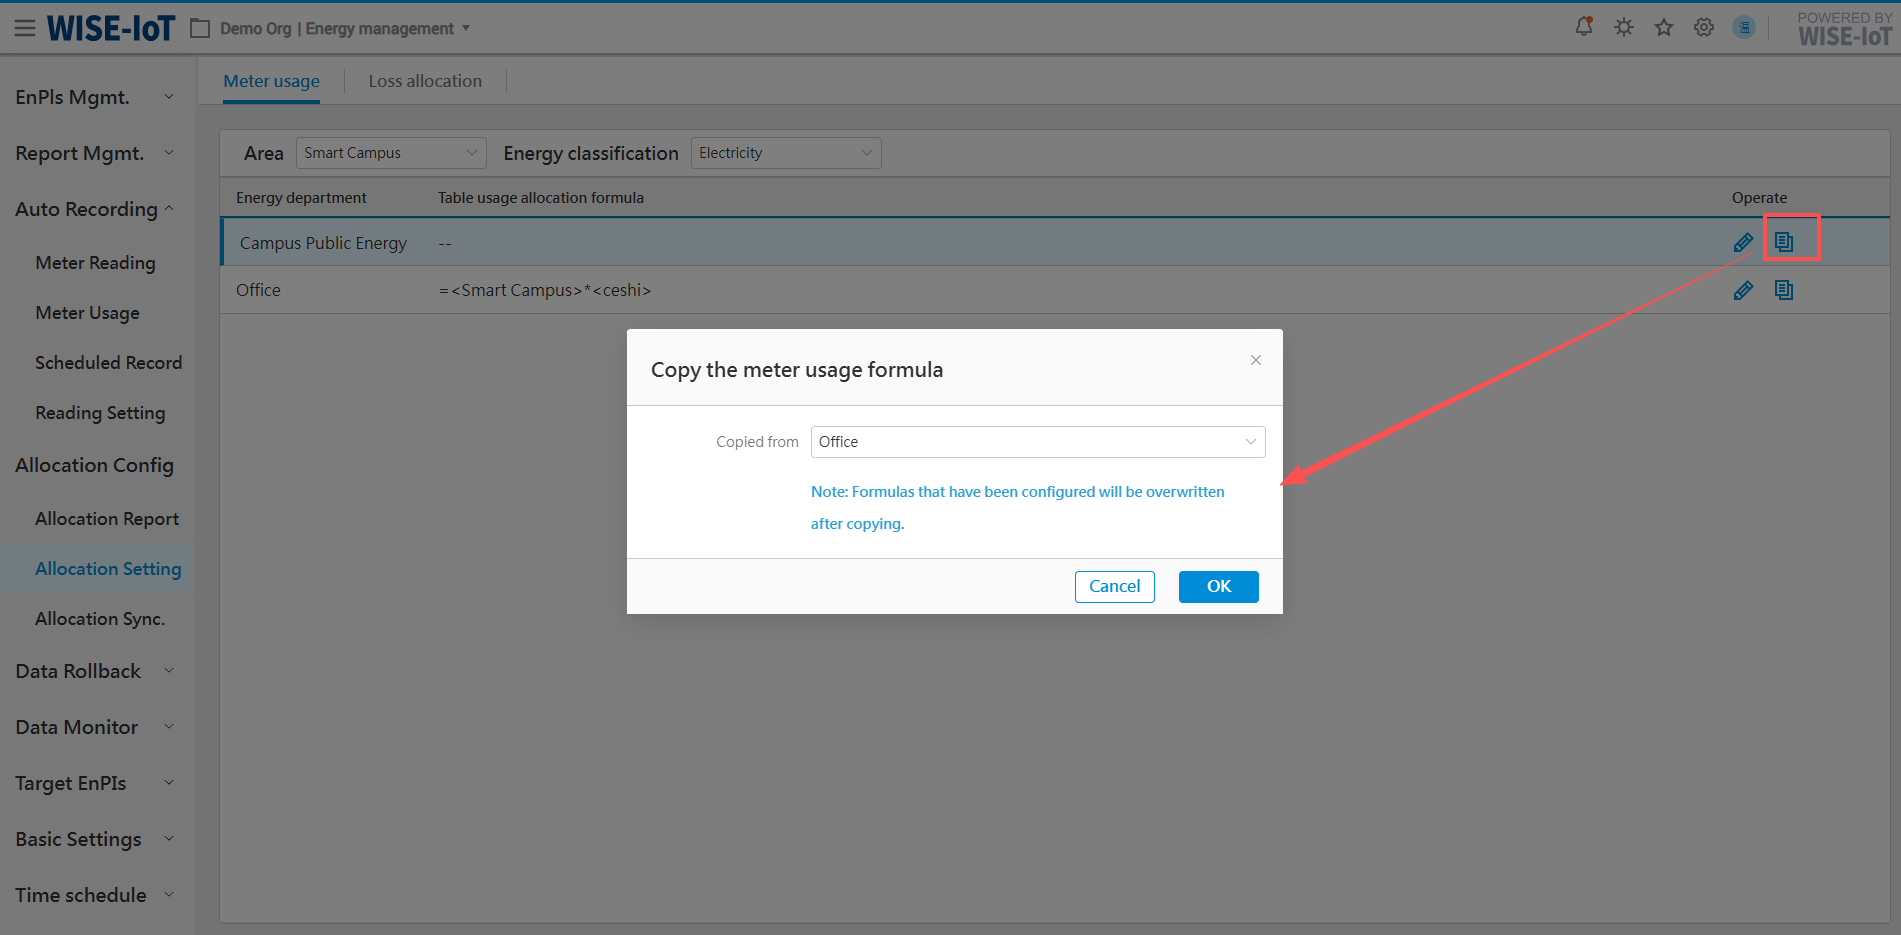
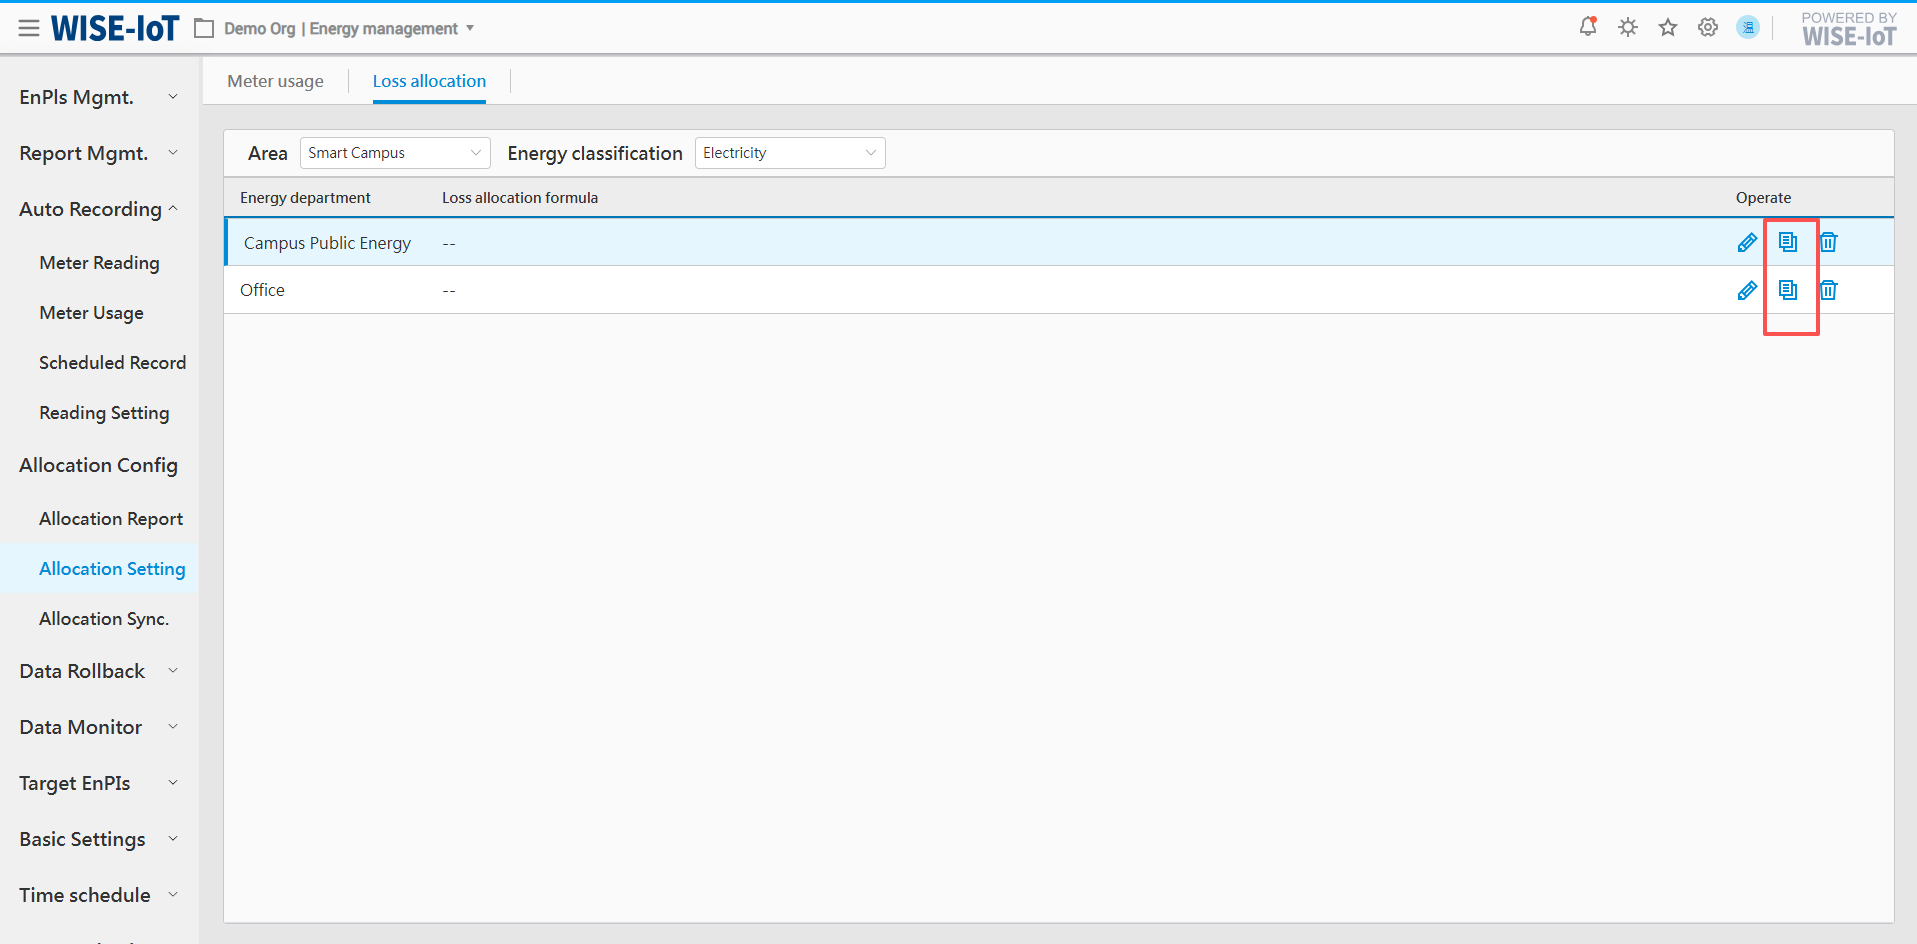
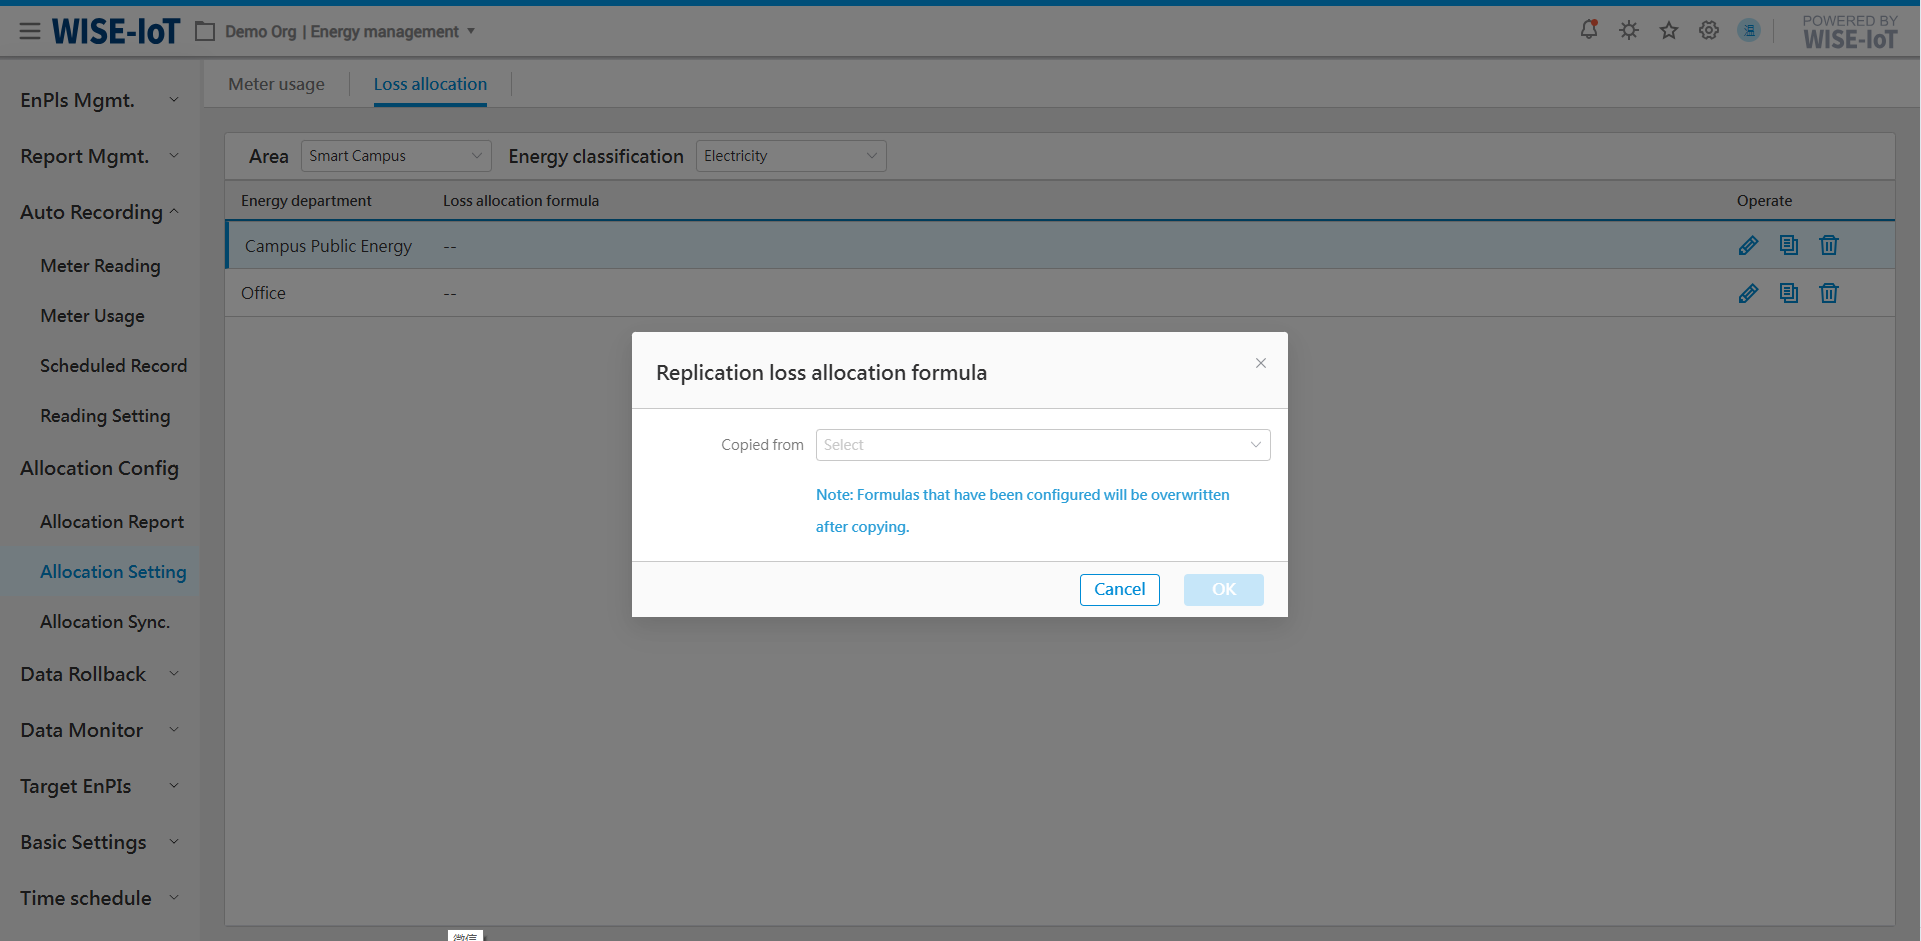
Copy Metered Usage Allocation Formulas
Click ![]() next to the Allocation Formula in the figure above, select which department's formula should be copied in the figure below, and click Confirm to proceed.
next to the Allocation Formula in the figure above, select which department's formula should be copied in the figure below, and click Confirm to proceed.
Loss Allocation
Click Allocation Management > Allocation Setting > Loss Allocation to access the Metered Usage Allocation Setting page.
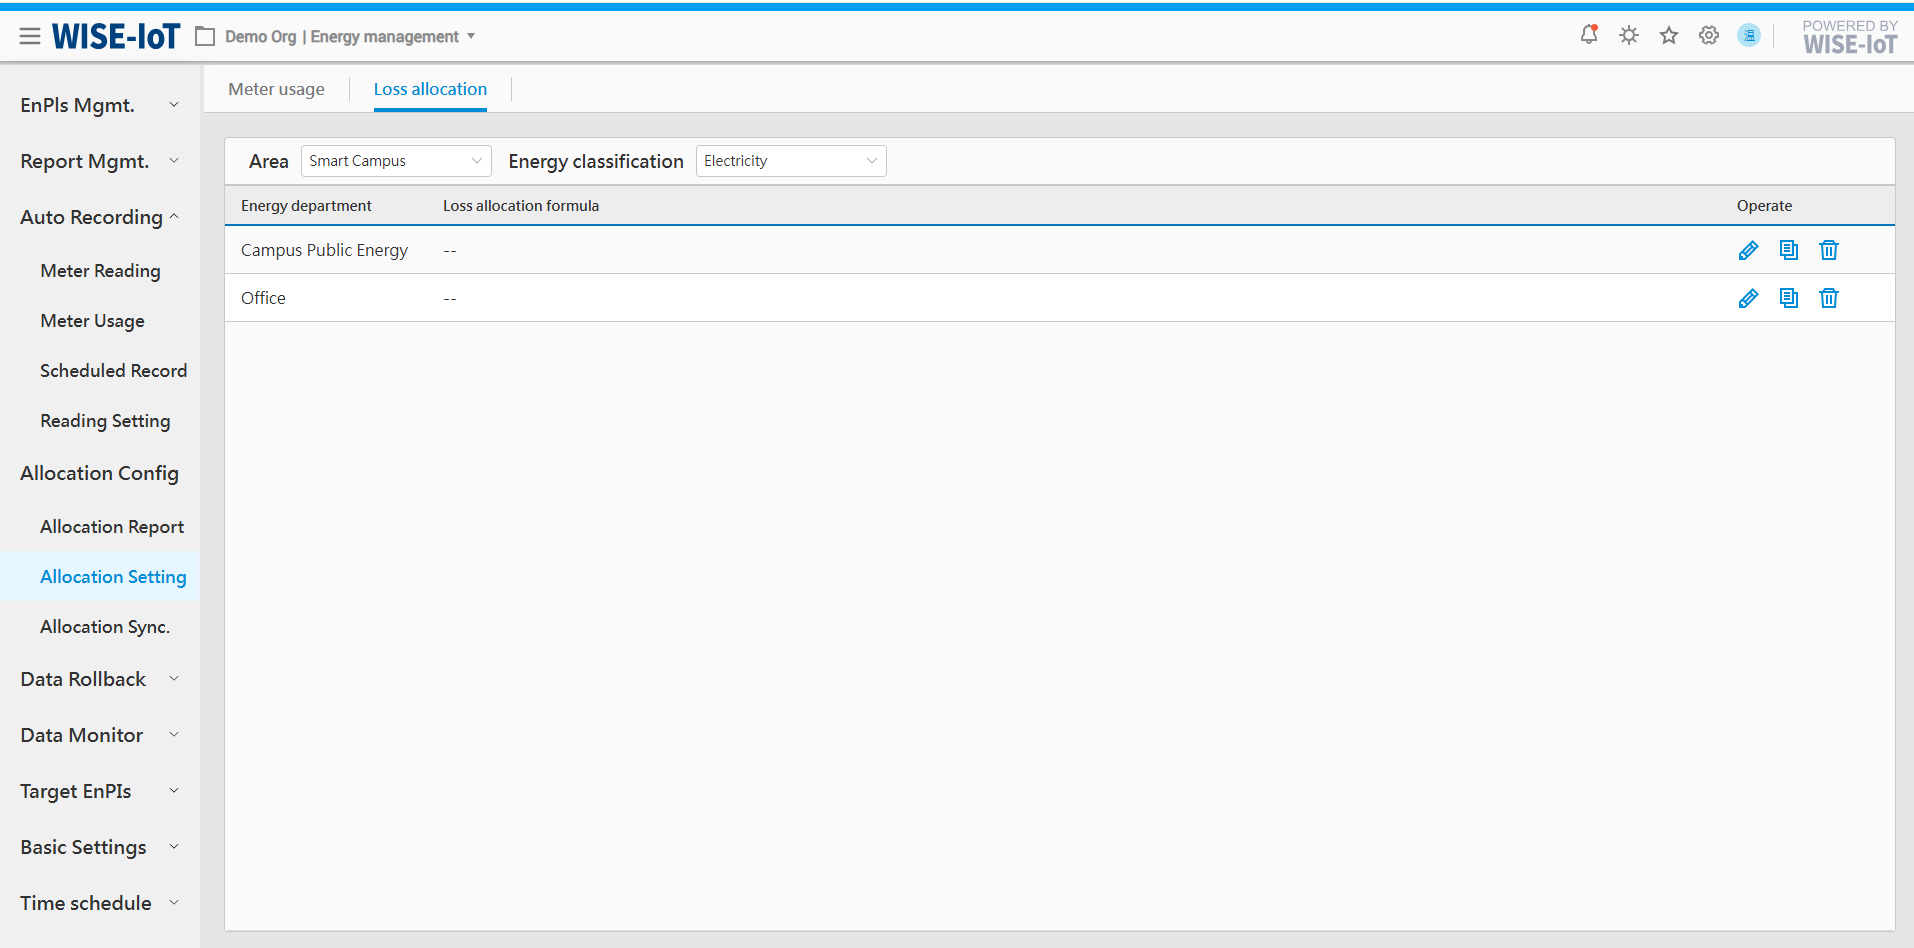
Energy Department's Loss Allocation = Total Line Loss (representing total loss between master meters and sub-meters) × Line Loss Ratio (representing the proportion of loss allocated to the Energy Department)
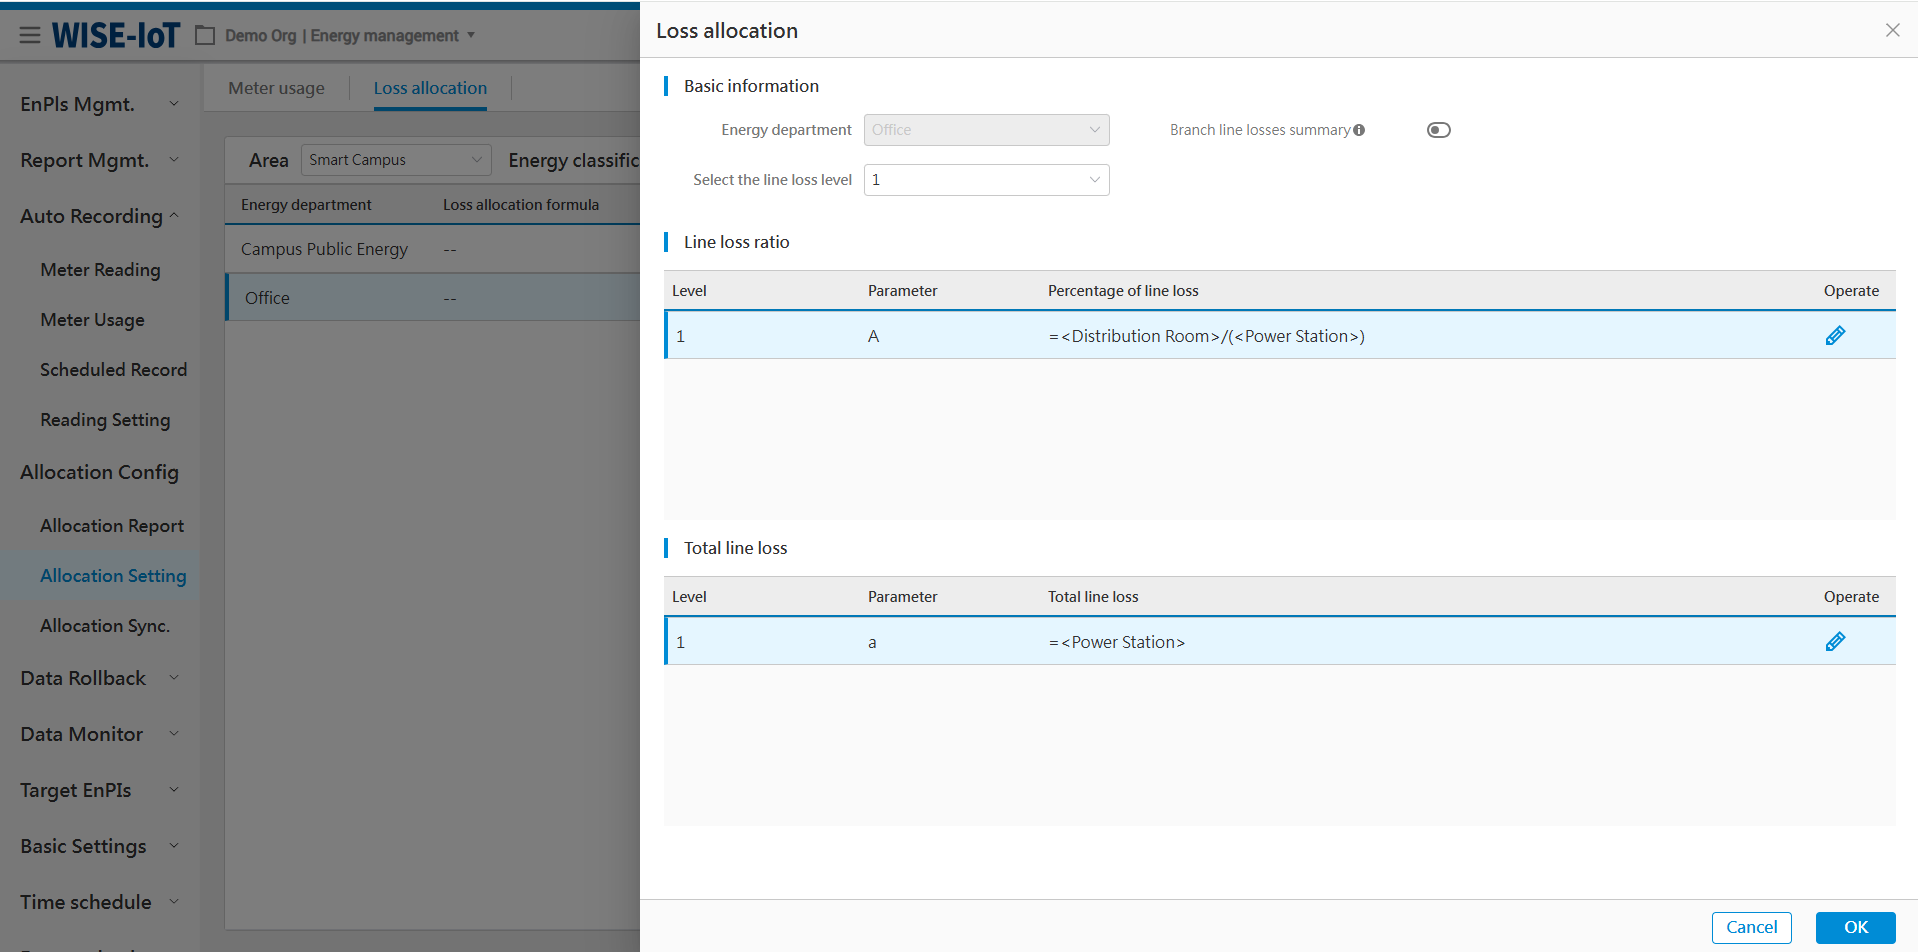
Basic information of the Loss Allocation page:
-
Multi-layer line loss: Calculate the line loss at each layer to get the final layer's line loss.
-
Multi-branch Line Loss: Configure multi-branch line loss for a department. The sum of losses from all branches constitutes the department's loss allocation.
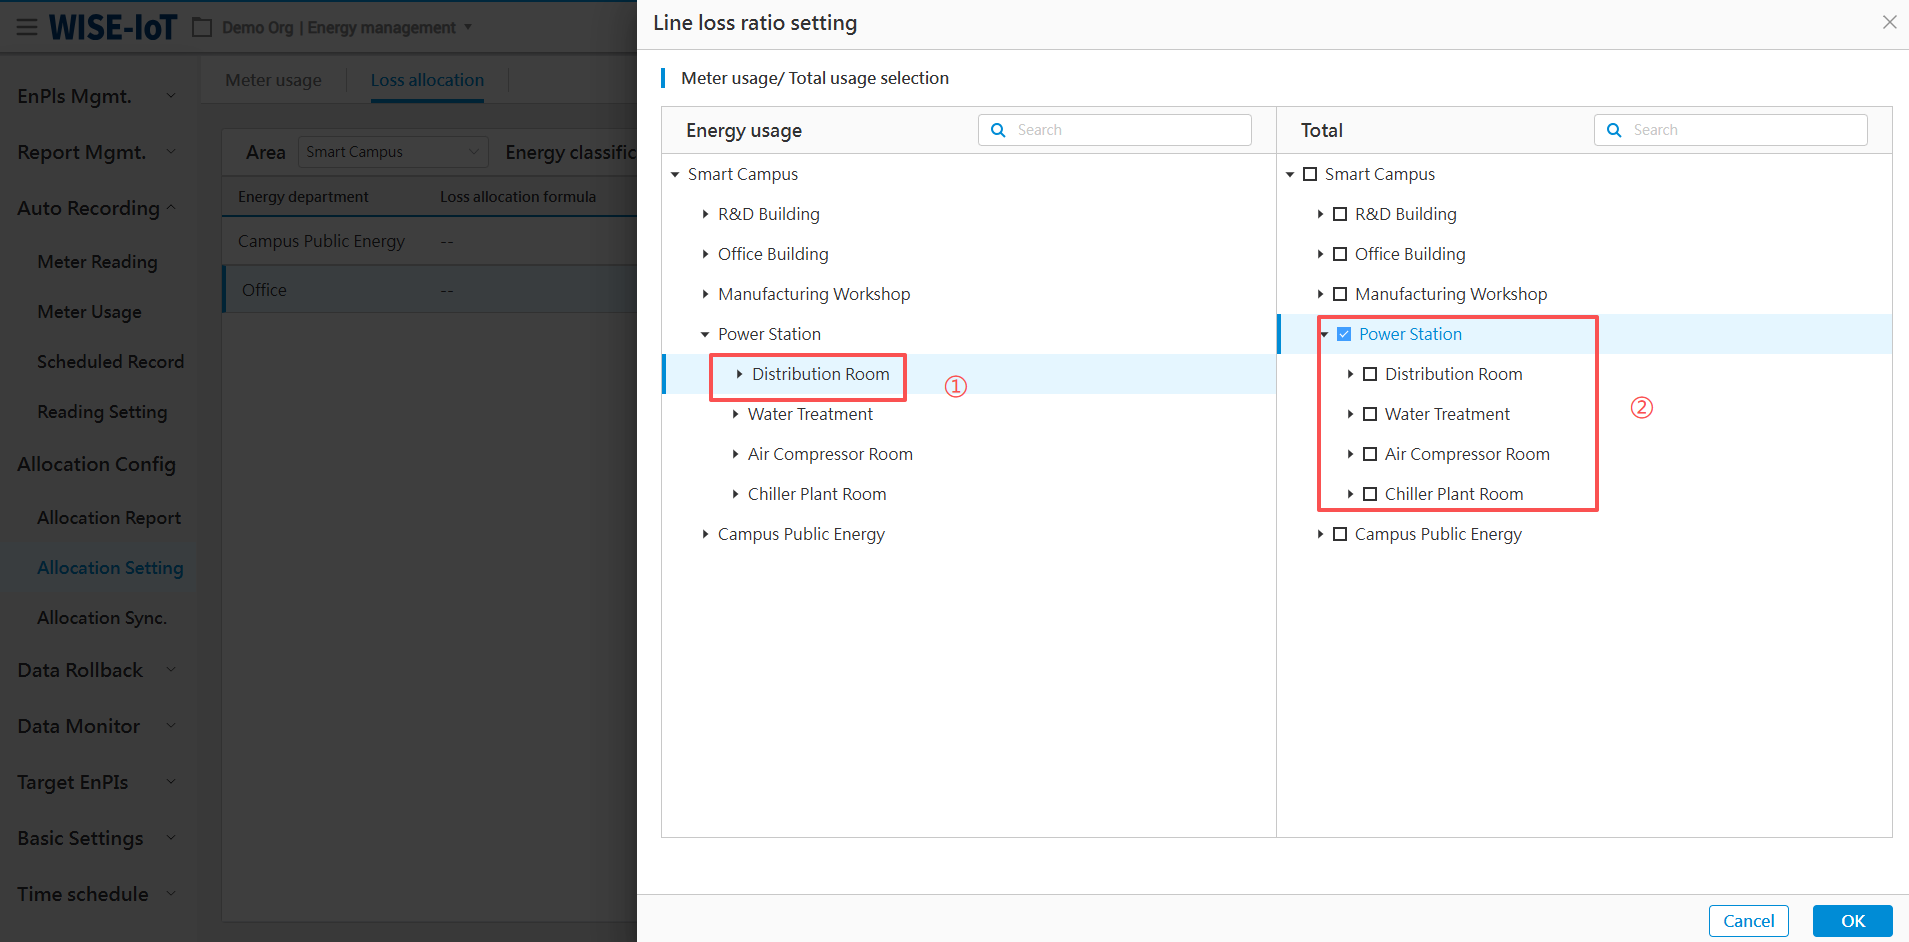
Line Loss Ratio
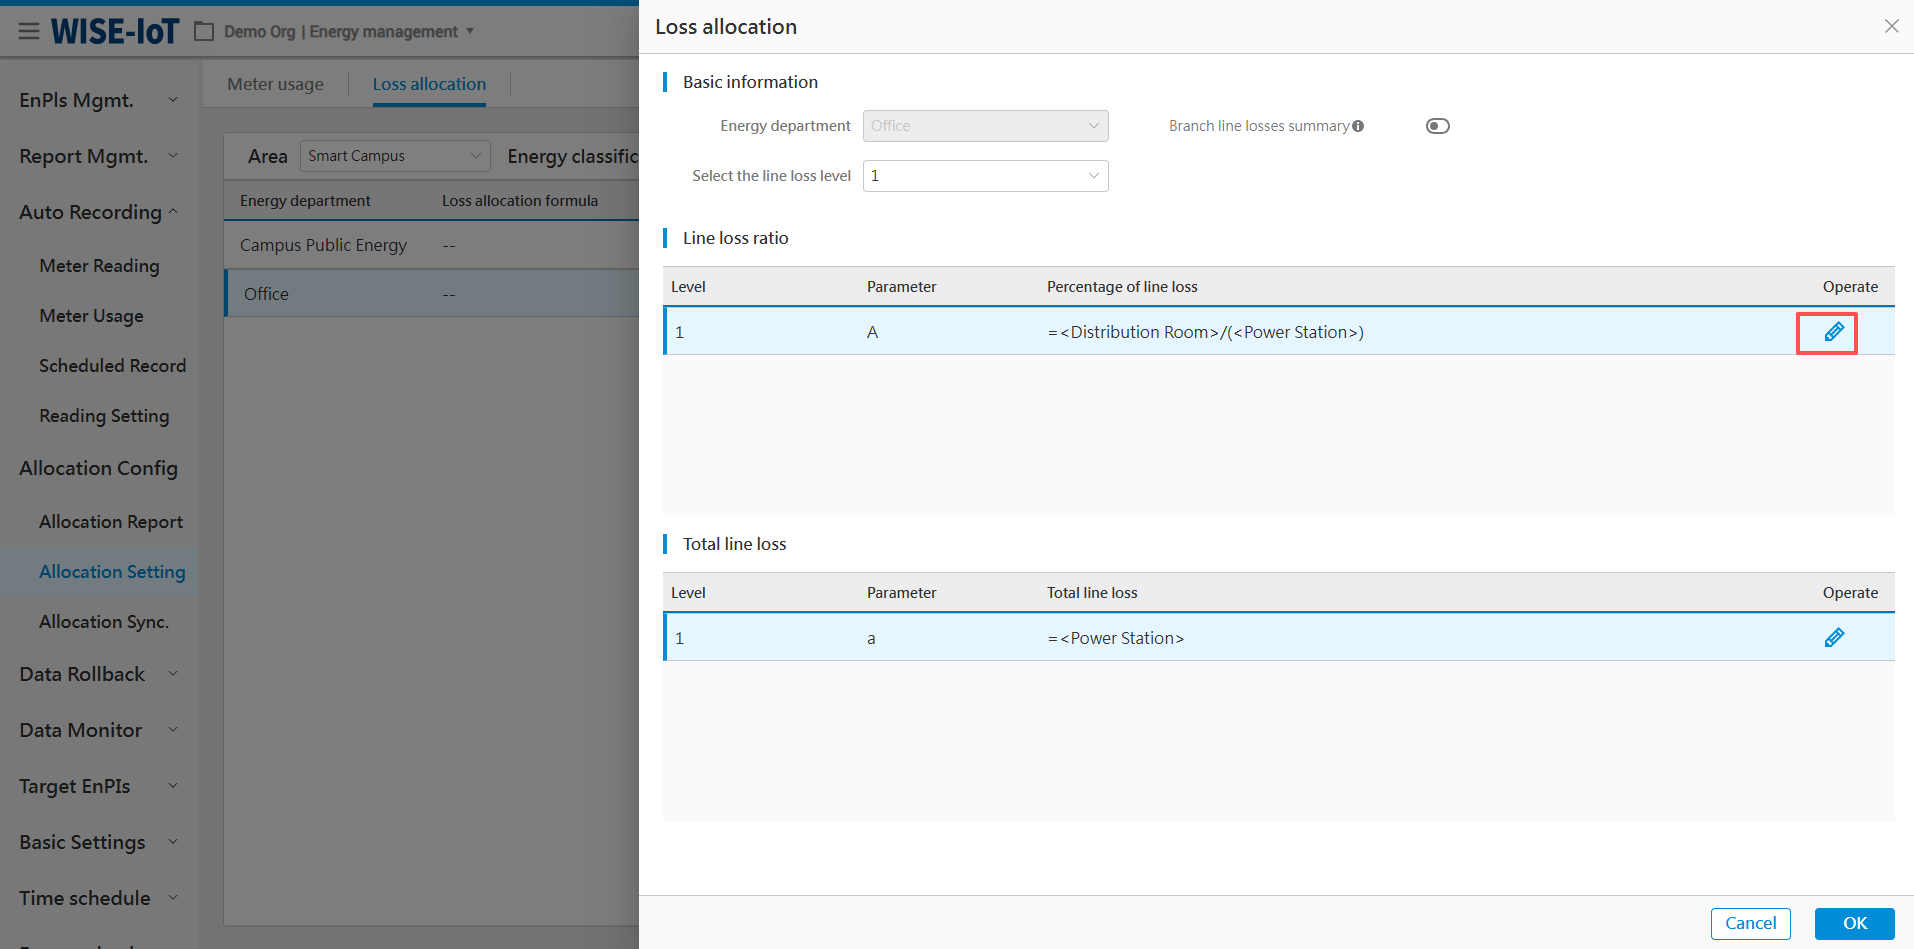
Click ![]() under the Line Loss Ratio in the figure above to access its setup page, then follow the steps below to complete the setup.
under the Line Loss Ratio in the figure above to access its setup page, then follow the steps below to complete the setup.
-
Select allocation department usage's node (single choice);
-
Choose the usage of departments participating in the allocation;
-
Confirm and save the setup.
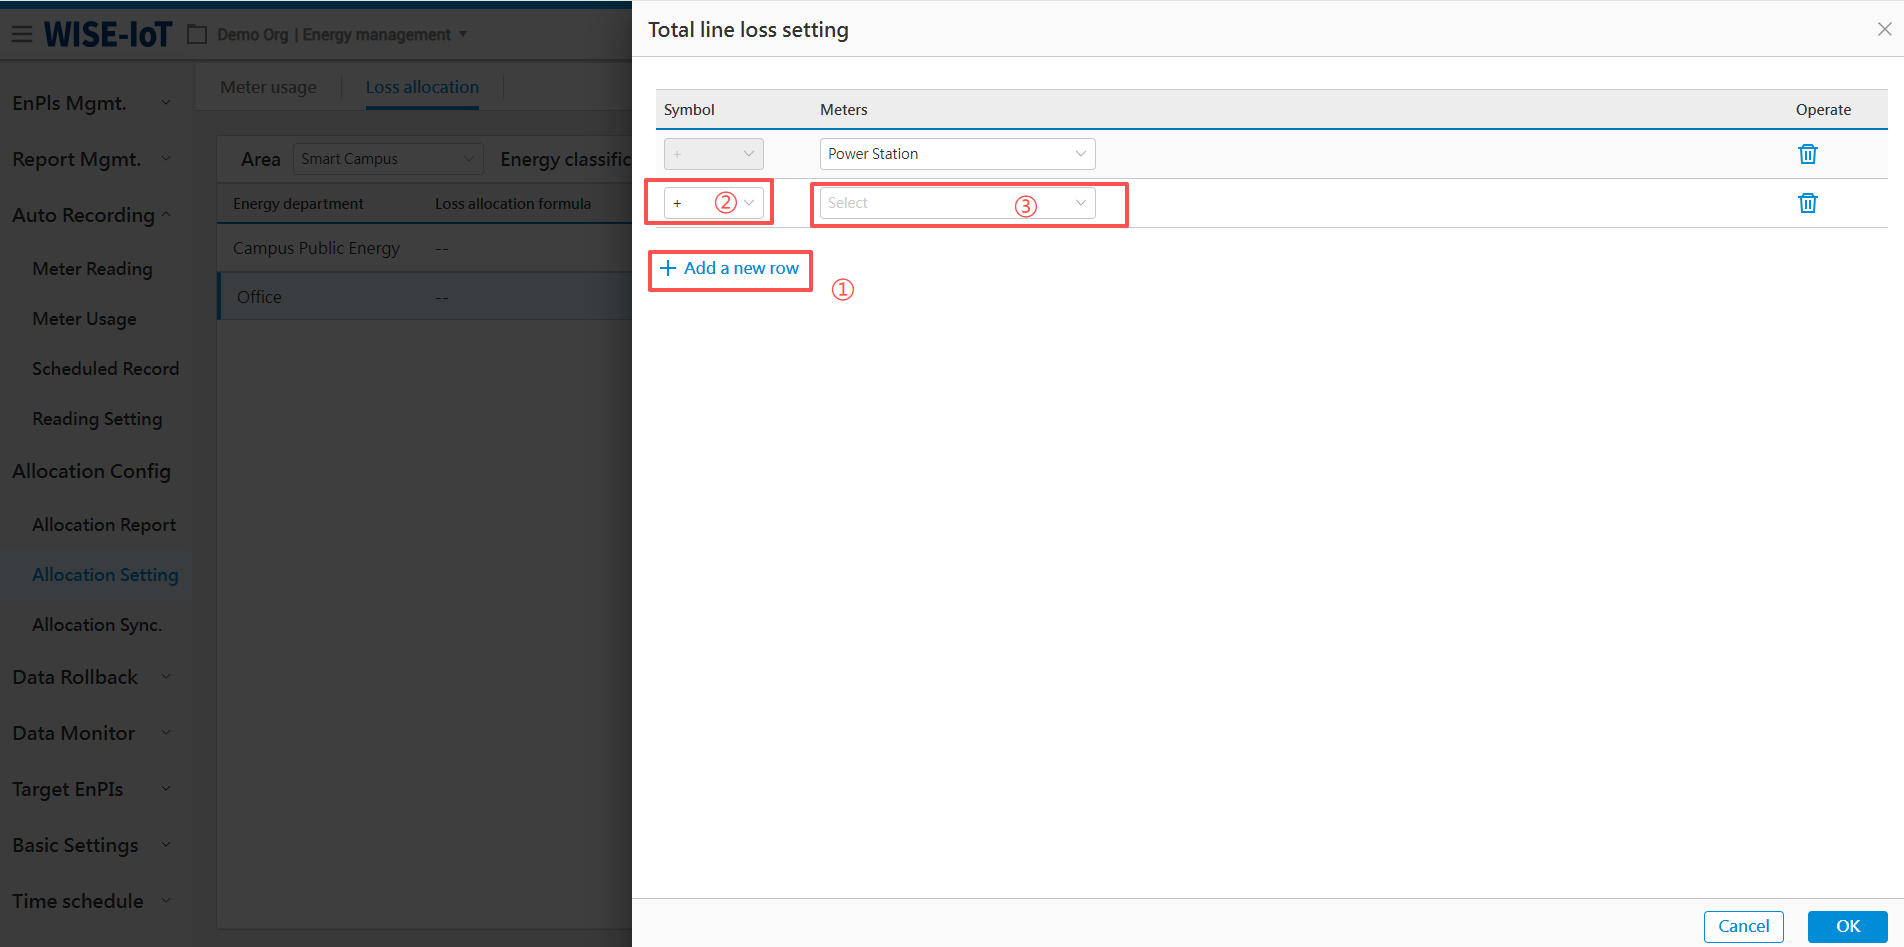
Total Line Loss

Click ![]() under the Total Line Loss in the figure above to access its setup page, then follow the below steps to complete the setup.
under the Total Line Loss in the figure above to access its setup page, then follow the below steps to complete the setup.
-
Click to add a new row;
-
Select the meter's calculation method;
-
Choose the meter or business node name;
-
Click "OK" to confirm and save the setup.
Copy Line Loss Allocation Formula
Click ![]() next to the Allocation Formula in the figure above, select the department whose formula needs to be copied in the figure below, and then click Ok to complete the operation.
next to the Allocation Formula in the figure above, select the department whose formula needs to be copied in the figure below, and then click Ok to complete the operation.
Energy-based Ratio
Please select energy-based ratio on the Metered Usage's Allocation Formula page.
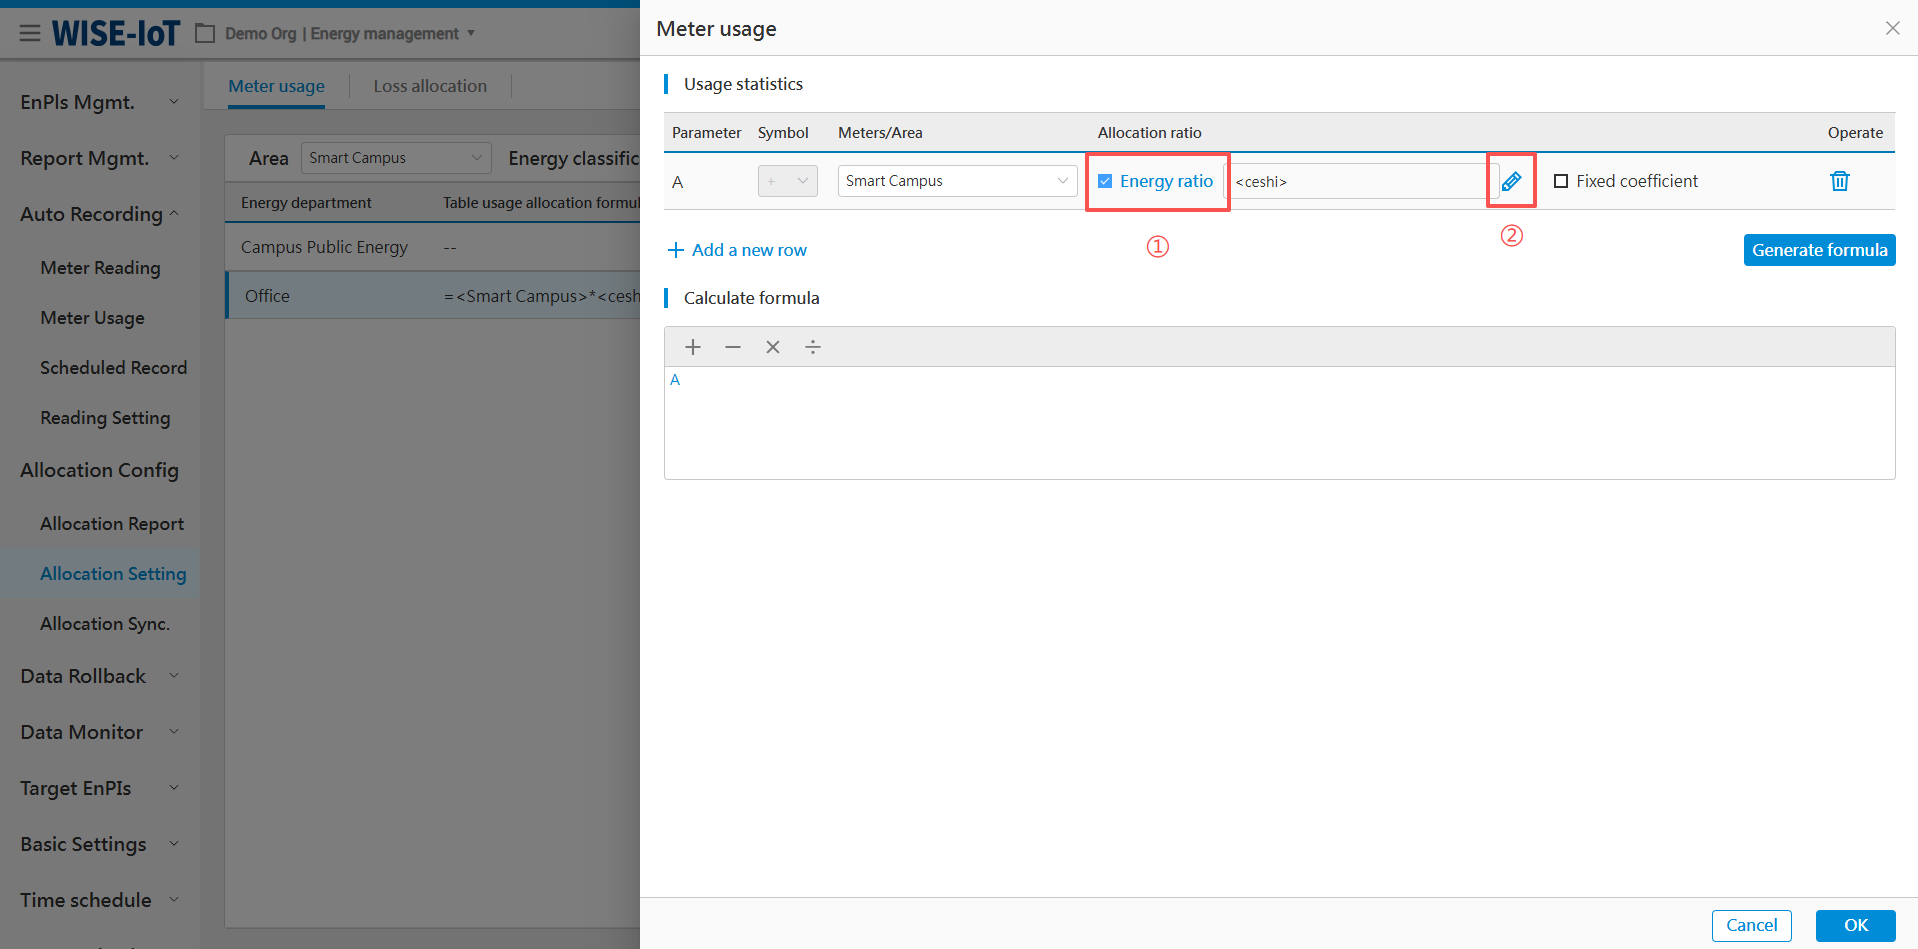
Click ![]() to access the Energy-based Ratio interface. Select energy ratio as needed and click "OK".
to access the Energy-based Ratio interface. Select energy ratio as needed and click "OK".
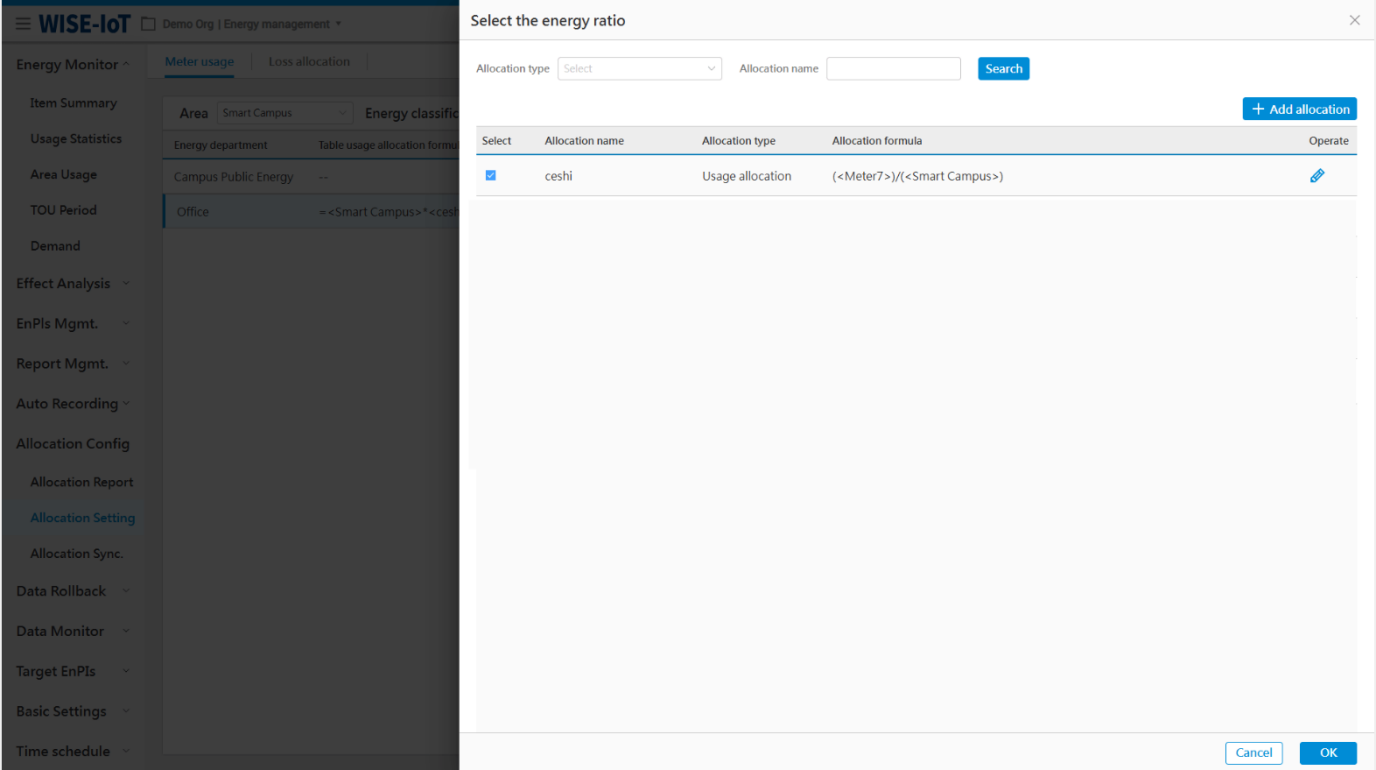
Click ![]() to add an allocation ratio:
to add an allocation ratio:
Energy-based ratio allocation falls into four types: specific energy usage, production condition, usage allocation, and output allocation. Their settings will be detailed in the following chapters.
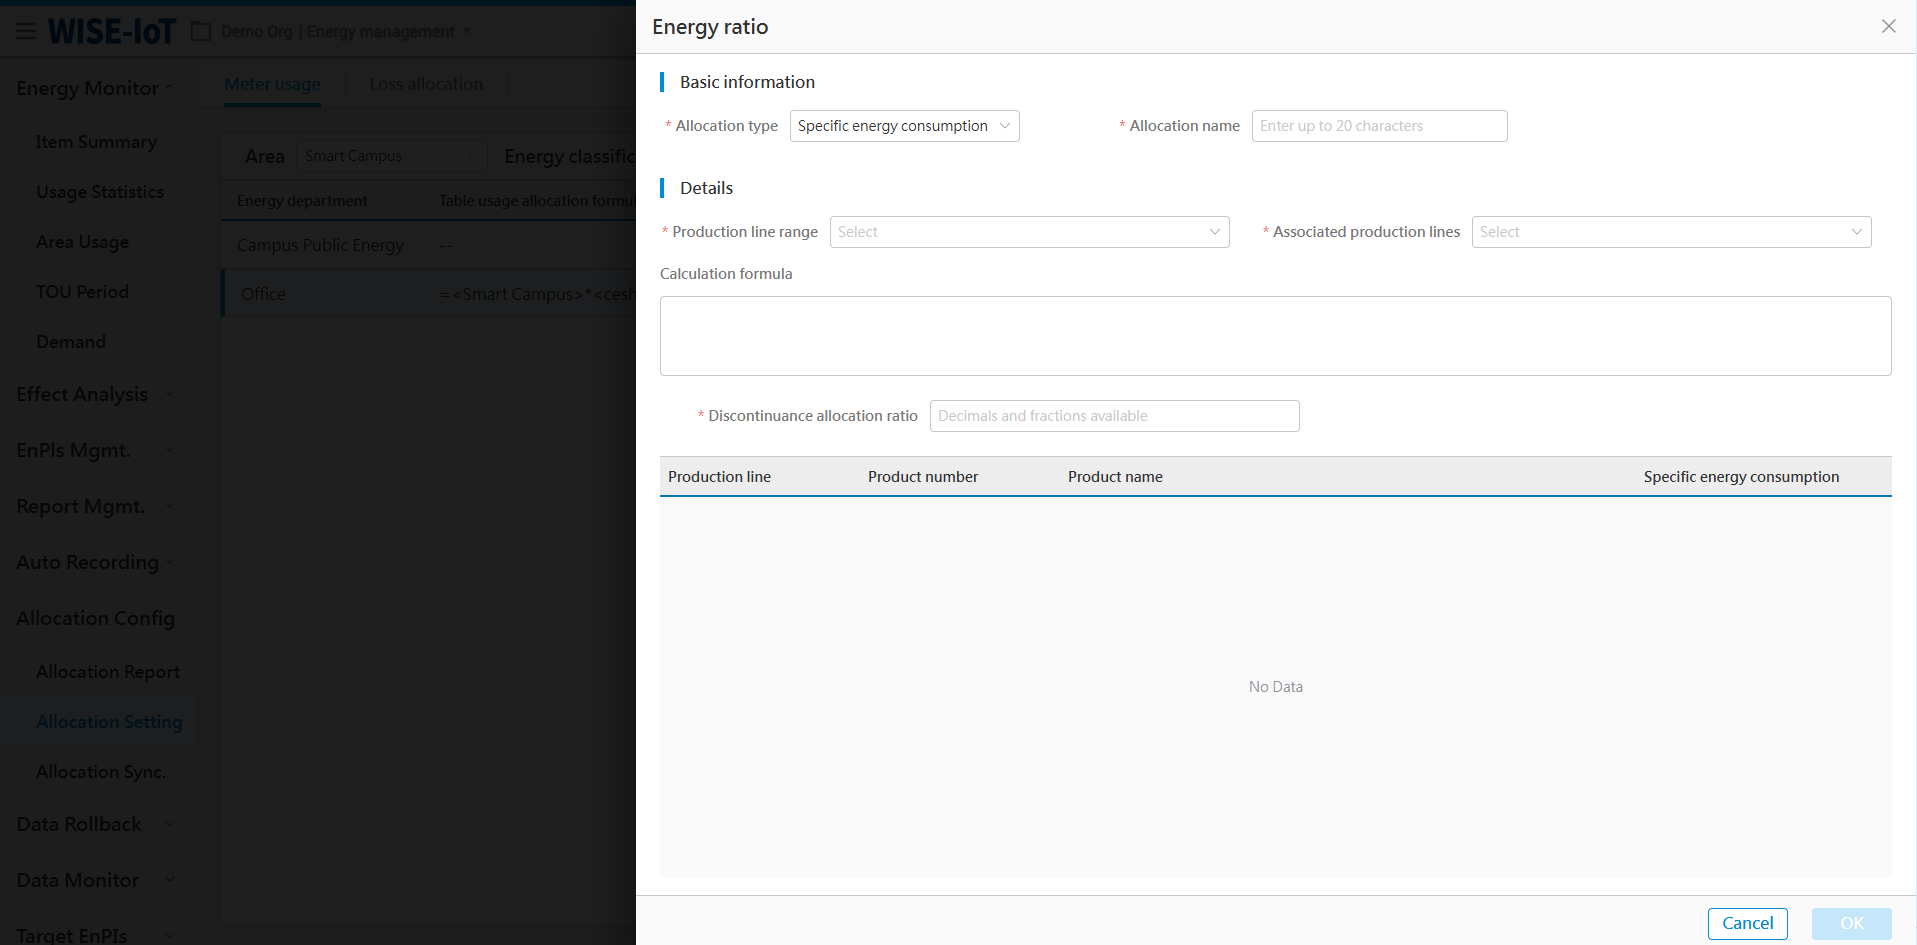
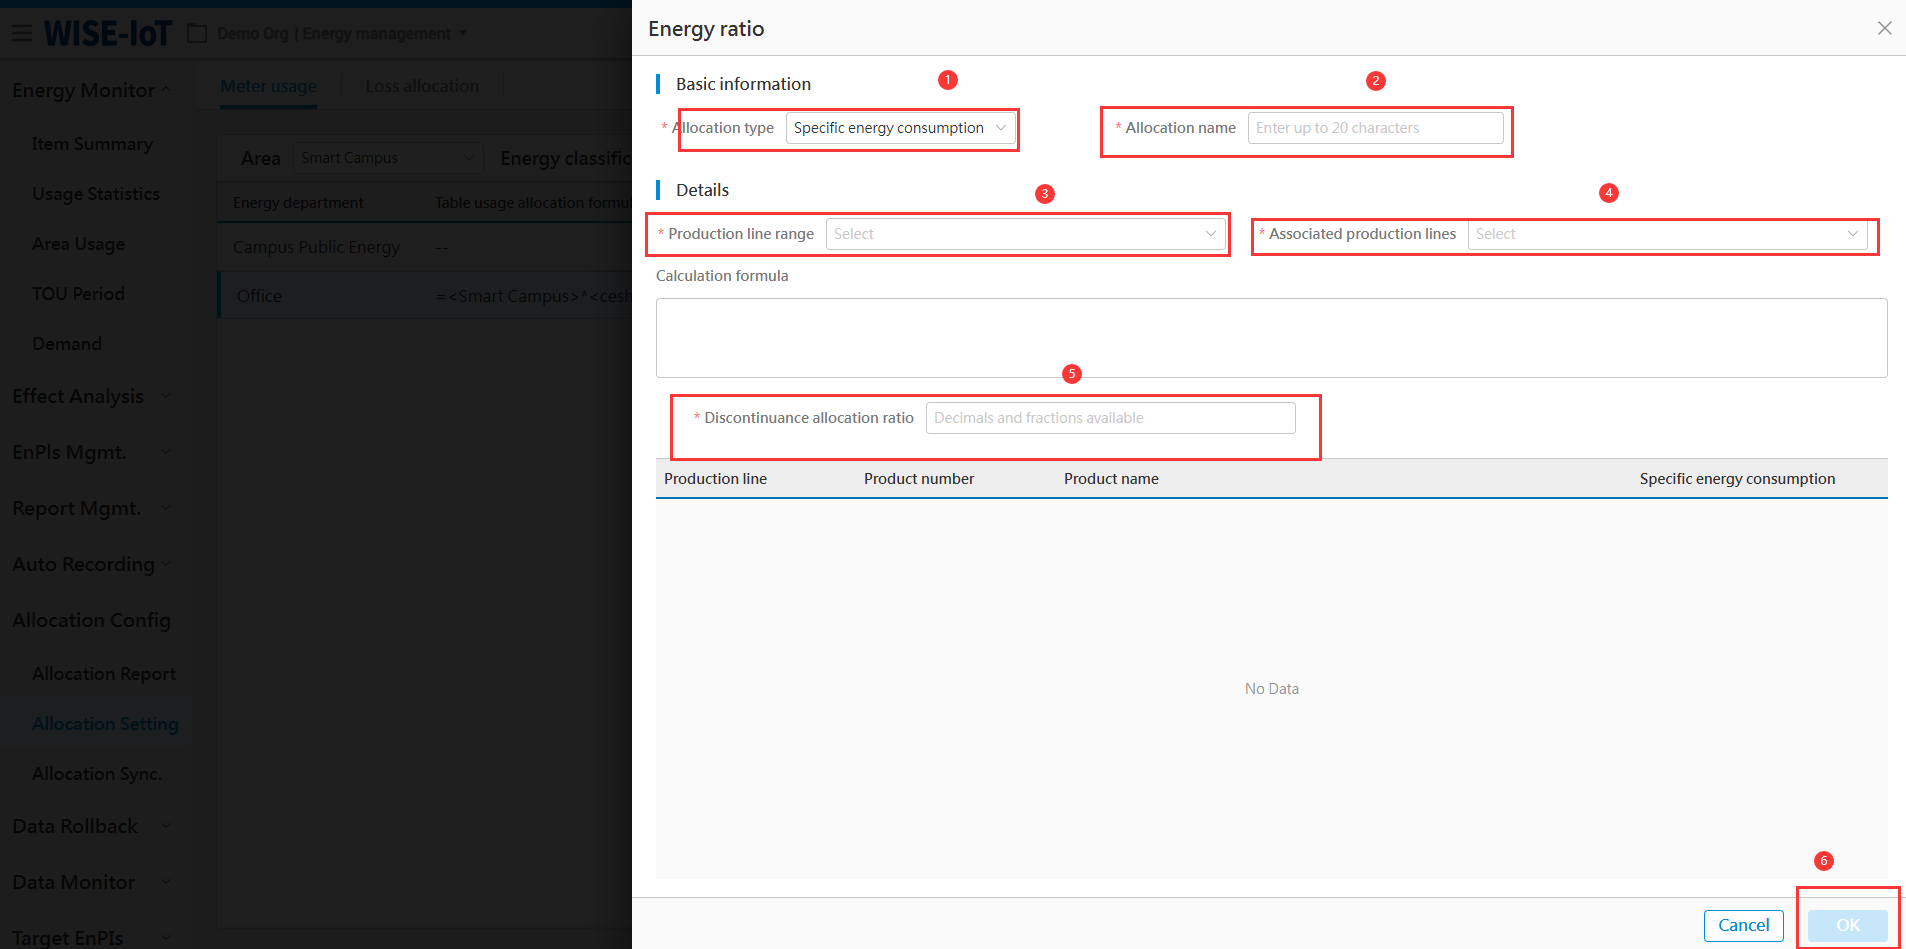
Specific energy consumption
Application scenarios of the ratio of specific energy consumption
Products have specific energy usage, based on which allocation can be conducted.
Steps:
Follow the steps below to configure the ratio of specific energy usage.
-
Select ratio type
-
Name the ratio. Duplicate names are prohibited.
-
Select the production line(s) corresponding to the "denominator" in the ratio calculation
-
Select the production line(s) corresponding to the "numerator" in the ratio calculation
-
The fixed ratio used after shutdown when usage cannot be allocated based on specific energy usage ratio.
-
Confirm and save the configuration.
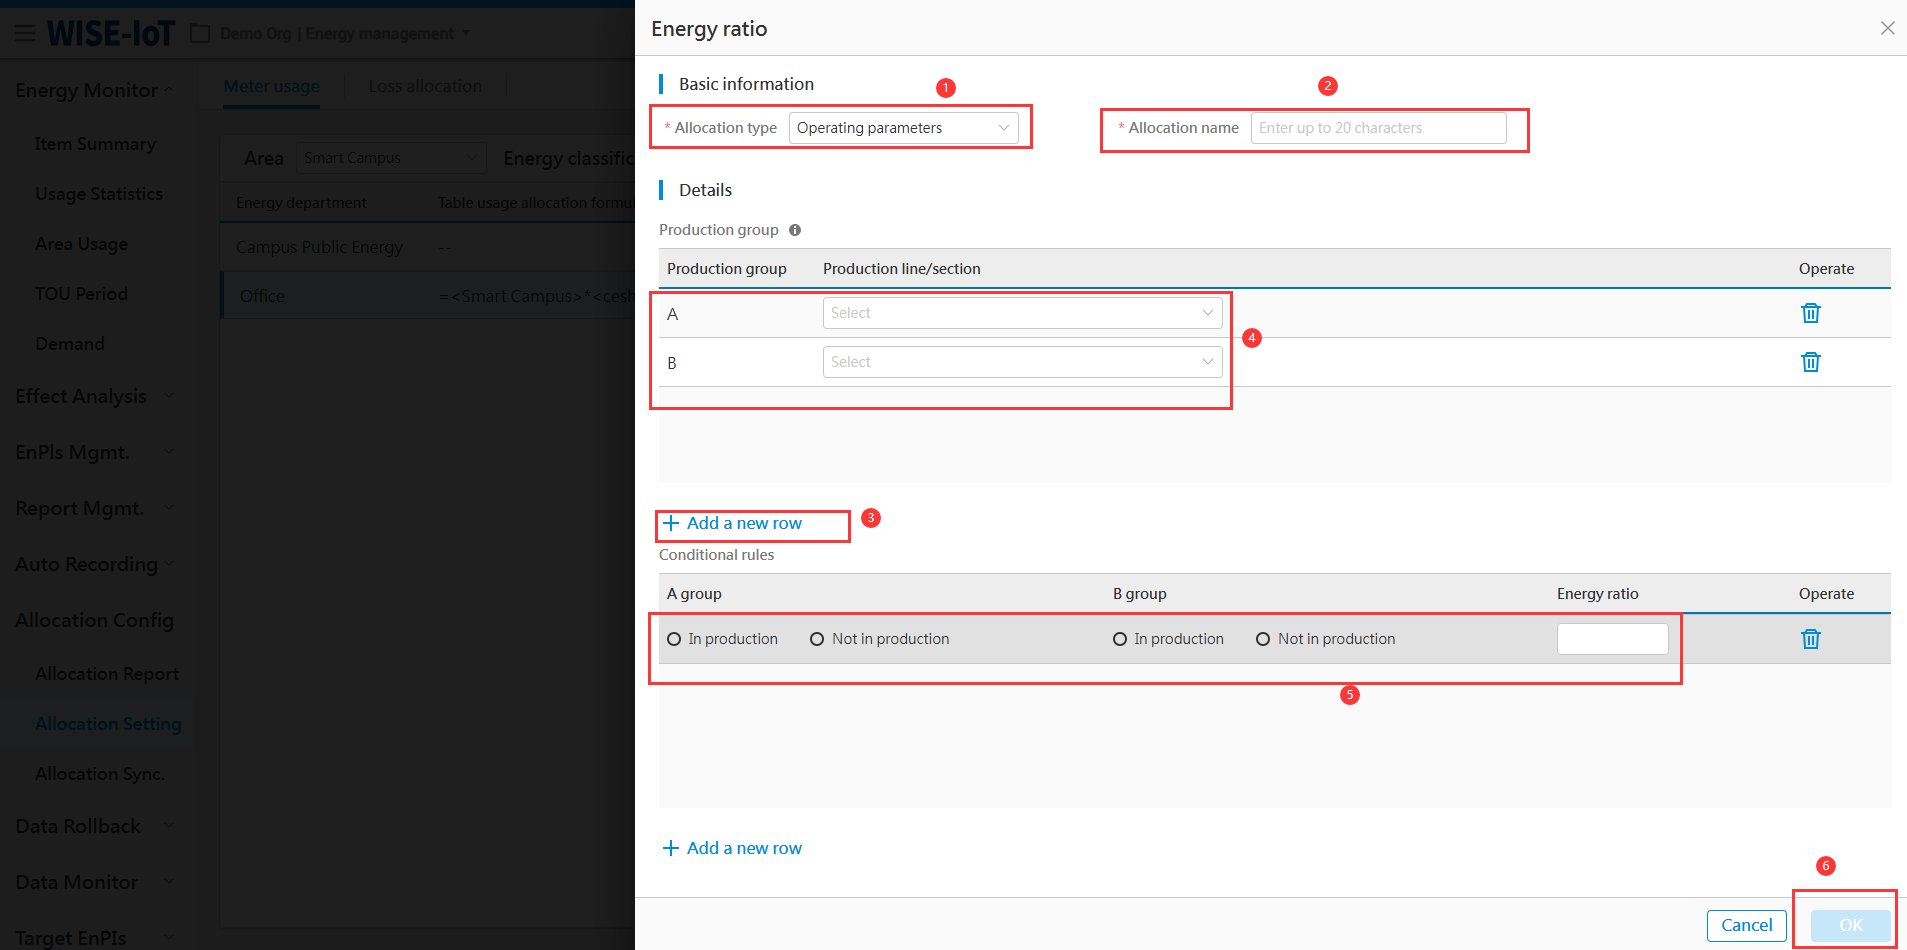
Operating parameters
Application scenarios of the share of operating parameters
Usage can be allocated based on production status (e.g.in production, idle) when device is not directly involved in manufacturing and lacks auxiliary meters.
Steps:
Configure energy ratio settings for production conditions as below.
-
Select the type;
-
Enter a unique name;
-
Click "Add a Row" to generate a configuration group in the "Production Group" list;
-
Select production lines or sections corresponding to the production group;
-
Enumerate the energy ratio for the department under each combination of production statuses;
-
Click "Ok" to save the settings.
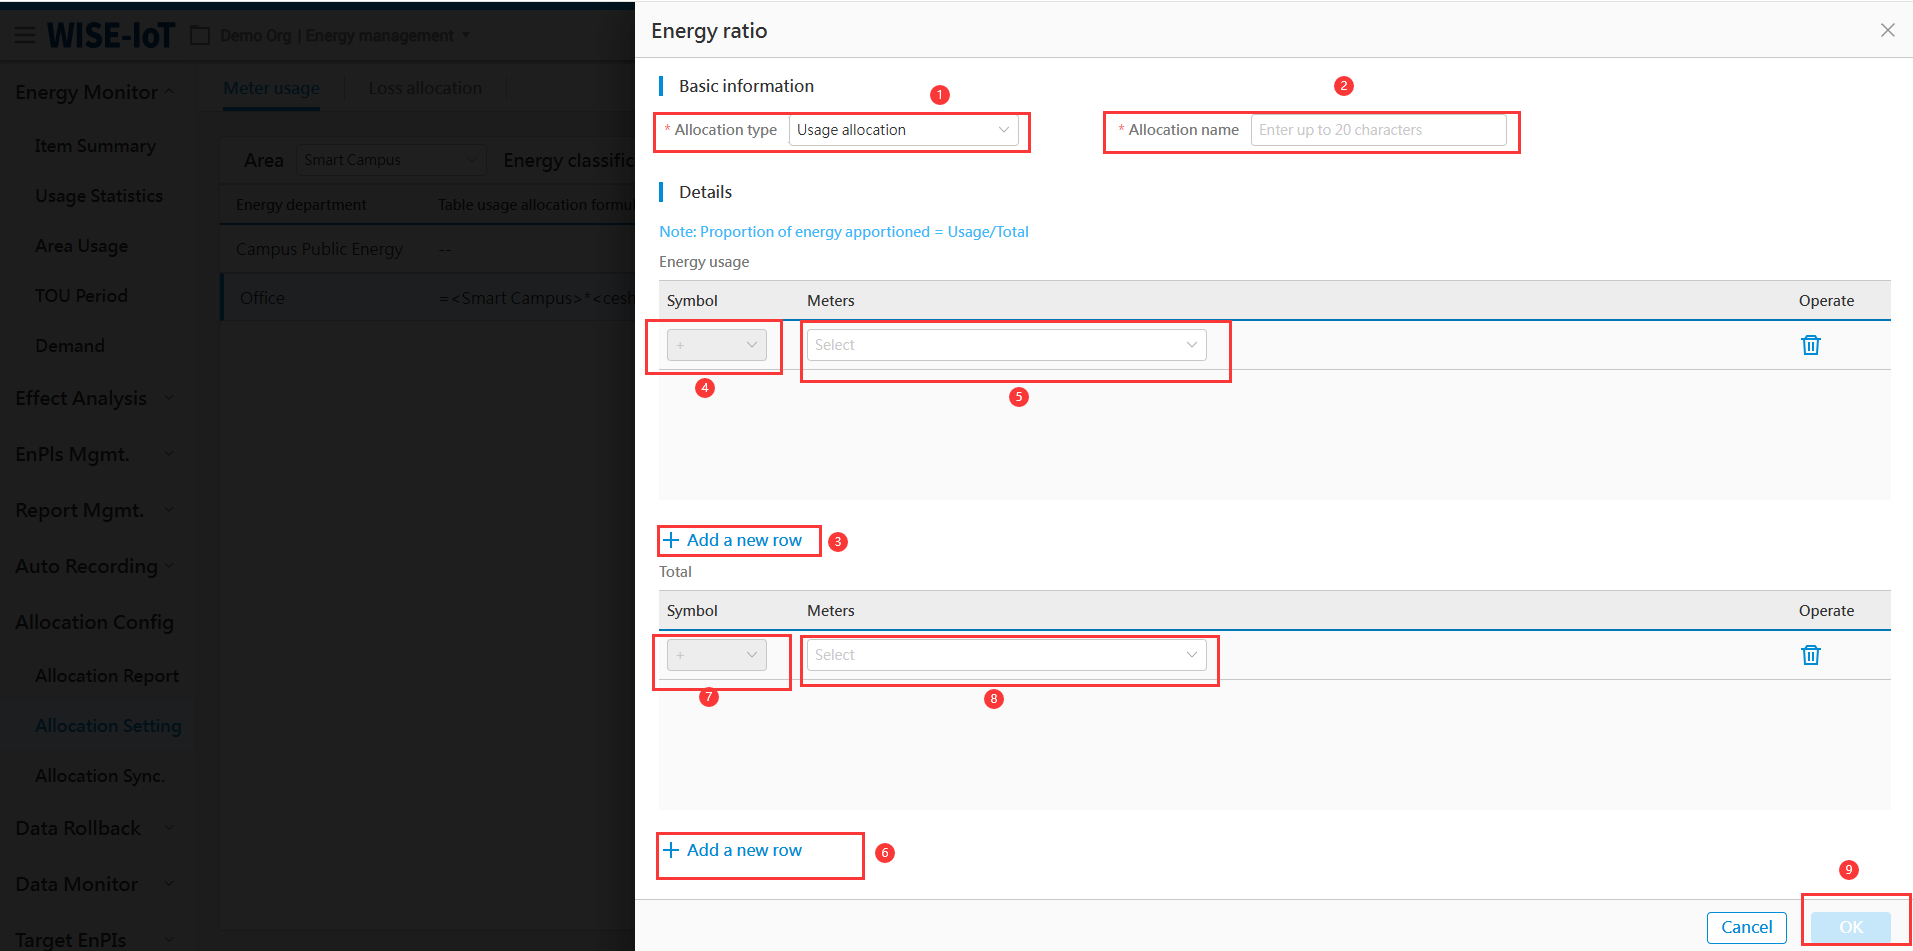
Usage Allocation
The Application scenarios of usage allocation ratio
-
Devices can utilize meters for usage allocation, e.g., air compressors and refrigeration units may employ flow meters to allocate usage;
-
Devices' water usage can be allocated based on usage ratios observed during production.
Steps:
Configure energy ratio settings for energy usage allocation as below.
-
Select the type;
-
Set the allocation name;
-
Add a new set of usage;
-
Choose the usage calculation method;
-
Select usage meters;
-
Add a new set of total usage;
-
Choose calculation method for total usage;
-
Select meters for total usage;
-
Click "Ok" to save the settings.
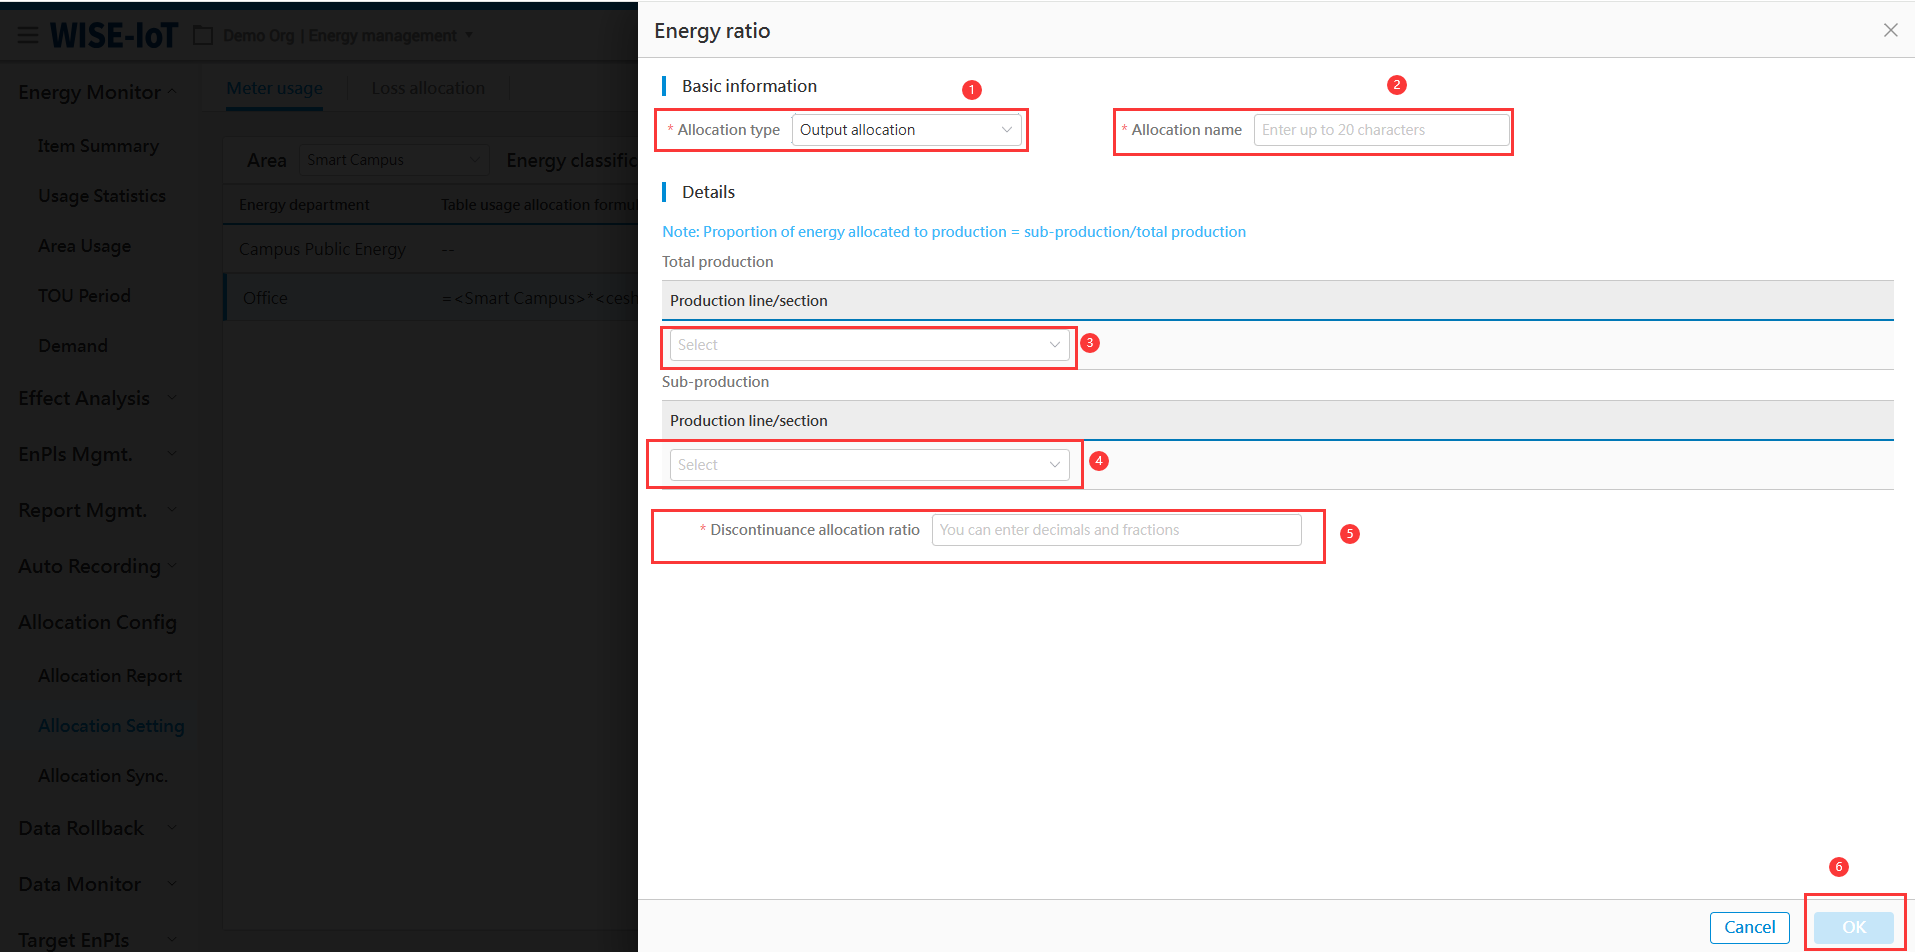
Outpu Allocation
Application scenarios of output-based energy usage allocation ratios:
- When devices' energy usage can be directly allocated based on its output.
Steps:
Configure output-based energy usage allocation ratios as below:
-
Select type
-
Set a unique name
-
Choose production lines/sections for total output (multi-select enabled)
-
Choose production lines/sections for itemized output (multi-select enabled)
-
The fixed allocation ratio for baseline power usage during downtime.
-
Click "Ok" to save the settings.
Data Rollback
Modifying historical data requires recalculating energy usage statistics for the business node using the data rollback function.
Click Data Rollback to go to the Data Rollback Function page. The data rollback function includes usage rollback and allocation rollback.
Usage Rollback
To recalculate the usage at conventionally configured meter nodes, the usage rollback function can be utilized. (Note: This applies exclusively to metered usage rollback. Executing usage rollback will automatically trigger the usage rollback at topological node.)
On the Usage Rollback List interface, all rollback tasks can be queried.
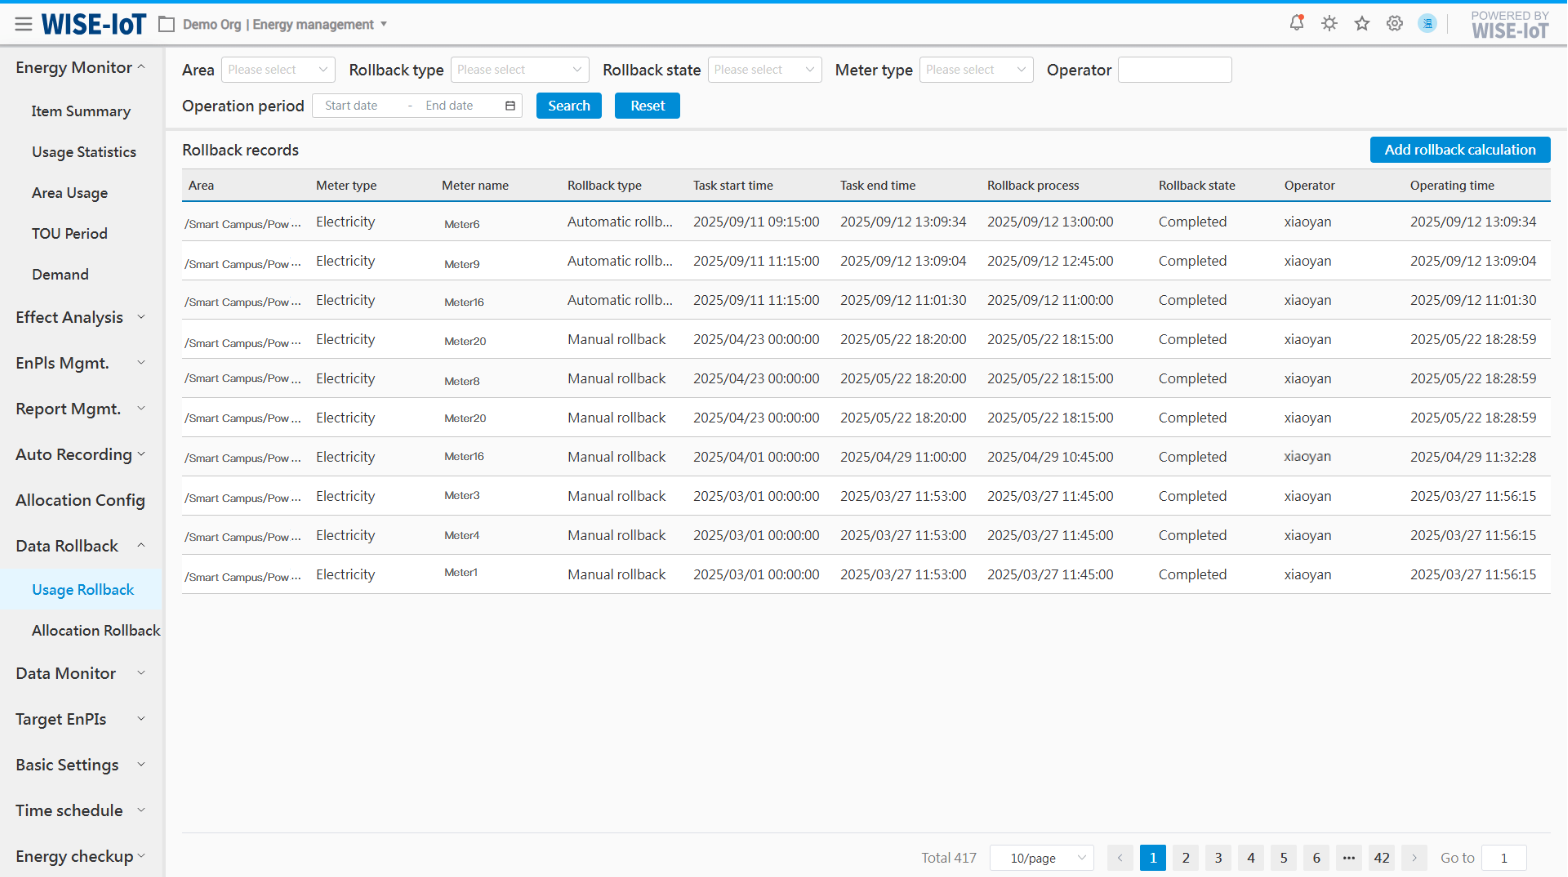
To initiate a new rollback calculation, click "Add Rollback Calculation" to access the Rollback Configuration page.
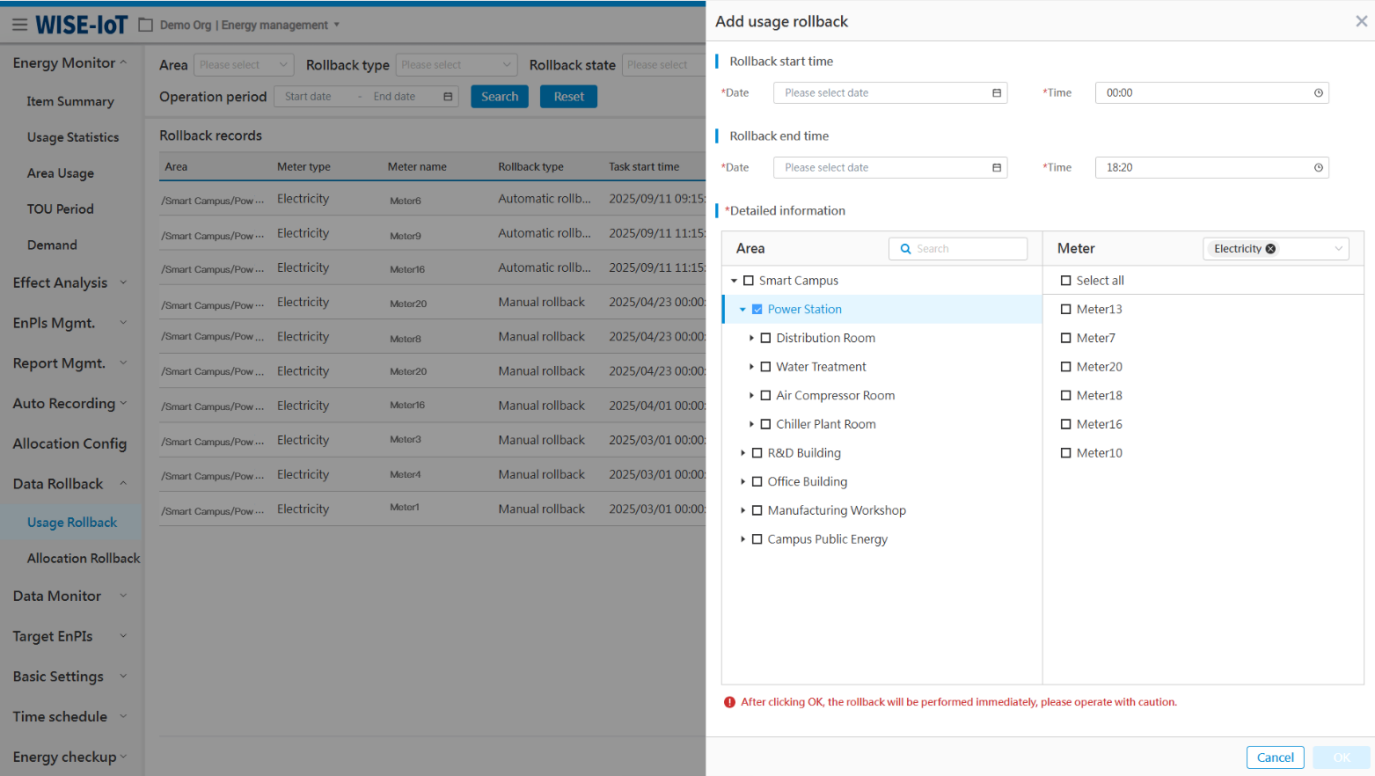
(1) Select Rollback Start Time and End Time.
(2) Choose the meters subject to rollback.
Click "Ok" to trigger immediate recalculation of metered usage.
Allocated Rollback
The accuracy of allocated energy usage of the energy department relies entirely on the correct calculation of all area nodes and metered usage. Otherwise, even if allocated usage is rolled back, the result will remain erroneous. Therefore, please make sure both area usage and metered usage are correct before rolling back allocated usage.
On the Allocated Usage Rollback Task List interface, all rollback tasks can be queried. Area here refers to nodes of the asset group in APM whose static attribute custom_info is configured as "node_type: factory".
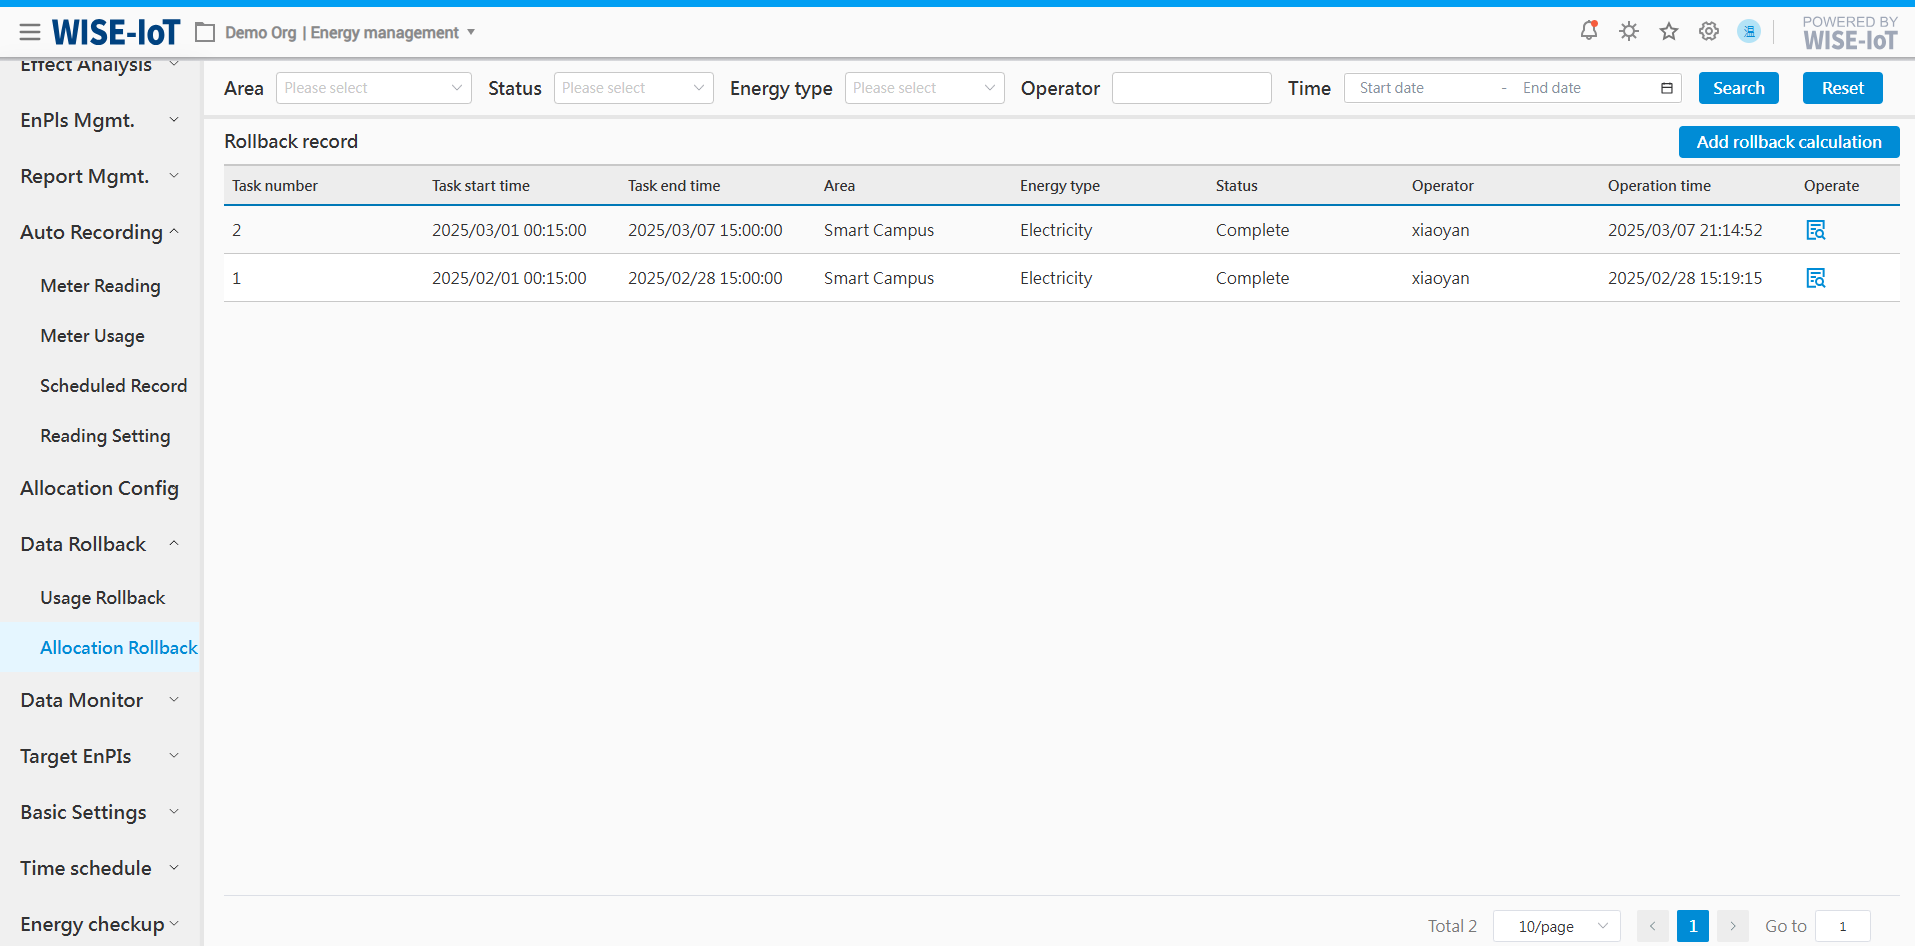
To initiate a new rollback calculation, click "Add a Rollback Calculation" to access the Rollback Configuration page.
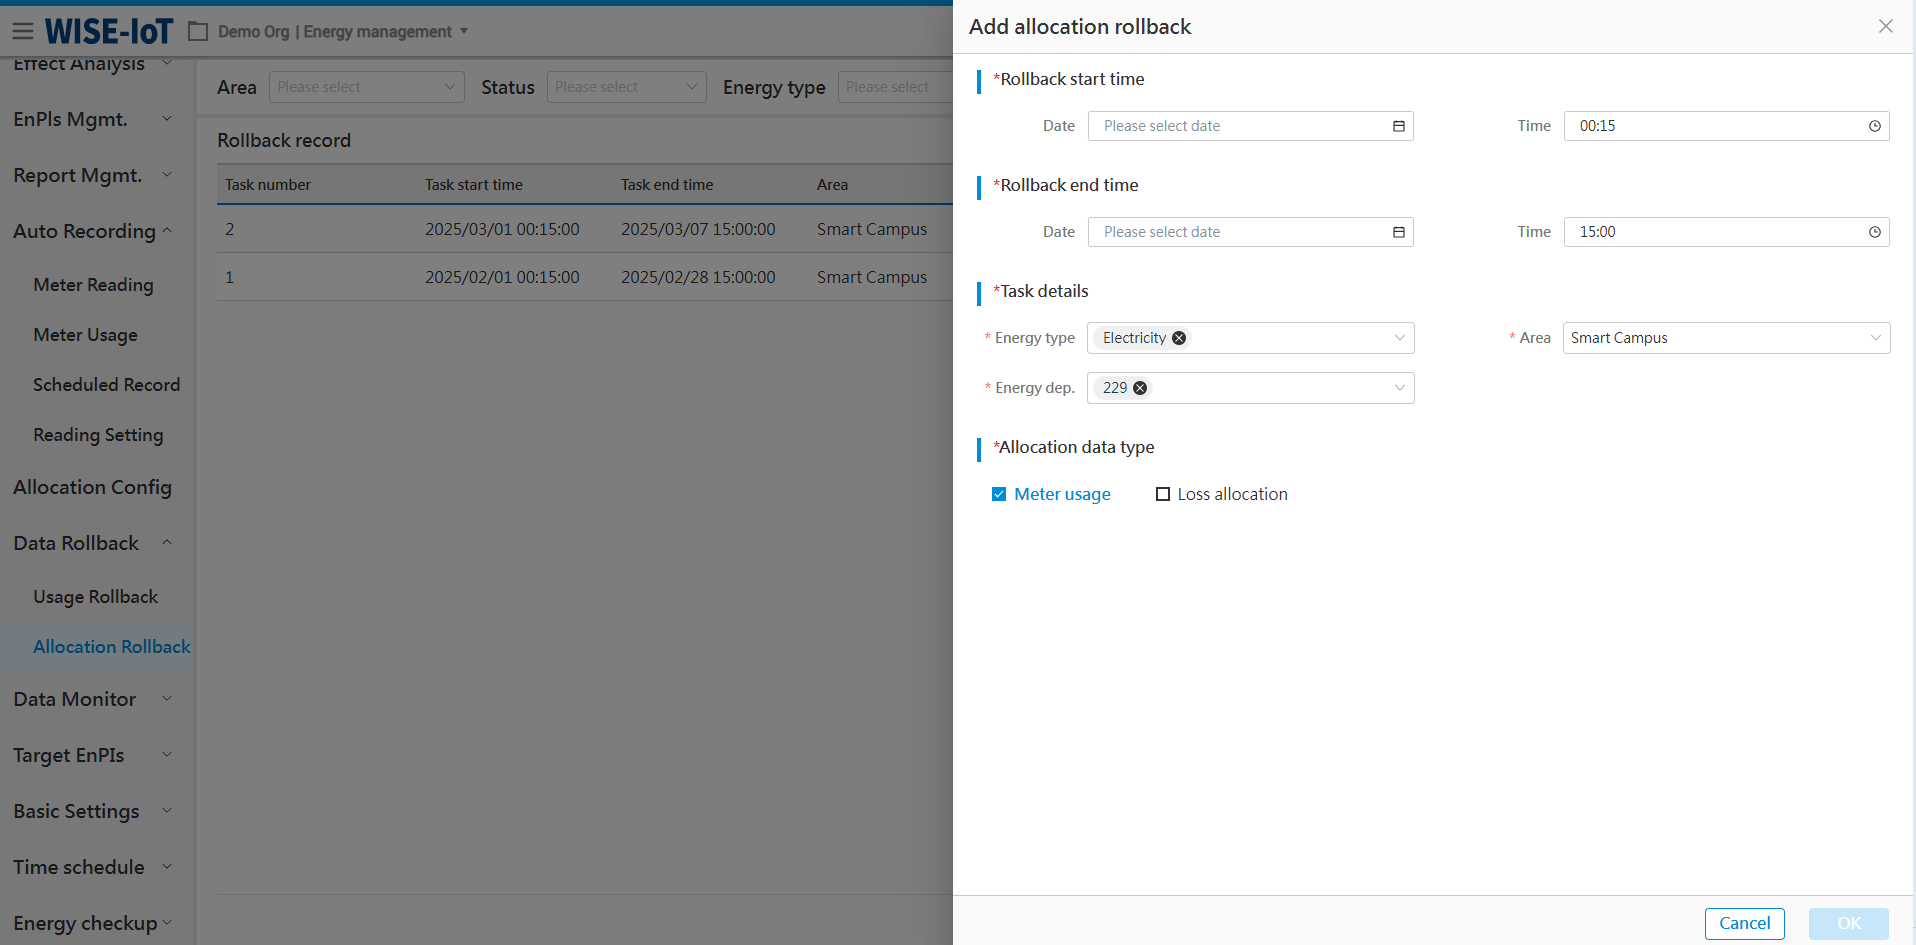
(1) Select Rollback Start Time and Rollback End Time;
(2) Choose the energy type, area, and energy department;
(3) Metered usage and loss allocation options: Please select based on the actual modifications made. If only metered usage is modified, select metered usage; if the loss allocation formula is modified, select loss allocation. If both modifications apply, select both "Meter Readings" and "Loss Allocation".
Click "Ok" to execute the allocation usage rollback calculation.
Data Monitor
Meter Monitor
Click Data Monitor > Meter Monitor to access the Meter Monitoring Module.
The module provides real-time monitoring of edge devices such as electricity/water meters, tracking device counts per status and recording the latest upload timestamps and readings from critical nodes, as shown below.
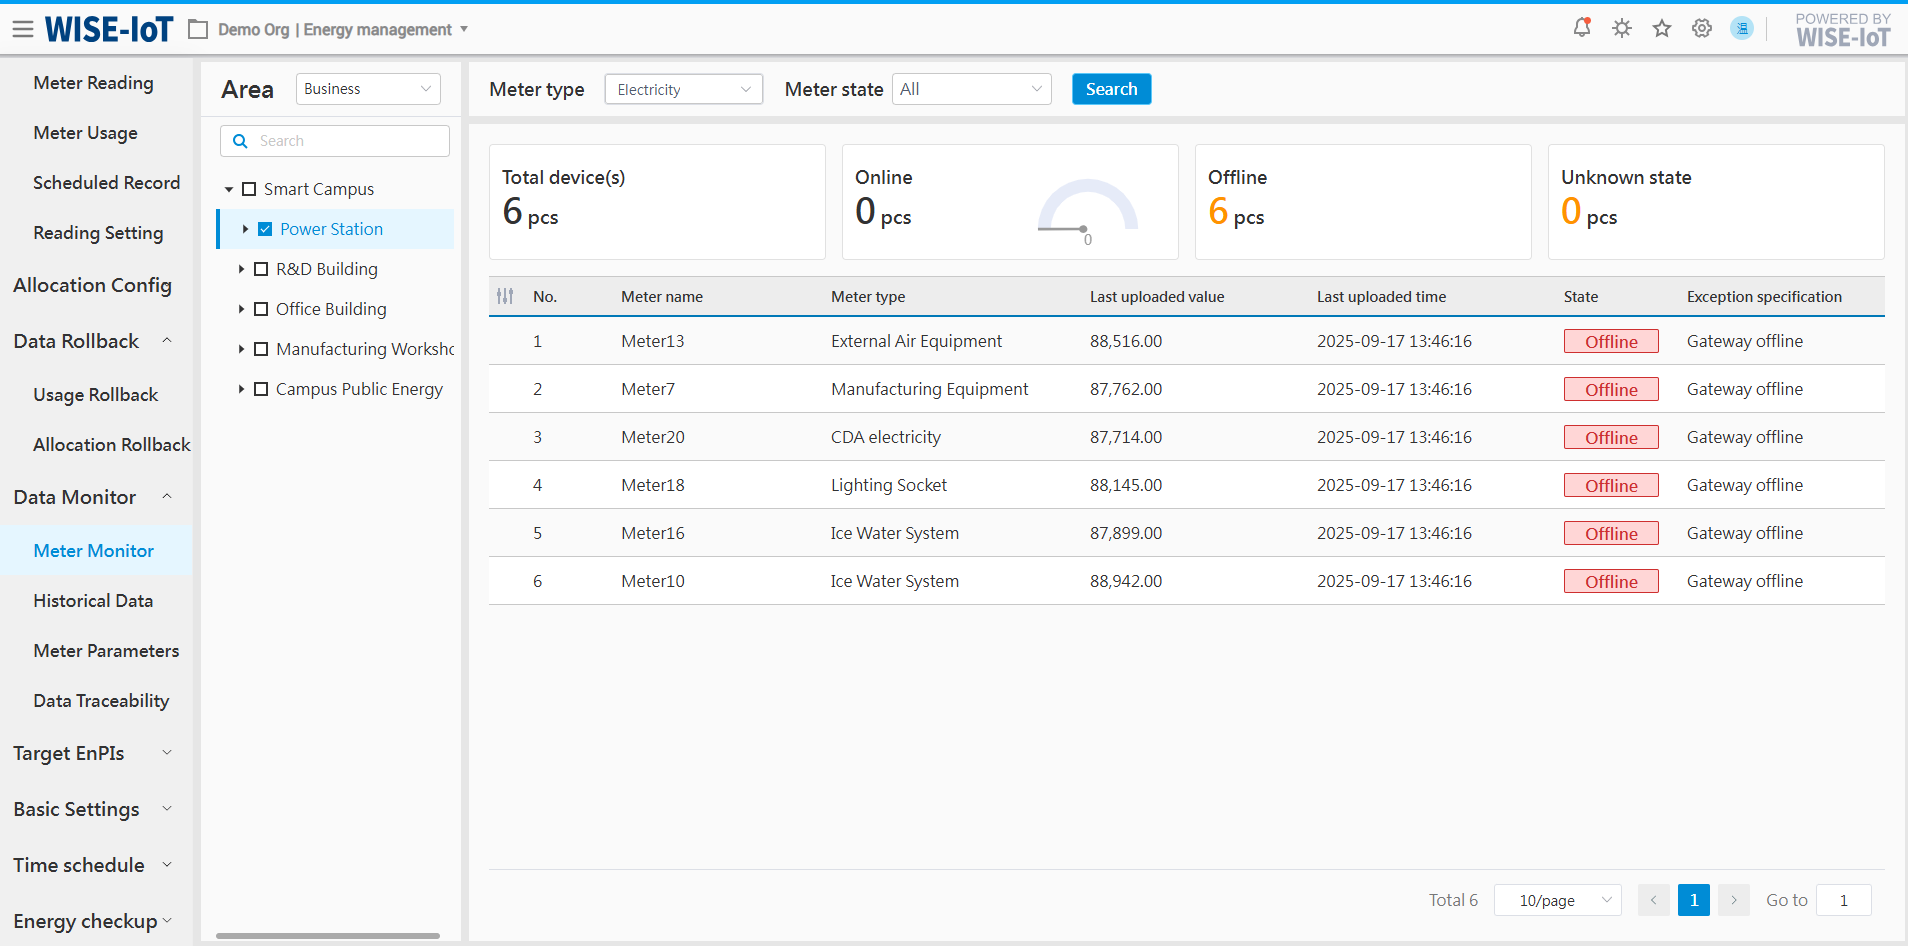
- Statistical section
The system, based on the filtering criteria and the number of meters in each area of the APM business asset group, compile statistics on the total number of devices and the quantities of online, offline, and unknown devices in the area.
- Status section
Meters have 3 status states: Online, offline and unknown. "Unknown" indicates the status of the meter is unknown. For meters in Unknown status, the system provides an anomaly description to guide relevant configuration within the APM platform.
(1) Missing Connection_Status tag: This indicates that the Connection_Status tag is absent in the meter's APM edge input component.
(2) Missing COMM tag: This indicates that the COMM tag is absent in the meter's APM edge input component.
- Area section
In the Area section, three options are available: business topological structure, meter topological structure, and meter reading region. Specifically, when selecting meter topological structure, the meter asset group in APM must have its type set to "meter" and the project set to ECOWatch.
Historical Data Query
Click Data Monitor > Historical Data Query.
The Historical Data Query interface allows users to retrieve and statistically analyze data from specified time ranges by selecting regions, devices, and parameter options, then presents the results as trend curves in charts, as illustrated below.
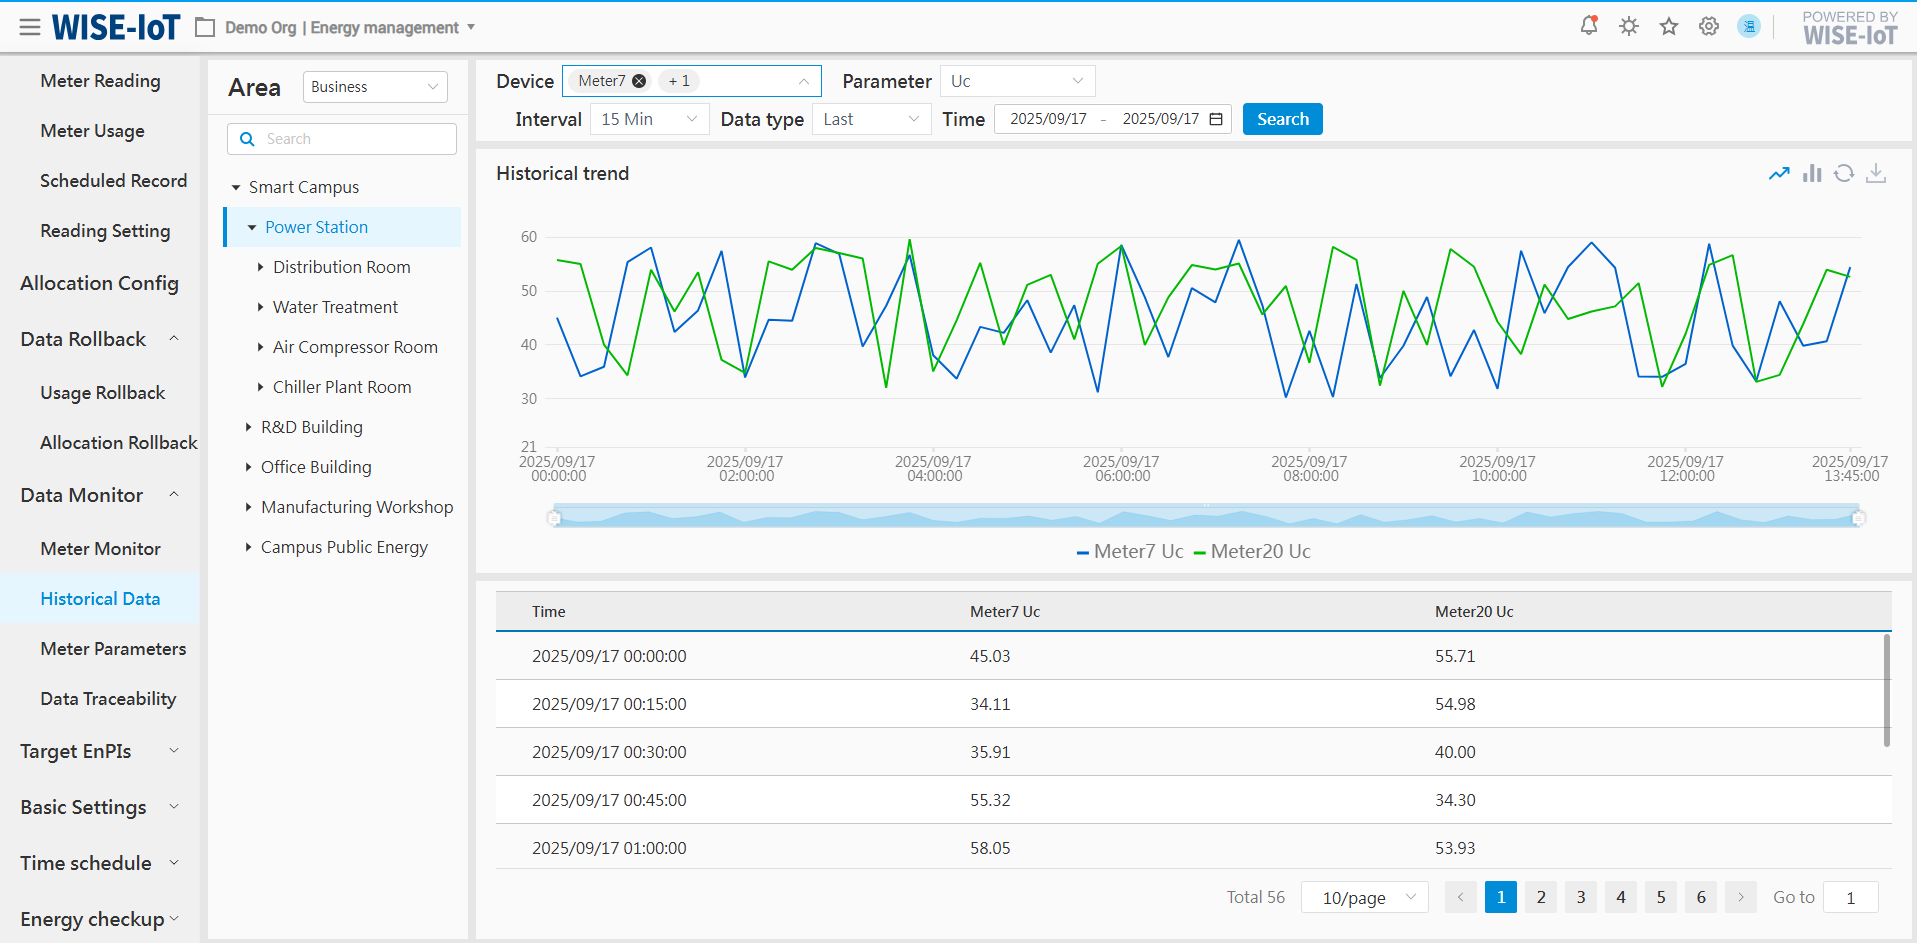
- Area section
In the Area section, three options are available: business topological structure, meter topological structure, and meter reading region. Specifically, meter topological structure is selected, the meter asset group in APM must have its type set to "meter" and the project set to ECOWatch.
- Filter section
(1) Support device and parameter selection;
(2) Support selection of different time intervals and time ranges;
- Graph section
(1) Support presentation of parameter information at varying data granularities, including yearly, monthly, daily, hourly, per-minute, 5-minute intervals, and raw values.
(2) Display parameter information from multiple devices simultaneously;
(3) Click "![]() " to export the selected dataset in Excel.
" to export the selected dataset in Excel.
- Table section
The system displays historical parameter data for selected devices during the specified time period.
Meter Parameters
Click Data Monitor > Meter Parameters.
The Real-time Meter Parameters module displays real-time data for all meters of enterprises or factories, with the interface automatically refreshing to reflect dynamic data changes.
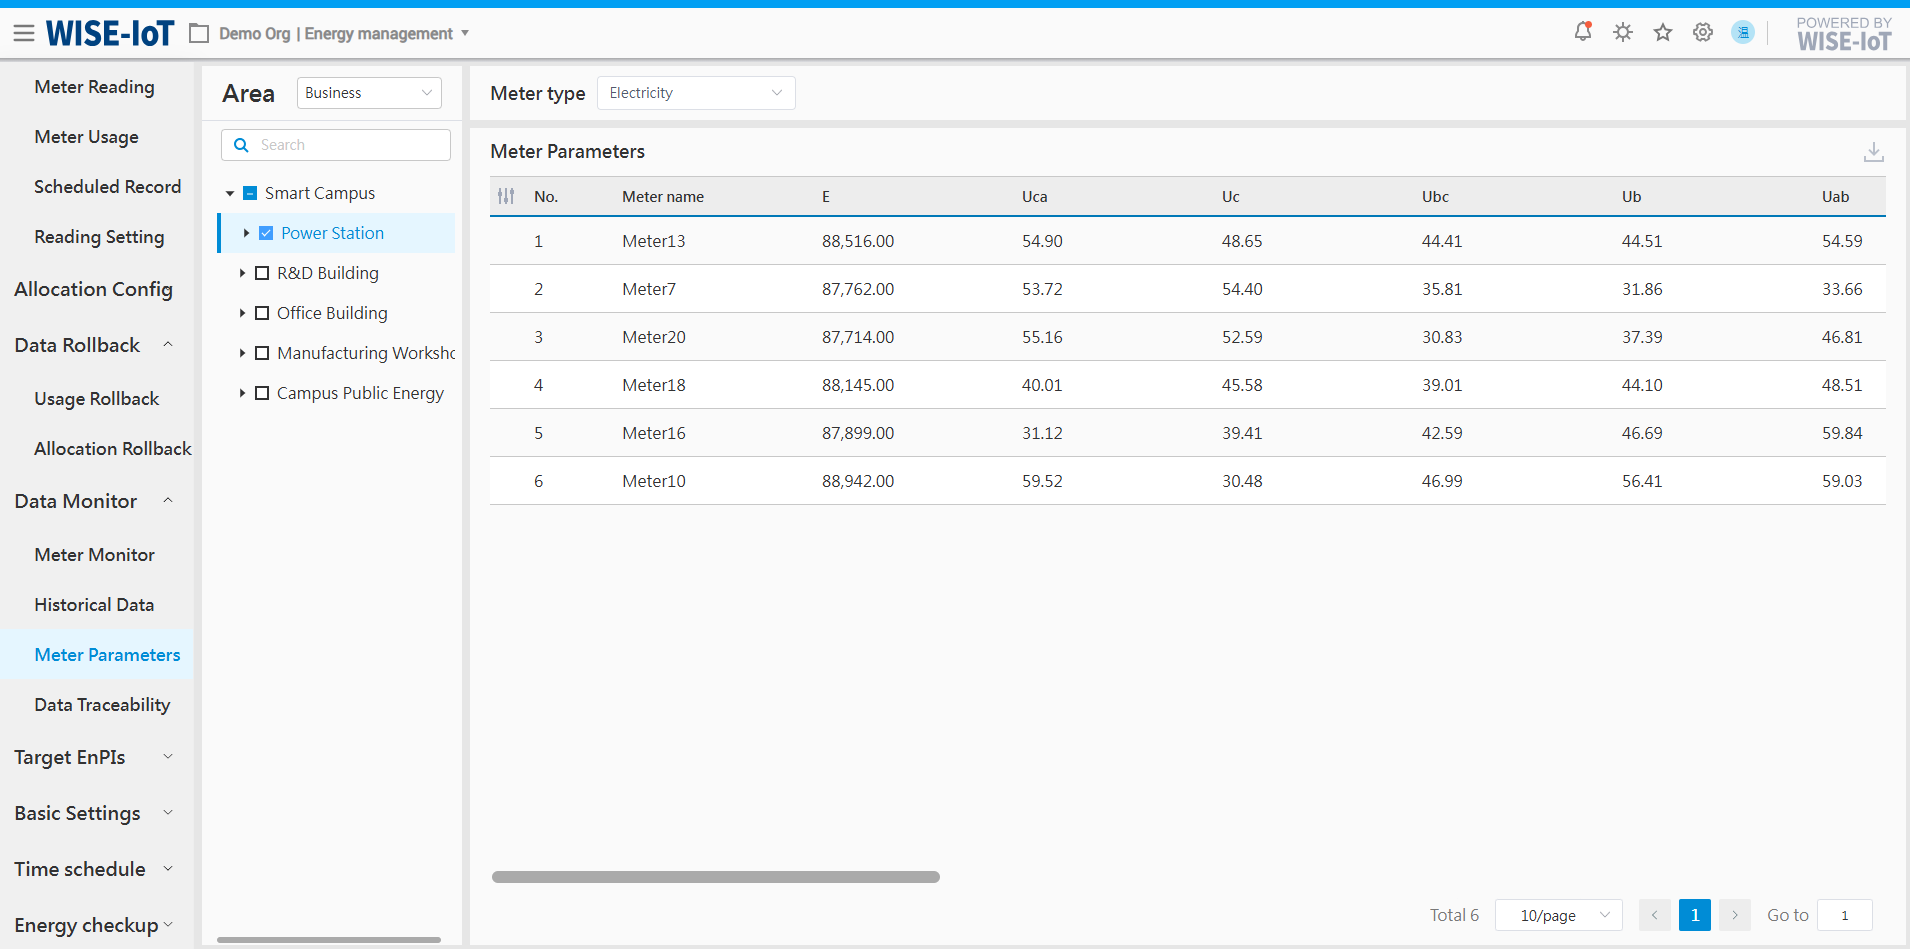
-
Area selection: Click the dropdown box on the right to select areas by business structure, meter topological structure, or meter reading area. When meter topological structure is selected, the meter asset group in APM must have its type set to "meter" and the project set to ECOWatch.
When an area is selected in the [area] section, the table displays parameter information of the meter types associated with the selected area. Once the edge tag parameters change, the area energy usage interface will update in real time accordingly. -
Click Energy Type at the top to switch among energy types such as water, natural gas, heat, compressed air, etc. in the dropdown box.
-
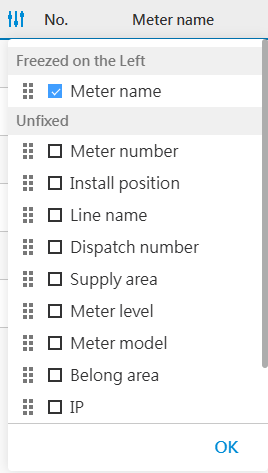
The table displays basic meter properties by default (meter name, meter description). Click
 on the left to reselect basic meter properties for display.
Data Traceability
Click Data Monitor > Data Traceability to go to the Energy Usage Tracing module.
Due to meter reading modifications, allocation formula adjustments and meter anomalies, the system cannot perform real-time computations. This may result in abnormal energy usage for specific energy department. Users can efficiently identify the source of area energy statistics to verify potential discrepancies through data traceability.
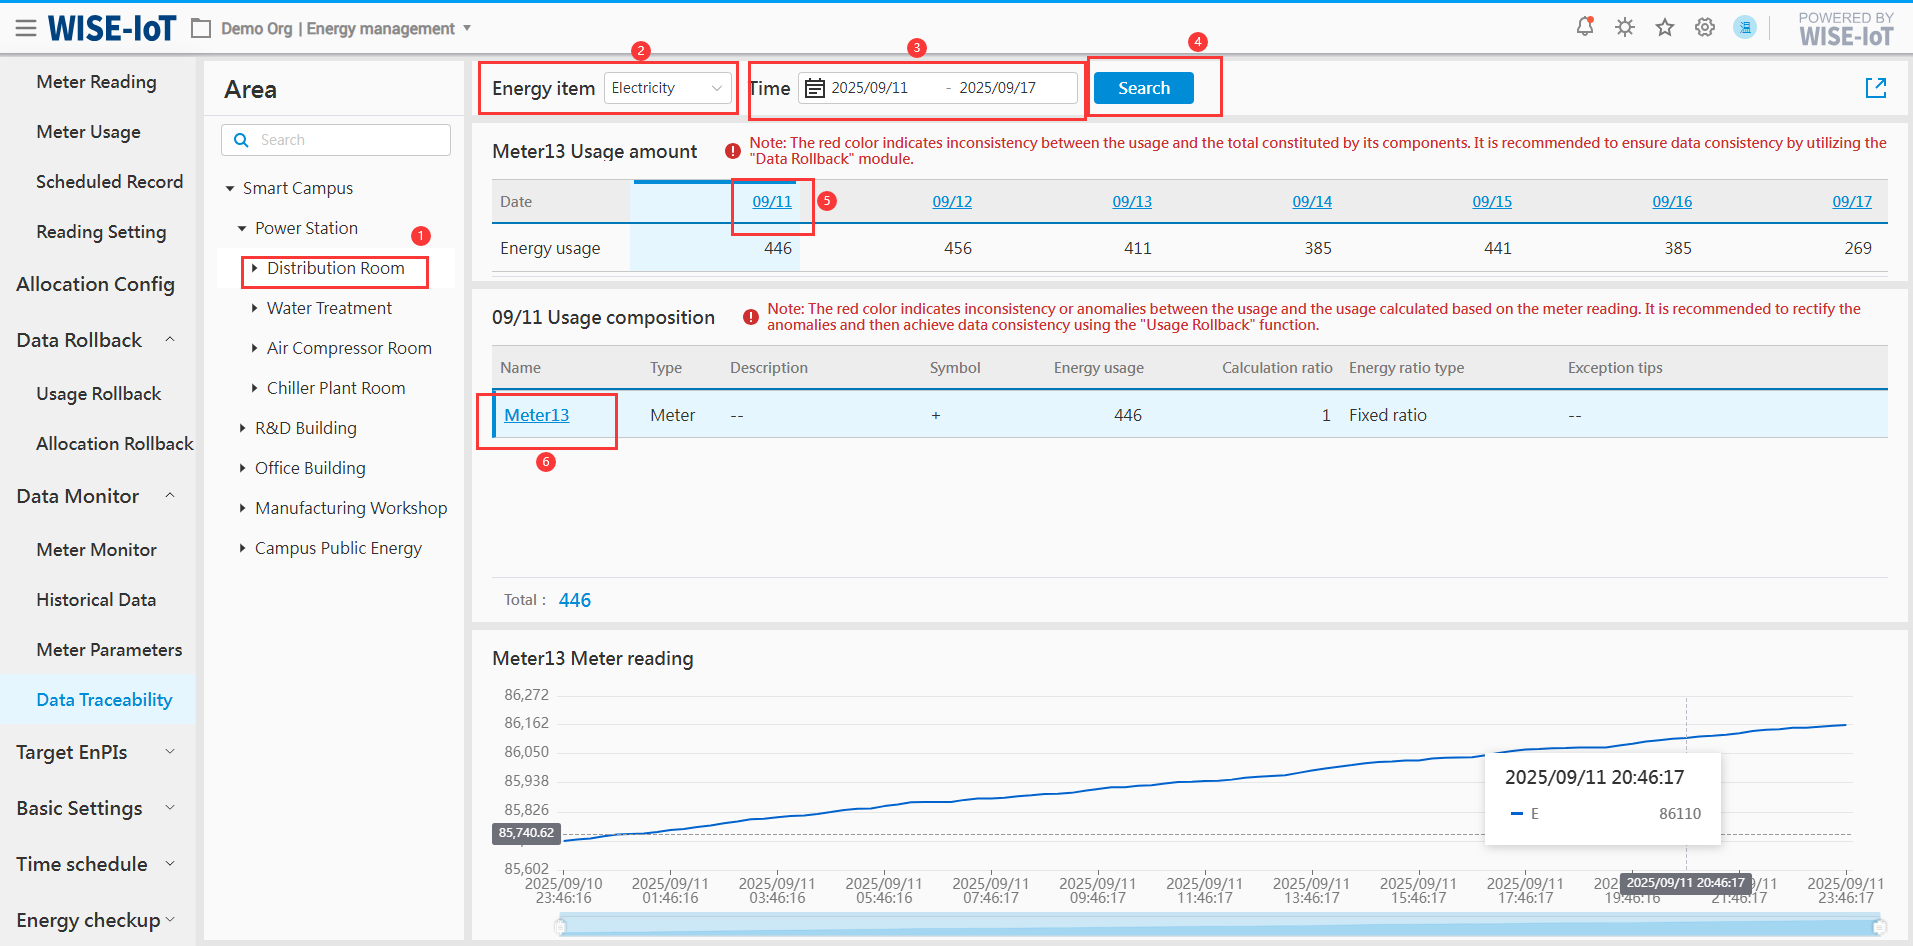
Please follow the steps below:
-
Click the area or meter to be queried;
-
Select the energy type;
-
Select the time period;
-
Click Query;
-
Click the usage date;
-
Click the meter name.
Steps ①, ②, and ③ in the figure represent energy data filtering criteria. The time range defaults to one week, with a maximum selection of 31 days, and future time periods cannot be chosen.
Clicking ⑤ allows users to view which meters and their calculation proportions constitute the energy consumption data for the selected date. It compares the stored calculation results in the system with those obtained from real-time calculation to check for discrepancies. If discrepancies are detected, data rollback can be performed to recalculate the energy usage.
Clicking ⑥ to verify discrepancies between metered usage and meter readings. If discrepancies are found, a data rollback can be initiated to recalculate the metered usage.
Target EnPIs
Target EnPIs are used to formulate enterprise energy management performance KPIs, including energy usage, usage-to-output ratio, usage per capita, usage-to-output value ratio, and usage per unit area.
Planned indicator formulation include establishing usage indicators, target demand indicators, and energy cost indicators.
EnB(Energy Baseline) Algorithm
The ECOWatch energy baseline algorithm employs regression analysis method. Before establishing an energy baseline for a specific organization or an area, it is necessary to collect relevant factors that may influence the set energy performance indicators, conduct linear regression, and then generate the energy baseline for the corresponding area based on the energy baseline formula. The overall process is as follows:
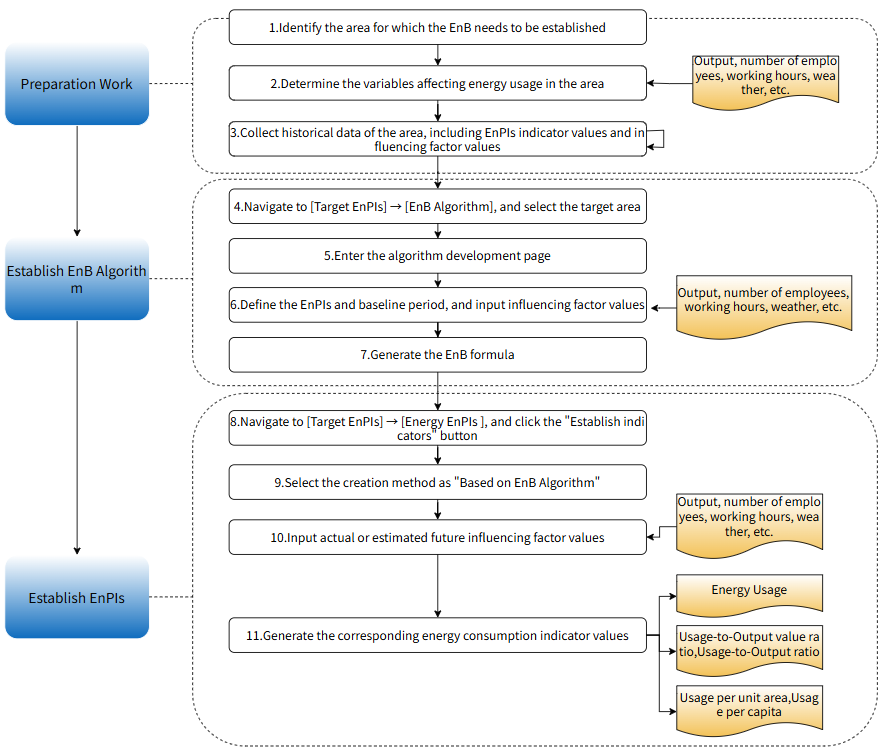
Click Target EnPIs > EnB Algorithm to access the Baseline Algorithm Configuration page.
The first page is empty. Click "New" to configure the baseline algorithm for the selected area. Then the system displays the algorithm list associated with the area chosen on the left, sorted in descending order of update time by default:
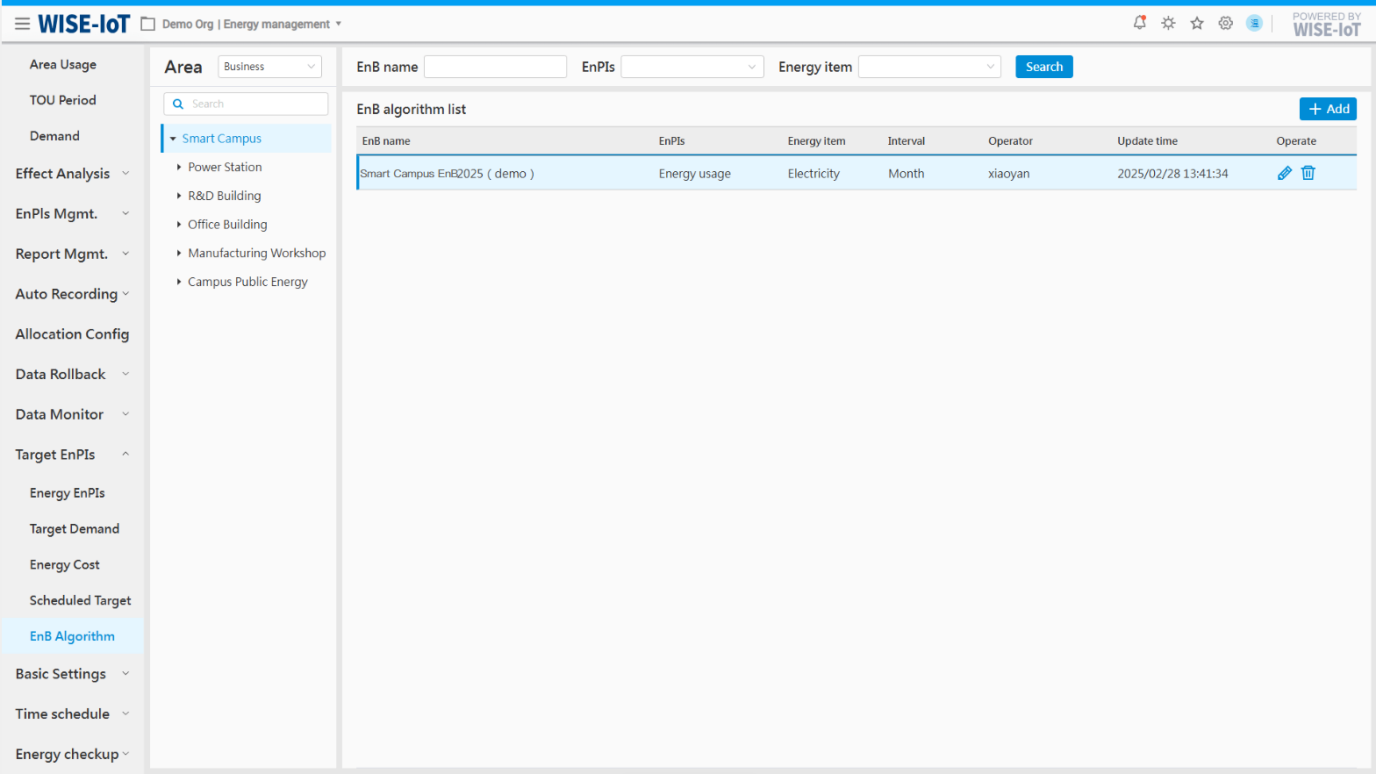
On the list page, the system:
-
Provides fuzzy search for baseline names, as well as filtering by baseline indicators and energy items;
-
Support editing and deletion of baseline algorithms
Baseline Algorithm Formulation
Click "New" in the list to access the Performance Algorithm Formulation page. Formulation content and procedures are as follows:
+----------------------------------------------------------+-----------------------------------------------------------------------------------------------------------------------------------------------------------------------------------------------------+
| 1. Basic settings |
+----------------------------------------------------------+-----------------------------------------------------------------------------------------------------------------------------------------------------------------------------------------------------+
| (1) Basic information: | Enter the baseline name, and select baseline indicators, energy items, time interval, time period, etc. |
+----------------------------------------------------------+-----------------------------------------------------------------------------------------------------------------------------------------------------------------------------------------------------+
| (2) Select influencing factors for baseline indicators | The system includes preconfigured influencing factors such as output value, output, area, headcount, and energy usage. |
| | |
| | And then select influencing factors associated with performance indicators. |
+----------------------------------------------------------+-----------------------------------------------------------------------------------------------------------------------------------------------------------------------------------------------------+
| After completing the above operations, click "Next step". |
+----------------------------------------------------------------------------------------------------------------------------------------------------------------------------------------------------------------------------------------------------------------+
| 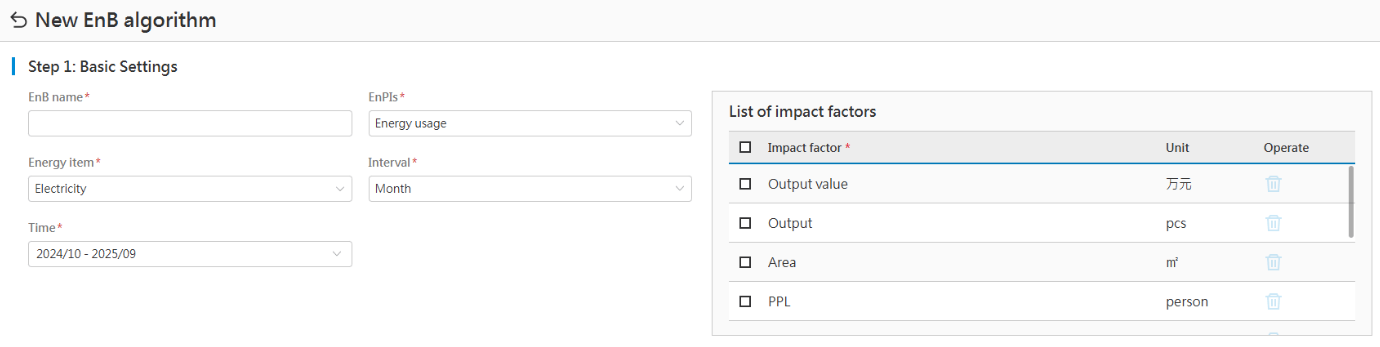 |
+----------------------------------------------------------------------------------------------------------------------------------------------------------------------------------------------------------------------------------------------------------------+
| 2. Input influencing factor values and algorithm-specific judgment conditions |
+----------------------------------------------------------+-----------------------------------------------------------------------------------------------------------------------------------------------------------------------------------------------------+
| (1) Data list | There are two ways to fill in the data: |
| | |
| | 1) Manually enter performance indicator values and influencing factor values for the selected date. |
| | |
| | 2) The system provides an Excel template for importing influencing factors. Click "Import" to populate and import the Excel template. |
| | |
| | 3) It is recommended to maintain a minimum of 12 data records. Algorithm performance and energy baseline formula accuracy improve with increased data volume |
| | |
| | Note: Don't allow empty cells in Excel. |
+----------------------------------------------------------+-----------------------------------------------------------------------------------------------------------------------------------------------------------------------------------------------------+
| (2) Judgment conditions | 1) These are the evaluation indicators for the baseline algorithm. The system provides standard evaluation indicators, and users can set them according to the requirements of energy consultants. |
| | |
| | 2) If the selected indicator does not require reference to the P-value, users can click the switch button to the left of the P value to disable the judgment. |
+----------------------------------------------------------+-----------------------------------------------------------------------------------------------------------------------------------------------------------------------------------------------------+
| After completing the above operations, click "Next". |
+----------------------------------------------------------------------------------------------------------------------------------------------------------------------------------------------------------------------------------------------------------------+
|
|
+----------------------------------------------------------------------------------------------------------------------------------------------------------------------------------------------------------------------------------------------------------------+
| 2. Input influencing factor values and algorithm-specific judgment conditions |
+----------------------------------------------------------+-----------------------------------------------------------------------------------------------------------------------------------------------------------------------------------------------------+
| (1) Data list | There are two ways to fill in the data: |
| | |
| | 1) Manually enter performance indicator values and influencing factor values for the selected date. |
| | |
| | 2) The system provides an Excel template for importing influencing factors. Click "Import" to populate and import the Excel template. |
| | |
| | 3) It is recommended to maintain a minimum of 12 data records. Algorithm performance and energy baseline formula accuracy improve with increased data volume |
| | |
| | Note: Don't allow empty cells in Excel. |
+----------------------------------------------------------+-----------------------------------------------------------------------------------------------------------------------------------------------------------------------------------------------------+
| (2) Judgment conditions | 1) These are the evaluation indicators for the baseline algorithm. The system provides standard evaluation indicators, and users can set them according to the requirements of energy consultants. |
| | |
| | 2) If the selected indicator does not require reference to the P-value, users can click the switch button to the left of the P value to disable the judgment. |
+----------------------------------------------------------+-----------------------------------------------------------------------------------------------------------------------------------------------------------------------------------------------------+
| After completing the above operations, click "Next". |
+----------------------------------------------------------------------------------------------------------------------------------------------------------------------------------------------------------------------------------------------------------------+
| 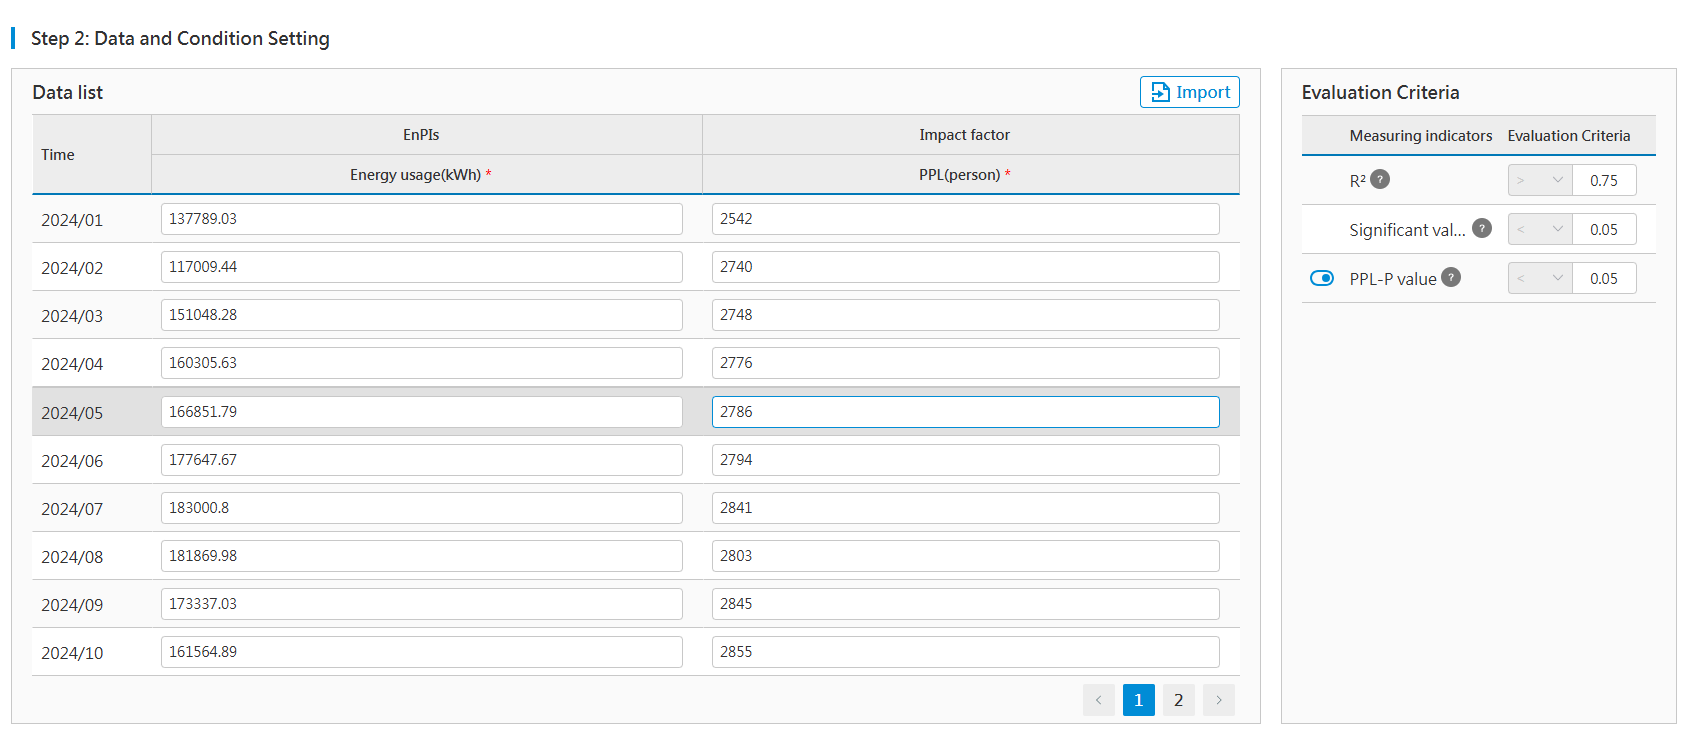 |
+----------------------------------------------------------------------------------------------------------------------------------------------------------------------------------------------------------------------------------------------------------------+
| Step 3: Algorithm analysis results and baseline formula |
+----------------------------------------------------------+-----------------------------------------------------------------------------------------------------------------------------------------------------------------------------------------------------+
| Algorithmic results | Based on the data input from Step 2, the system calculates evaluation indicator values for the algorithm and applies evaluation criteria to generate evaluation results. |
| | |
| | When results are classified as "poor" or "unreliable", the system will not save the results. |
+----------------------------------------------------------+-----------------------------------------------------------------------------------------------------------------------------------------------------------------------------------------------------+
| Algorithm formula | For display purpose. |
+----------------------------------------------------------+-----------------------------------------------------------------------------------------------------------------------------------------------------------------------------------------------------+
| In this step, the algorithm structure is rated as "Excellent" and "Reliable". Click "OK" to save the algorithm. |
+----------------------------------------------------------------------------------------------------------------------------------------------------------------------------------------------------------------------------------------------------------------+
|
|
+----------------------------------------------------------------------------------------------------------------------------------------------------------------------------------------------------------------------------------------------------------------+
| Step 3: Algorithm analysis results and baseline formula |
+----------------------------------------------------------+-----------------------------------------------------------------------------------------------------------------------------------------------------------------------------------------------------+
| Algorithmic results | Based on the data input from Step 2, the system calculates evaluation indicator values for the algorithm and applies evaluation criteria to generate evaluation results. |
| | |
| | When results are classified as "poor" or "unreliable", the system will not save the results. |
+----------------------------------------------------------+-----------------------------------------------------------------------------------------------------------------------------------------------------------------------------------------------------+
| Algorithm formula | For display purpose. |
+----------------------------------------------------------+-----------------------------------------------------------------------------------------------------------------------------------------------------------------------------------------------------+
| In this step, the algorithm structure is rated as "Excellent" and "Reliable". Click "OK" to save the algorithm. |
+----------------------------------------------------------------------------------------------------------------------------------------------------------------------------------------------------------------------------------------------------------------+
| 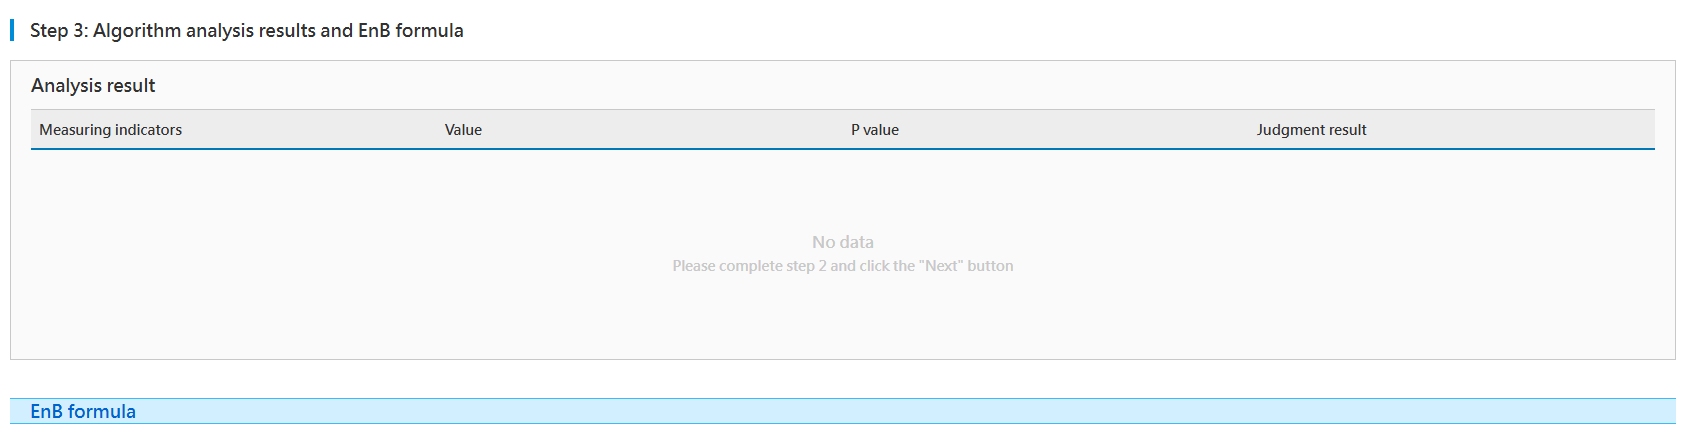 |
+----------------------------------------------------------------------------------------------------------------------------------------------------------------------------------------------------------------------------------------------------------------+
|
+----------------------------------------------------------------------------------------------------------------------------------------------------------------------------------------------------------------------------------------------------------------+
Edit Baseline Algorithms
Select an algorithm in the Baseline Algorithm list, click "![]() " to edit the baseline algorithm. On the editing page:
" to edit the baseline algorithm. On the editing page:
-
The energy baseline name is non-editable;
-
Follow the procedures for "Baseline Algorithm Formulation" to generate the energy baseline formula.
Delete Baseline Algorithms
Select an algorithm in the Baseline Algorithm list, click "![]() " to remove the corresponding algorithm information.
" to remove the corresponding algorithm information.
Energy EnPIs
Overview
Understanding Data Sources
The Energy Usage Indicator page involves output, output value, area, headcount, and historical energy usage, which are elaborated below:
- Output value/output:
There are two ways to obtain ECOWatch's output value and output.
-
In ECOWatch > Basic Settings > Data Entry Mgmt. > Output Value and Output Information module, enter daily output value and output.
-
Via third-party MES system.
*The system first retrieves data from the input module. If not available, they will be obtained from the third-party interface.
2. Area: Once area data is entered in ECOWatch > Basic Settings > Data Entry Mgmt. > Area Information module, users will be able to see energy usage per unit area in the system.
3. Headcount: Once headcount data is entered in ECOWatch > Basic Settings > Data Entry Mgmt. > Headcount Information module, users will be able to see usage per capita in the system.
4. Historical energy usage: After entering historical energy usage in ECOWatch > Basic Settings > Data Entry Mgmt. > Energy Usage Information module, users will be able to see usage calculated based on historical usage in the system.
Indicator Formulation Method
On the Energy Usage Indicator page:
-
Set targets for a specific energy type at an area node, including energy usage, usage-to-output value ratio, usage-to-output ratio, usage per unit area, usage per capita.
-
Support manual formulation
-
Support setting targets based on historical annual data.
-
Support baseline algorithm formulation
Please follow the below steps:
Energy Usage Indicator List
- Log into the ECOWatch EMS, select Target EnPIs > Energy Usage Indicators in the menu on the left to access the Energy Usage Indicators List interface:
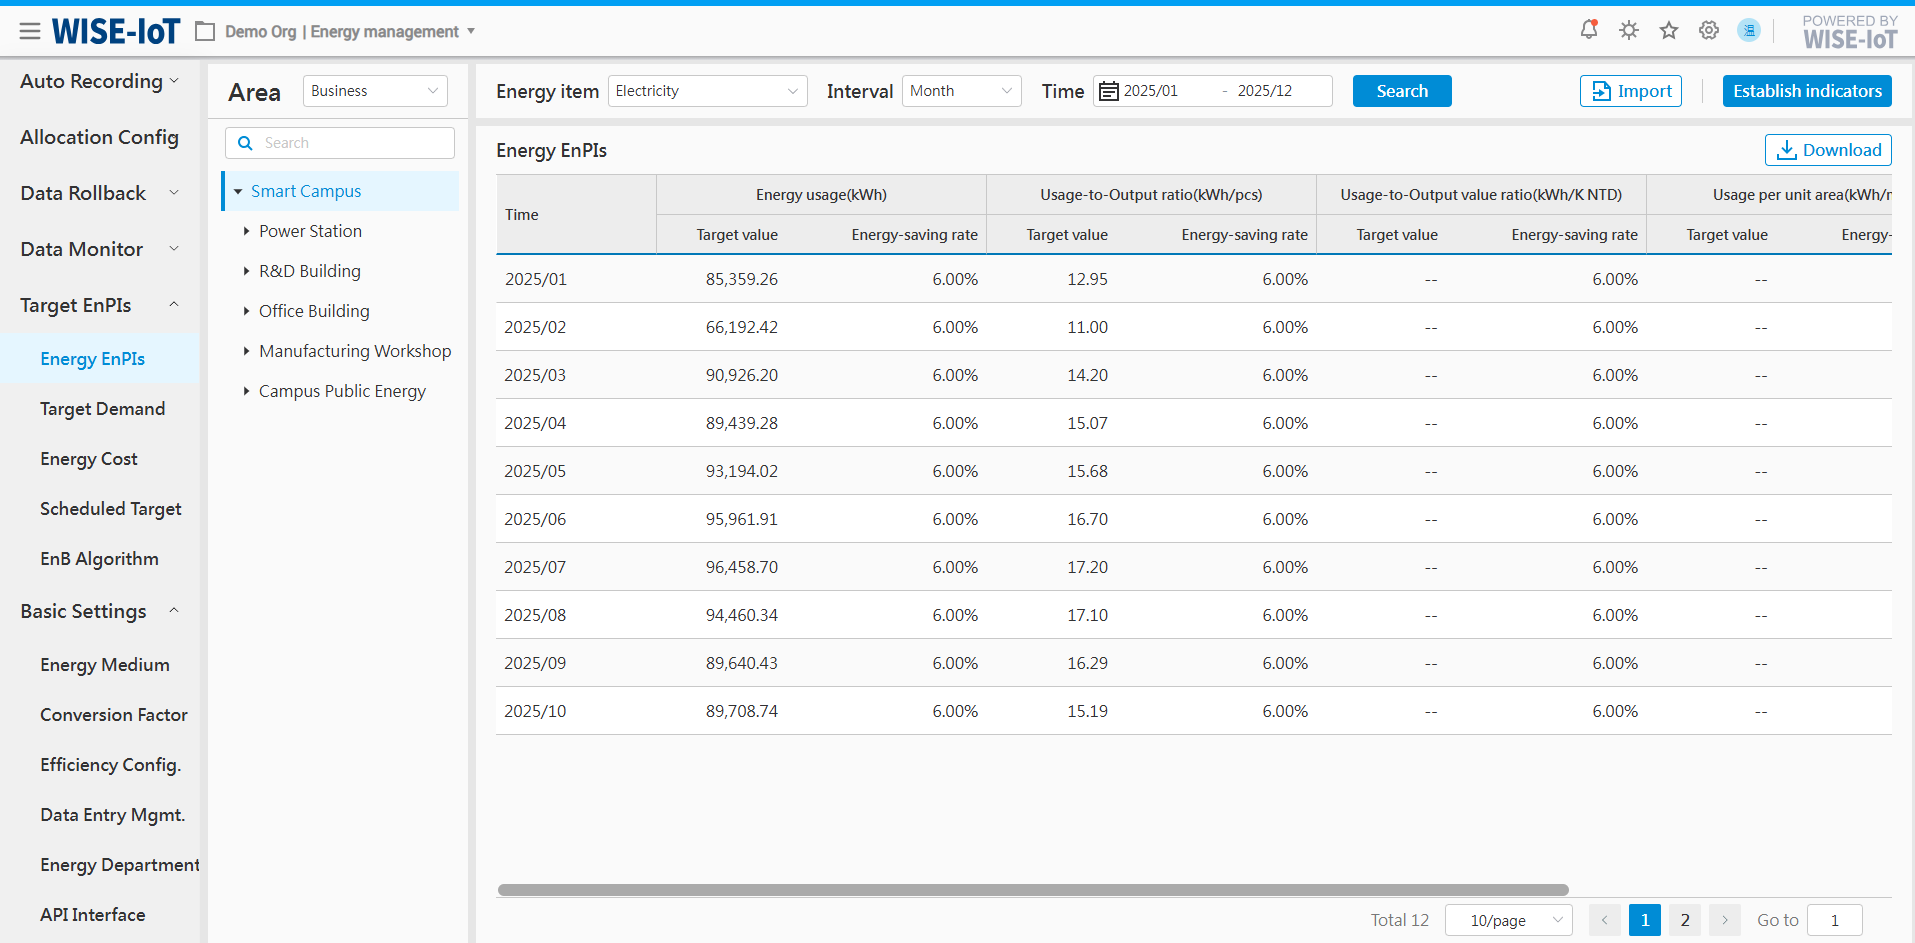
- On the interface:
-
Users can select area nodes based on "business structure" to view corresponding indicators information;
-
Users can select area nodes based on "energy sector" to view corresponding indicators information;
-
Support data query by different energy types.
-
Support viewing data with time granularity such as year, month, and day.
-
Click "Download" to export data in Excel.
Energy Usage Indicators Import
- Go to "Energy Usage Indicators" and click "Import". Click "Download the template" in the popup window to obtain the import template for energy usage indicators. Input the indicators information based on the template's formatting guidelines, then upload the template.
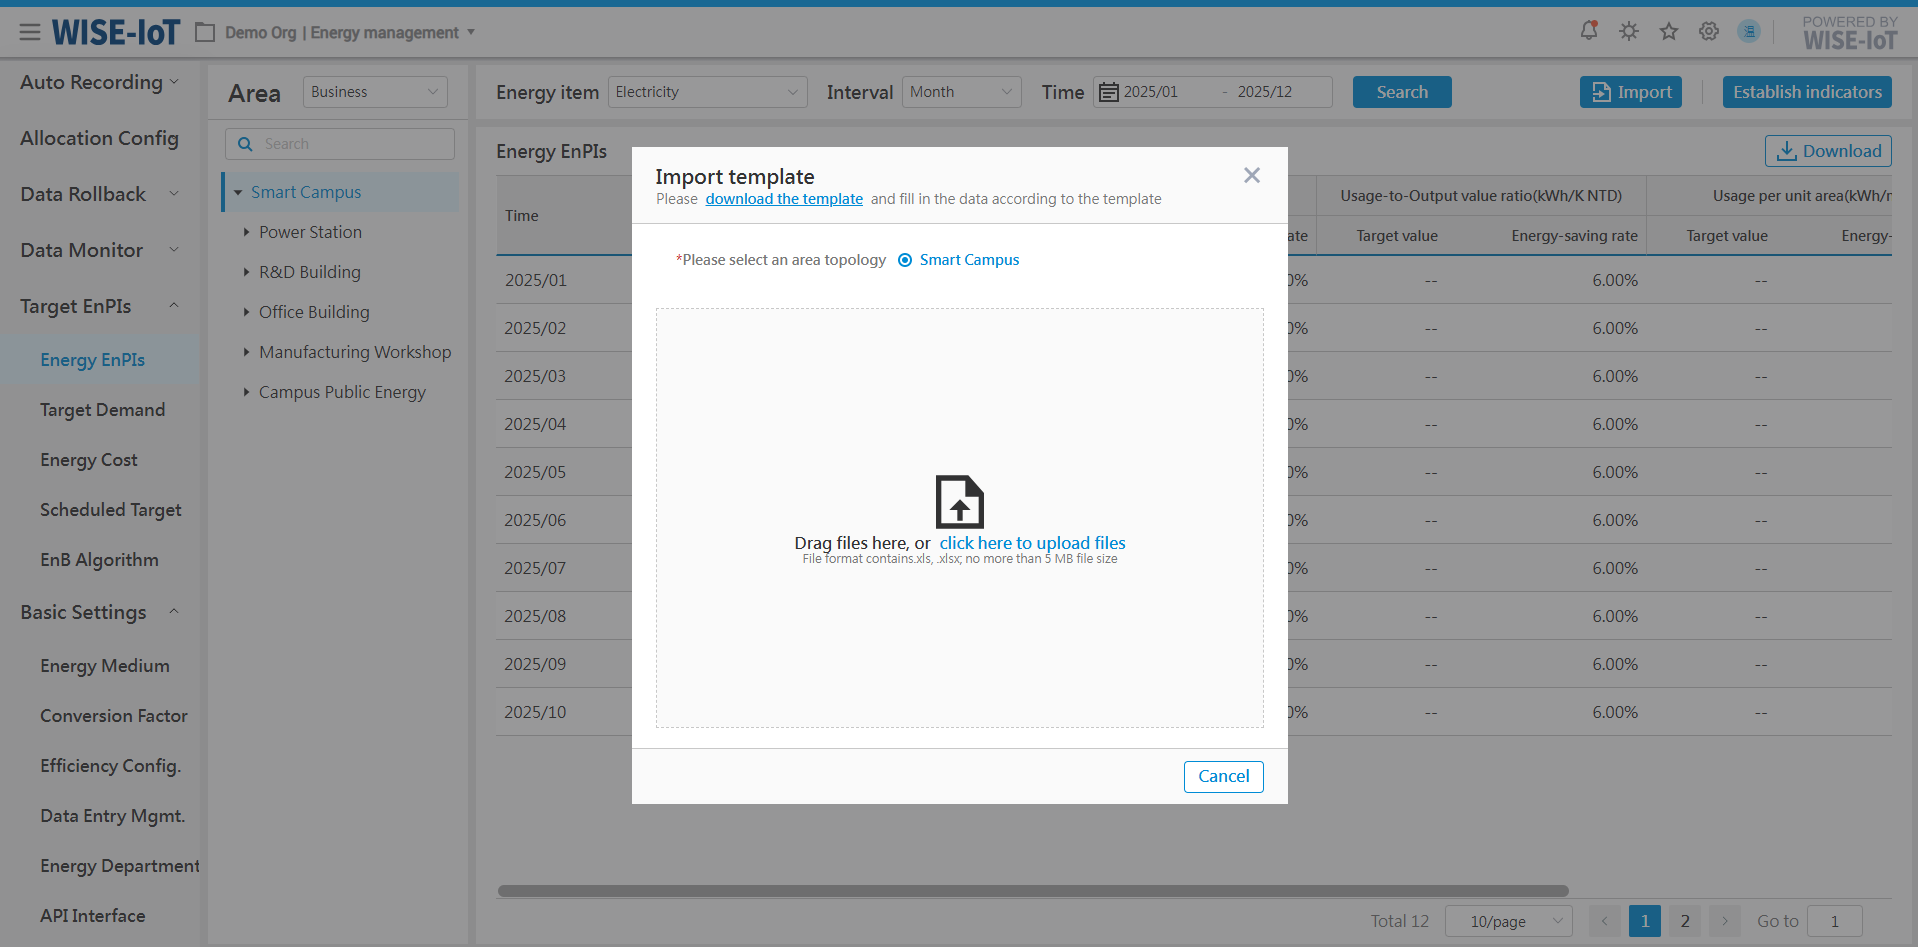
- After the template is imported, users can query the energy usage indicators on the list interface.
Add Energy Usage Indicators
Manual Formulation of Energy Usage Indicators
Click "Establish indicators" in the Energy Usage Indicators list, and select "Manual set-up":
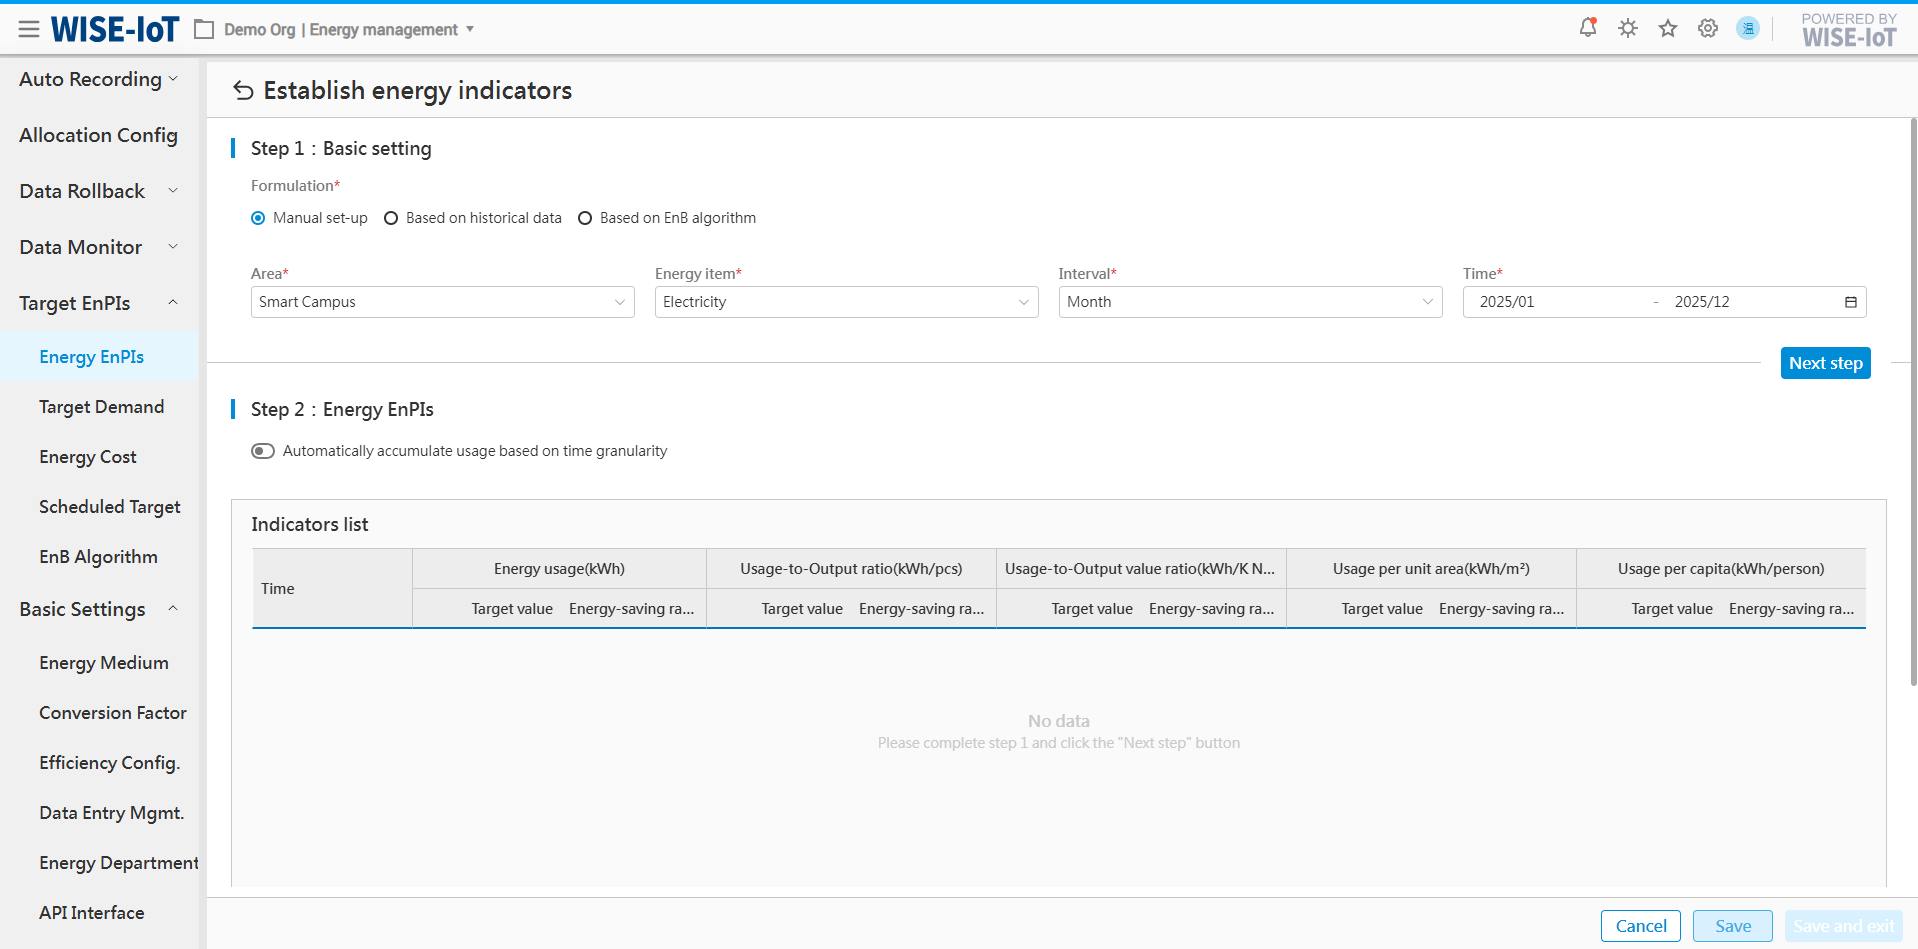
Please follow the below steps:
+---------------------------------------------------------------------+-------------------------------------------------------------------------------------------------------------------------------+
| Step 1: Basic settings |
+---------------------------------------------------------------------+-------------------------------------------------------------------------------------------------------------------------------+
| (1) Formulation method | Select "Manual formulation" |
+---------------------------------------------------------------------+-------------------------------------------------------------------------------------------------------------------------------+
| (2) Select basic information | Select parameters such as area, item, time range, and time period. |
+---------------------------------------------------------------------+-------------------------------------------------------------------------------------------------------------------------------+
| After completing the above steps, click "Next". |
+-----------------------------------------------------------------------------------------------------------------------------------------------------------------------------------------------------+
| 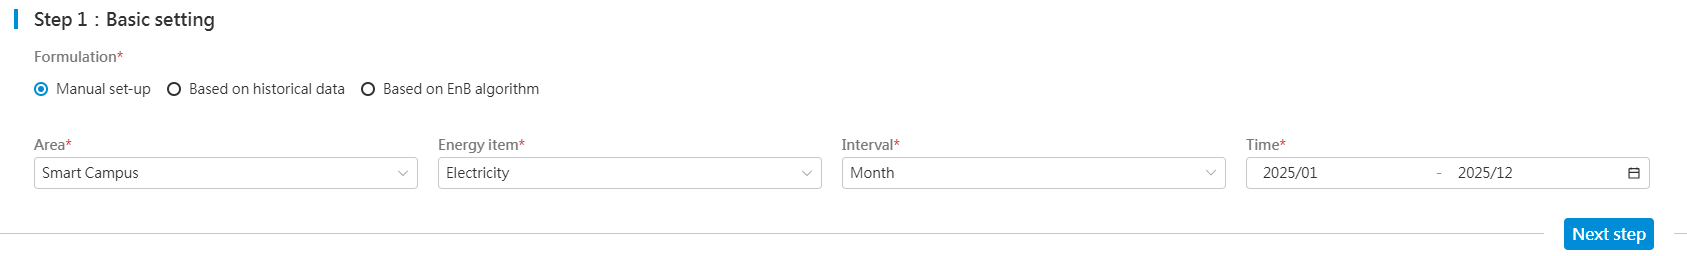 |
+-----------------------------------------------------------------------------------------------------------------------------------------------------------------------------------------------------+
| Step 2: Energy usage indicators |
+---------------------------------------------------------------------+-------------------------------------------------------------------------------------------------------------------------------+
| (1) Automatically aggregates energy usage based on time granularity | This applies specifically to the aggregation of energy usage. |
| | |
| | 1) When the selected interval is daily, it aggregates hourly usage into daily totals and populates the table accordingly. |
| | |
| | 2) When the selected interval is monthly, it aggregates daily usage into monthly totals and populates the table accordingly. |
| | |
| | 3) When the selected interval is annual, it aggregates monthly usage into annual totals and populates the table accordingly. |
+---------------------------------------------------------------------+-------------------------------------------------------------------------------------------------------------------------------+
| (2) List of energy usage indicators | 1) The system will automatically display predefined indicators based on actual needs. |
| | |
| | 2) Manual adjustment is permitted. |
| | |
| | Note: Only numeric input is permitted in this field. |
+---------------------------------------------------------------------+-------------------------------------------------------------------------------------------------------------------------------+
| After completing the above operations, click Save and create indicators for other areas or modify indicators. |
| |
| Click "Save & Exit" to exit the page and return to the previous page. |
+-----------------------------------------------------------------------------------------------------------------------------------------------------------------------------------------------------+
|
|
+-----------------------------------------------------------------------------------------------------------------------------------------------------------------------------------------------------+
| Step 2: Energy usage indicators |
+---------------------------------------------------------------------+-------------------------------------------------------------------------------------------------------------------------------+
| (1) Automatically aggregates energy usage based on time granularity | This applies specifically to the aggregation of energy usage. |
| | |
| | 1) When the selected interval is daily, it aggregates hourly usage into daily totals and populates the table accordingly. |
| | |
| | 2) When the selected interval is monthly, it aggregates daily usage into monthly totals and populates the table accordingly. |
| | |
| | 3) When the selected interval is annual, it aggregates monthly usage into annual totals and populates the table accordingly. |
+---------------------------------------------------------------------+-------------------------------------------------------------------------------------------------------------------------------+
| (2) List of energy usage indicators | 1) The system will automatically display predefined indicators based on actual needs. |
| | |
| | 2) Manual adjustment is permitted. |
| | |
| | Note: Only numeric input is permitted in this field. |
+---------------------------------------------------------------------+-------------------------------------------------------------------------------------------------------------------------------+
| After completing the above operations, click Save and create indicators for other areas or modify indicators. |
| |
| Click "Save & Exit" to exit the page and return to the previous page. |
+-----------------------------------------------------------------------------------------------------------------------------------------------------------------------------------------------------+
| 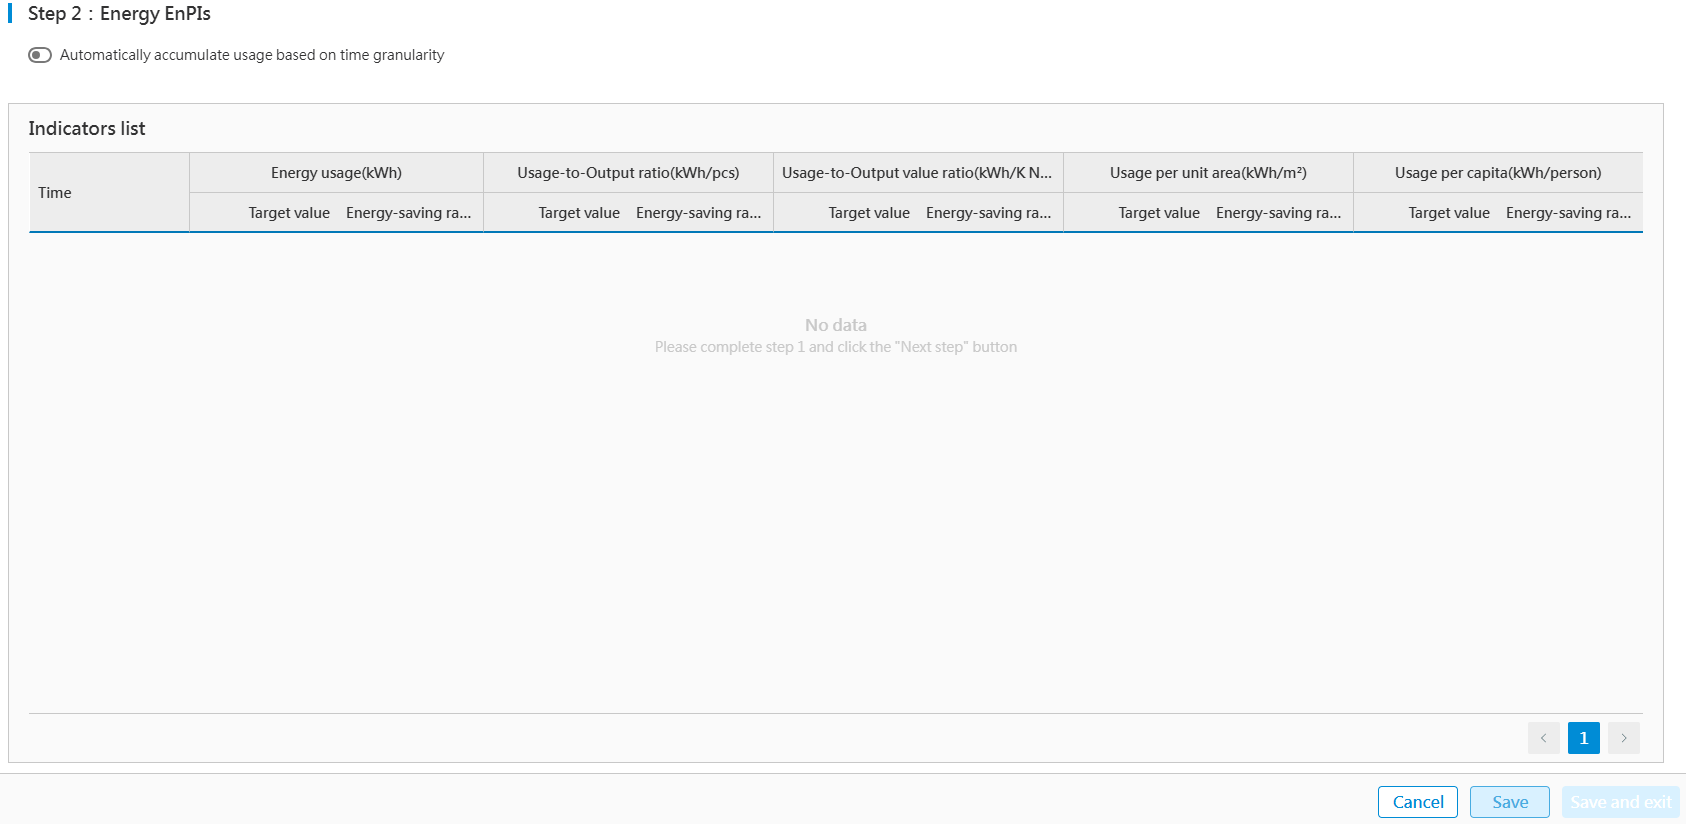 |
+-----------------------------------------------------------------------------------------------------------------------------------------------------------------------------------------------------+
|
+-----------------------------------------------------------------------------------------------------------------------------------------------------------------------------------------------------+
Formulate Indicators Based on Historical Data
The "Based on Historical Data" method applies to scenarios where users have utilized ECOWatch for some time and there are historical energy usage data in the system. This method involves automatically calculating corresponding energy usage indicators by referring to historical annual data and incorporating energy-saving rate or target value conditions configured in the interface.
Click "Formulate Indicators" in the Energy Usage Indicators list, and select "Formulate Based on Historical Data" as the formulation method:
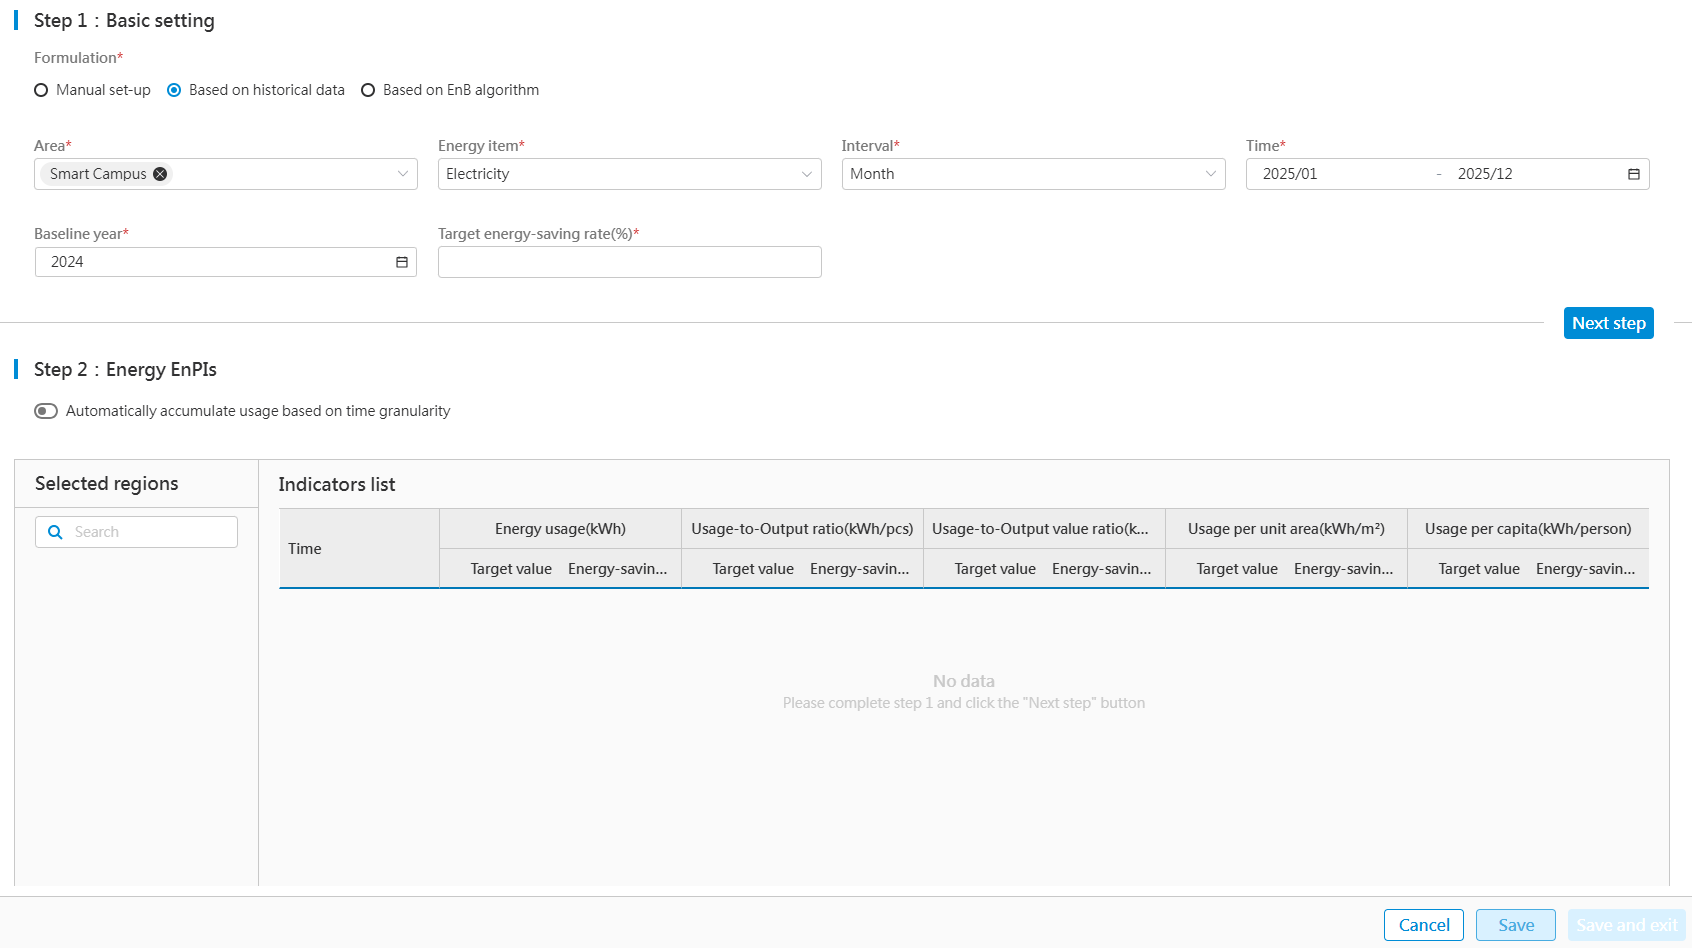
Please follow the below steps:
+---------------------------------------------------------------------+--------------------------------------------------------------------------------------------------------------------------------------------------------------+
| Step 1: Basic settings |
+---------------------------------------------------------------------+--------------------------------------------------------------------------------------------------------------------------------------------------------------+
| (1) Formulation method | Select "Formulate Indicators Based on Historical Data |
+---------------------------------------------------------------------+--------------------------------------------------------------------------------------------------------------------------------------------------------------+
| (2) Select basic information | 1) Select areas: Several areas can be selected; |
| | |
| | 2) Select energy items, time range, and time period, etc. |
| | |
| | 3) Set the base year and rat energy-saving rate. |
+---------------------------------------------------------------------+--------------------------------------------------------------------------------------------------------------------------------------------------------------+
| After completing the above operations, click "Next". |
+------------------------------------------------------------------------------------------------------------------------------------------------------------------------------------------------------------------------------------+
| 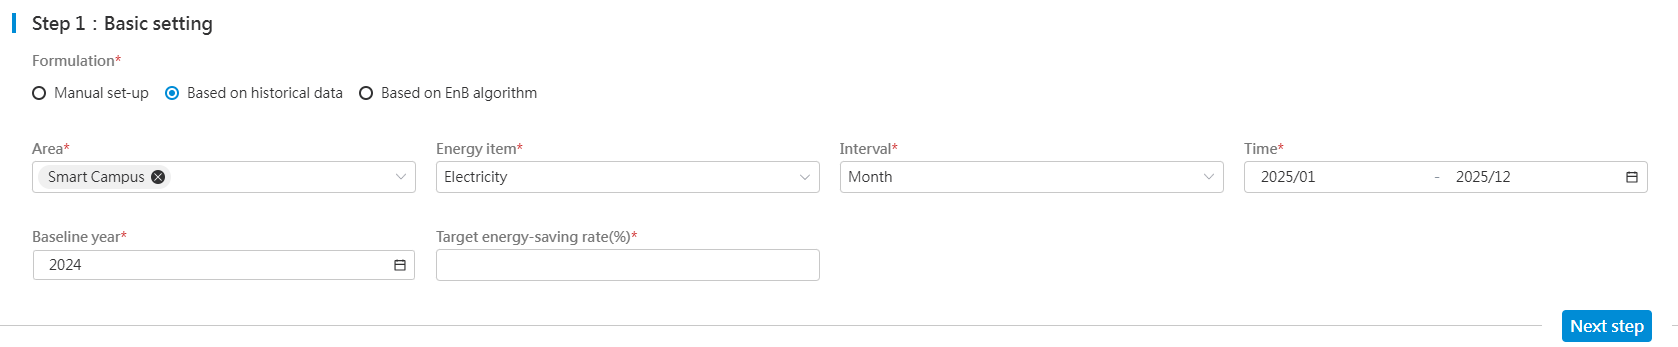 |
+------------------------------------------------------------------------------------------------------------------------------------------------------------------------------------------------------------------------------------+
| Step 2: Energy usage indicators |
+---------------------------------------------------------------------+--------------------------------------------------------------------------------------------------------------------------------------------------------------+
| (1) Automatically aggregate energy usage based on time granularity. | This applies specifically to the aggregation of energy usage. |
| | |
| | 1) When the selected interval is daily, it aggregates hourly usage into daily totals and populates the table accordingly. |
| | |
| | 2) When the selected interval is monthly, it aggregates daily usage into monthly totals and populates the table accordingly. |
| | |
| | 3) When the selected interval is annual, it aggregates monthly usage into annual totals and populates the table accordingly. |
+---------------------------------------------------------------------+--------------------------------------------------------------------------------------------------------------------------------------------------------------+
| (2) Energy Usage Indicators list | 1) The system displays by default the energy usage indicators of the first area selected, which is calculated based on basic information and the base year. |
| | |
| | 2) Output value and output are sourced from either Data Entry Mgmt. module of fundamental parameters or third-party interfaces. |
| | |
| | 3) Area and headcount information are sourced from Data Entry Mgmt. module of fundamental parameters. |
| | |
| | 4) Target values and energy-saving rates can be adjusted, and the system will automatically recalculate them based on the adjusted data. |
| | |
| | Note: Only numeric input is permitted in this field. |
+---------------------------------------------------------------------+--------------------------------------------------------------------------------------------------------------------------------------------------------------+
| After completing the above operations, click Save and create indicators for other areas or modify indicators. |
| |
| Click Save & Exit to exit the page and return to the previous page. |
+------------------------------------------------------------------------------------------------------------------------------------------------------------------------------------------------------------------------------------+
|
|
+------------------------------------------------------------------------------------------------------------------------------------------------------------------------------------------------------------------------------------+
| Step 2: Energy usage indicators |
+---------------------------------------------------------------------+--------------------------------------------------------------------------------------------------------------------------------------------------------------+
| (1) Automatically aggregate energy usage based on time granularity. | This applies specifically to the aggregation of energy usage. |
| | |
| | 1) When the selected interval is daily, it aggregates hourly usage into daily totals and populates the table accordingly. |
| | |
| | 2) When the selected interval is monthly, it aggregates daily usage into monthly totals and populates the table accordingly. |
| | |
| | 3) When the selected interval is annual, it aggregates monthly usage into annual totals and populates the table accordingly. |
+---------------------------------------------------------------------+--------------------------------------------------------------------------------------------------------------------------------------------------------------+
| (2) Energy Usage Indicators list | 1) The system displays by default the energy usage indicators of the first area selected, which is calculated based on basic information and the base year. |
| | |
| | 2) Output value and output are sourced from either Data Entry Mgmt. module of fundamental parameters or third-party interfaces. |
| | |
| | 3) Area and headcount information are sourced from Data Entry Mgmt. module of fundamental parameters. |
| | |
| | 4) Target values and energy-saving rates can be adjusted, and the system will automatically recalculate them based on the adjusted data. |
| | |
| | Note: Only numeric input is permitted in this field. |
+---------------------------------------------------------------------+--------------------------------------------------------------------------------------------------------------------------------------------------------------+
| After completing the above operations, click Save and create indicators for other areas or modify indicators. |
| |
| Click Save & Exit to exit the page and return to the previous page. |
+------------------------------------------------------------------------------------------------------------------------------------------------------------------------------------------------------------------------------------+
| 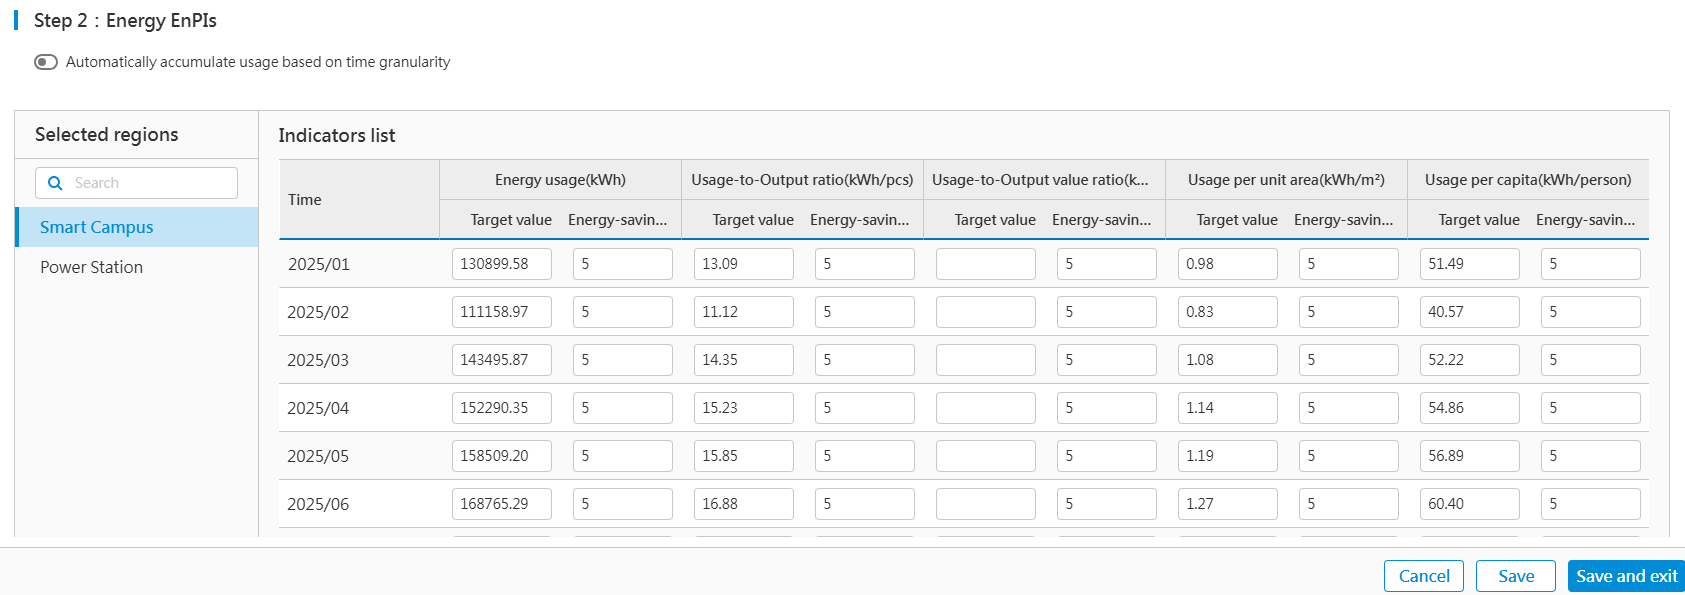 |
+------------------------------------------------------------------------------------------------------------------------------------------------------------------------------------------------------------------------------------+
|
+------------------------------------------------------------------------------------------------------------------------------------------------------------------------------------------------------------------------------------+
Formulate Indicators Based on EnB Algorithm
The "Based on EnB Algorithm" approach requires that the enterprise has identified energy usage variables for each energy-consuming unit and accumulated data over a certain period of time.
Click "Formulate Indicators" in the Energy Usage Indicators list, and select "Formulate Based on Baseline Algorithm" as the formulation method:
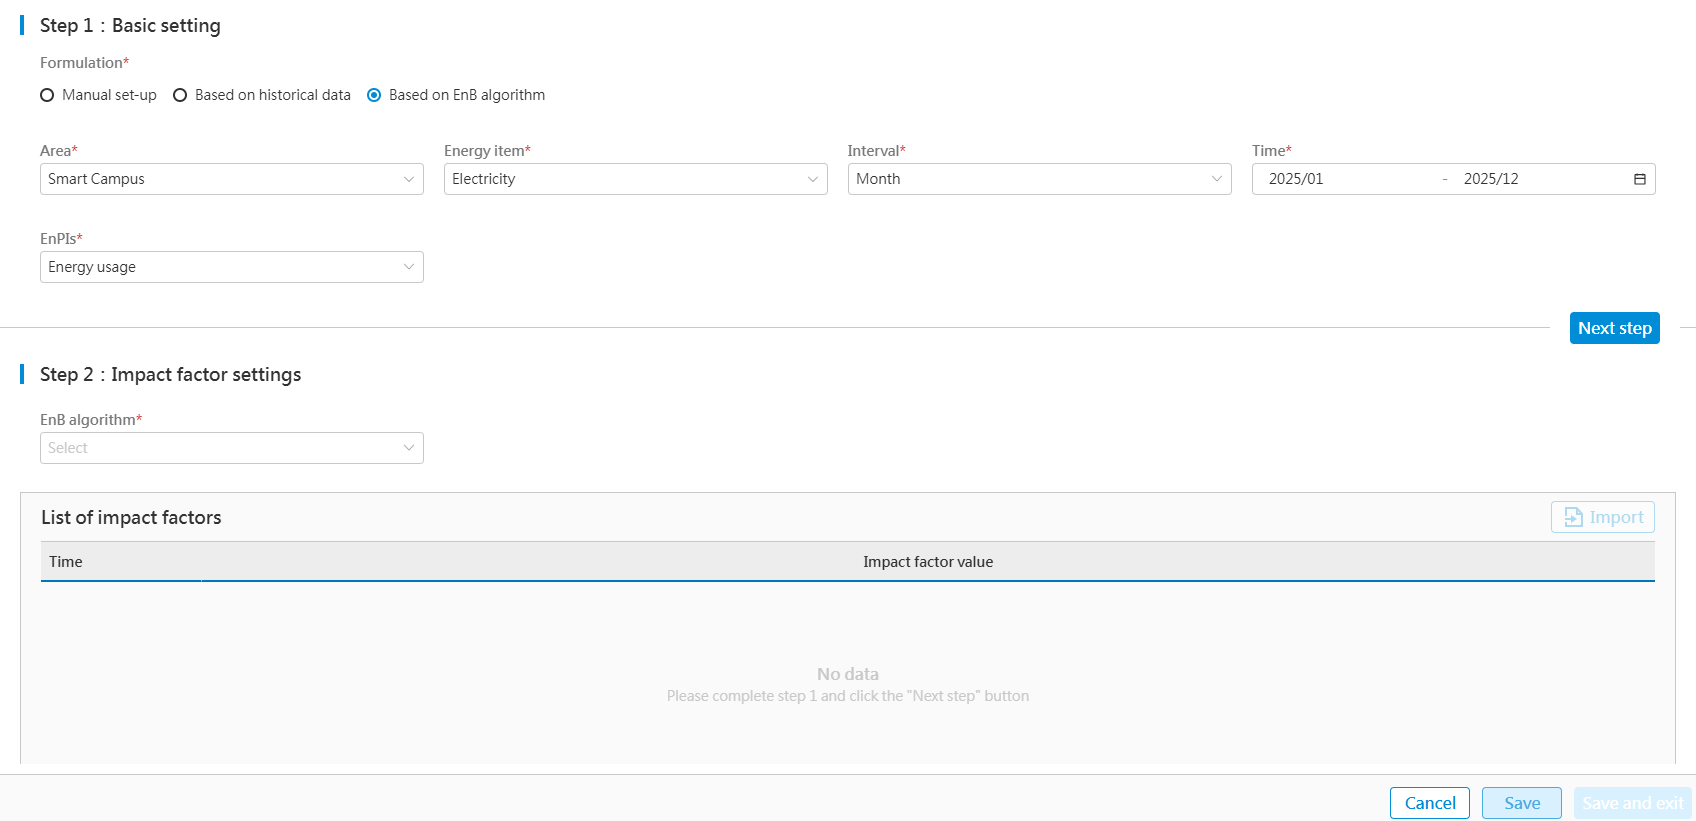
Detailed steps are as below:
+------------------------------------------------------------------------------+------------------------------------------------------------------------------------------------------------------------------------------------------------------------------------------------------+
| Step 1: Basic settings |
+------------------------------------------------------------------------------+------------------------------------------------------------------------------------------------------------------------------------------------------------------------------------------------------+
| (1) Formulation method | Select "Formulate Based on Baseline Algorithm" |
+------------------------------------------------------------------------------+------------------------------------------------------------------------------------------------------------------------------------------------------------------------------------------------------+
| (2) Select basic information | 1) Select areas, energy items, time intervals, and time granularity. |
| | |
| | 2) Select performance indicators, energy items, time range, time period, etc. |
+------------------------------------------------------------------------------+------------------------------------------------------------------------------------------------------------------------------------------------------------------------------------------------------+
| After completing the above operations, click "Next". |
+-------------------------------------------------------------------------------------------------------------------------------------------------------------------------------------------------------------------------------------------------------------------------------------+
| 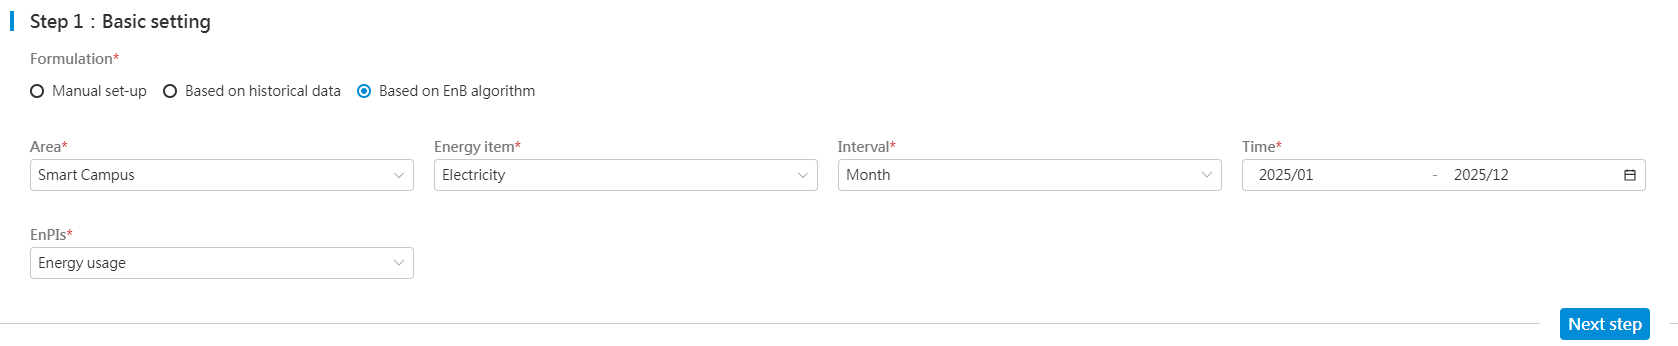 |
+-------------------------------------------------------------------------------------------------------------------------------------------------------------------------------------------------------------------------------------------------------------------------------------+
| Step 2: Setup of influencing factors |
+------------------------------------------------------------------------------+------------------------------------------------------------------------------------------------------------------------------------------------------------------------------------------------------+
| (1) Select baseline algorithm | The system filters out eligible energy baseline algorithms based on the parameters configured in Step 1. |
| | |
| | If no baseline algorithms are available, navigate to the [Energy Baseline Algorithm] module to create one. |
+------------------------------------------------------------------------------+------------------------------------------------------------------------------------------------------------------------------------------------------------------------------------------------------+
| (2) List of influencing factors | This section displays the influencing factors associated with the baseline algorithm. Please enter corresponding factor values for respective time periods. There are two methods for entering data: |
| | |
| | 1) Manually enter influencing factor values corresponding to the selected date. |
| | |
| | 2) The system provides an Excel template for importing influencing factors. Click "Import" to import data. |
| | |
| | Note: Blank cells are not allowed in the table. |
+------------------------------------------------------------------------------+------------------------------------------------------------------------------------------------------------------------------------------------------------------------------------------------------+
| (3) Energy saving rate calculation (base year) | That is, after a base year is selected, the system calculates the target energy saving rate based on the target values and the actual value from the baseline year. |
+------------------------------------------------------------------------------+------------------------------------------------------------------------------------------------------------------------------------------------------------------------------------------------------+
| After completing the above information, click "Next". |
+-------------------------------------------------------------------------------------------------------------------------------------------------------------------------------------------------------------------------------------------------------------------------------------+
| Step 3: Energy usage indicators |
+------------------------------------------------------------------------------+------------------------------------------------------------------------------------------------------------------------------------------------------------------------------------------------------+
| (1) Automatically aggregates energy usage based on selected time granularity | This applies specifically to the aggregation of energy usage. |
| | |
| | 1) When the selected interval is daily, it aggregates hourly usage into daily totals and populates the table accordingly. |
| | |
| | 2) When the selected interval is monthly, it aggregates daily usage into monthly totals and populates the table accordingly. |
| | |
| | 3) When the selected interval is annual, it aggregates monthly usage into annual totals and populates the table accordingly. |
+------------------------------------------------------------------------------+------------------------------------------------------------------------------------------------------------------------------------------------------------------------------------------------------+
| (2) List of energy usage indicators | 1) The system calculates target values for relevant indicators using the energy baseline algorithm and their corresponding target energy saving rates based on the base year. |
| | |
| | 2) The target values and energy saving rates can be adjusted. The system will automatically recalculate them based on the adjusted data. |
| | |
| | Note: Only numeric input is permitted in this field. |
+------------------------------------------------------------------------------+------------------------------------------------------------------------------------------------------------------------------------------------------------------------------------------------------+
| After completing the above operations, click Save, and create indicators for other areas or modify indicators. |
| |
| Click Save & Exit to exit the page and return to the previous page. |
+-------------------------------------------------------------------------------------------------------------------------------------------------------------------------------------------------------------------------------------------------------------------------------------+
|
|
+-------------------------------------------------------------------------------------------------------------------------------------------------------------------------------------------------------------------------------------------------------------------------------------+
| Step 2: Setup of influencing factors |
+------------------------------------------------------------------------------+------------------------------------------------------------------------------------------------------------------------------------------------------------------------------------------------------+
| (1) Select baseline algorithm | The system filters out eligible energy baseline algorithms based on the parameters configured in Step 1. |
| | |
| | If no baseline algorithms are available, navigate to the [Energy Baseline Algorithm] module to create one. |
+------------------------------------------------------------------------------+------------------------------------------------------------------------------------------------------------------------------------------------------------------------------------------------------+
| (2) List of influencing factors | This section displays the influencing factors associated with the baseline algorithm. Please enter corresponding factor values for respective time periods. There are two methods for entering data: |
| | |
| | 1) Manually enter influencing factor values corresponding to the selected date. |
| | |
| | 2) The system provides an Excel template for importing influencing factors. Click "Import" to import data. |
| | |
| | Note: Blank cells are not allowed in the table. |
+------------------------------------------------------------------------------+------------------------------------------------------------------------------------------------------------------------------------------------------------------------------------------------------+
| (3) Energy saving rate calculation (base year) | That is, after a base year is selected, the system calculates the target energy saving rate based on the target values and the actual value from the baseline year. |
+------------------------------------------------------------------------------+------------------------------------------------------------------------------------------------------------------------------------------------------------------------------------------------------+
| After completing the above information, click "Next". |
+-------------------------------------------------------------------------------------------------------------------------------------------------------------------------------------------------------------------------------------------------------------------------------------+
| Step 3: Energy usage indicators |
+------------------------------------------------------------------------------+------------------------------------------------------------------------------------------------------------------------------------------------------------------------------------------------------+
| (1) Automatically aggregates energy usage based on selected time granularity | This applies specifically to the aggregation of energy usage. |
| | |
| | 1) When the selected interval is daily, it aggregates hourly usage into daily totals and populates the table accordingly. |
| | |
| | 2) When the selected interval is monthly, it aggregates daily usage into monthly totals and populates the table accordingly. |
| | |
| | 3) When the selected interval is annual, it aggregates monthly usage into annual totals and populates the table accordingly. |
+------------------------------------------------------------------------------+------------------------------------------------------------------------------------------------------------------------------------------------------------------------------------------------------+
| (2) List of energy usage indicators | 1) The system calculates target values for relevant indicators using the energy baseline algorithm and their corresponding target energy saving rates based on the base year. |
| | |
| | 2) The target values and energy saving rates can be adjusted. The system will automatically recalculate them based on the adjusted data. |
| | |
| | Note: Only numeric input is permitted in this field. |
+------------------------------------------------------------------------------+------------------------------------------------------------------------------------------------------------------------------------------------------------------------------------------------------+
| After completing the above operations, click Save, and create indicators for other areas or modify indicators. |
| |
| Click Save & Exit to exit the page and return to the previous page. |
+-------------------------------------------------------------------------------------------------------------------------------------------------------------------------------------------------------------------------------------------------------------------------------------+
| 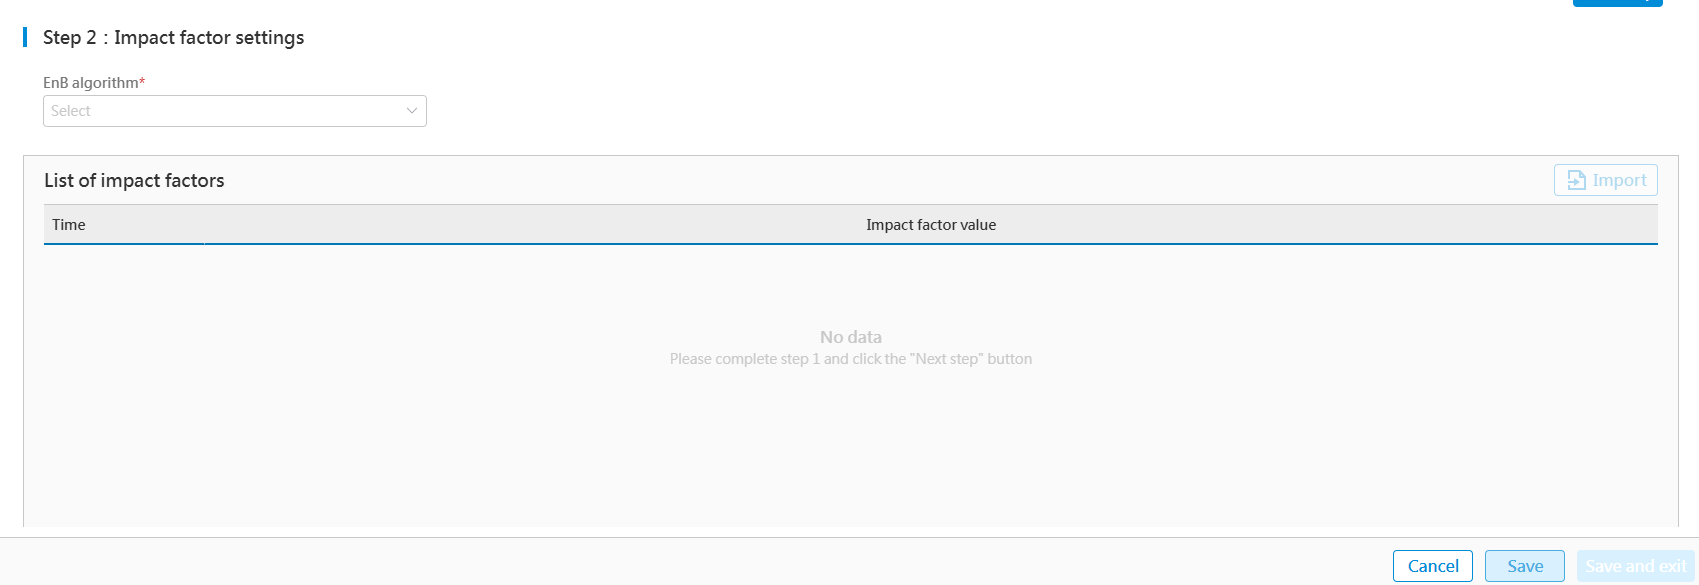 |
+-------------------------------------------------------------------------------------------------------------------------------------------------------------------------------------------------------------------------------------------------------------------------------------+
|
+-------------------------------------------------------------------------------------------------------------------------------------------------------------------------------------------------------------------------------------------------------------------------------------+
Modify Energy Usage Indicators
The system permits modifications or redefinitions of energy usage indicators. The process is the same as adding energy usage indicators:
-
Click "Establish indicators" to navigate to the Indicator Formulation interface.
-
Select the energy type to be modified and choose the time range to filter out indicators.
-
Modify indicators within the "Manual set-up" module.
For the total energy usage indicators used in the ECOWatch interface, such as coal equivalent, carbon equivalent, oil equivalent, thermal equivalent, and standard electricity, the system will automatically convert them based on the pre-set energy usage indicators and energy medium conversion coefficients.
Target Demand
Target Demand applies exclusively to "electricity", and users may configure target demand for electricity-consuming zones.
Import Target Demands
- Access the ECOWatch Energy Management System and select Target EnPIs > Target Demand in the menu on the left:
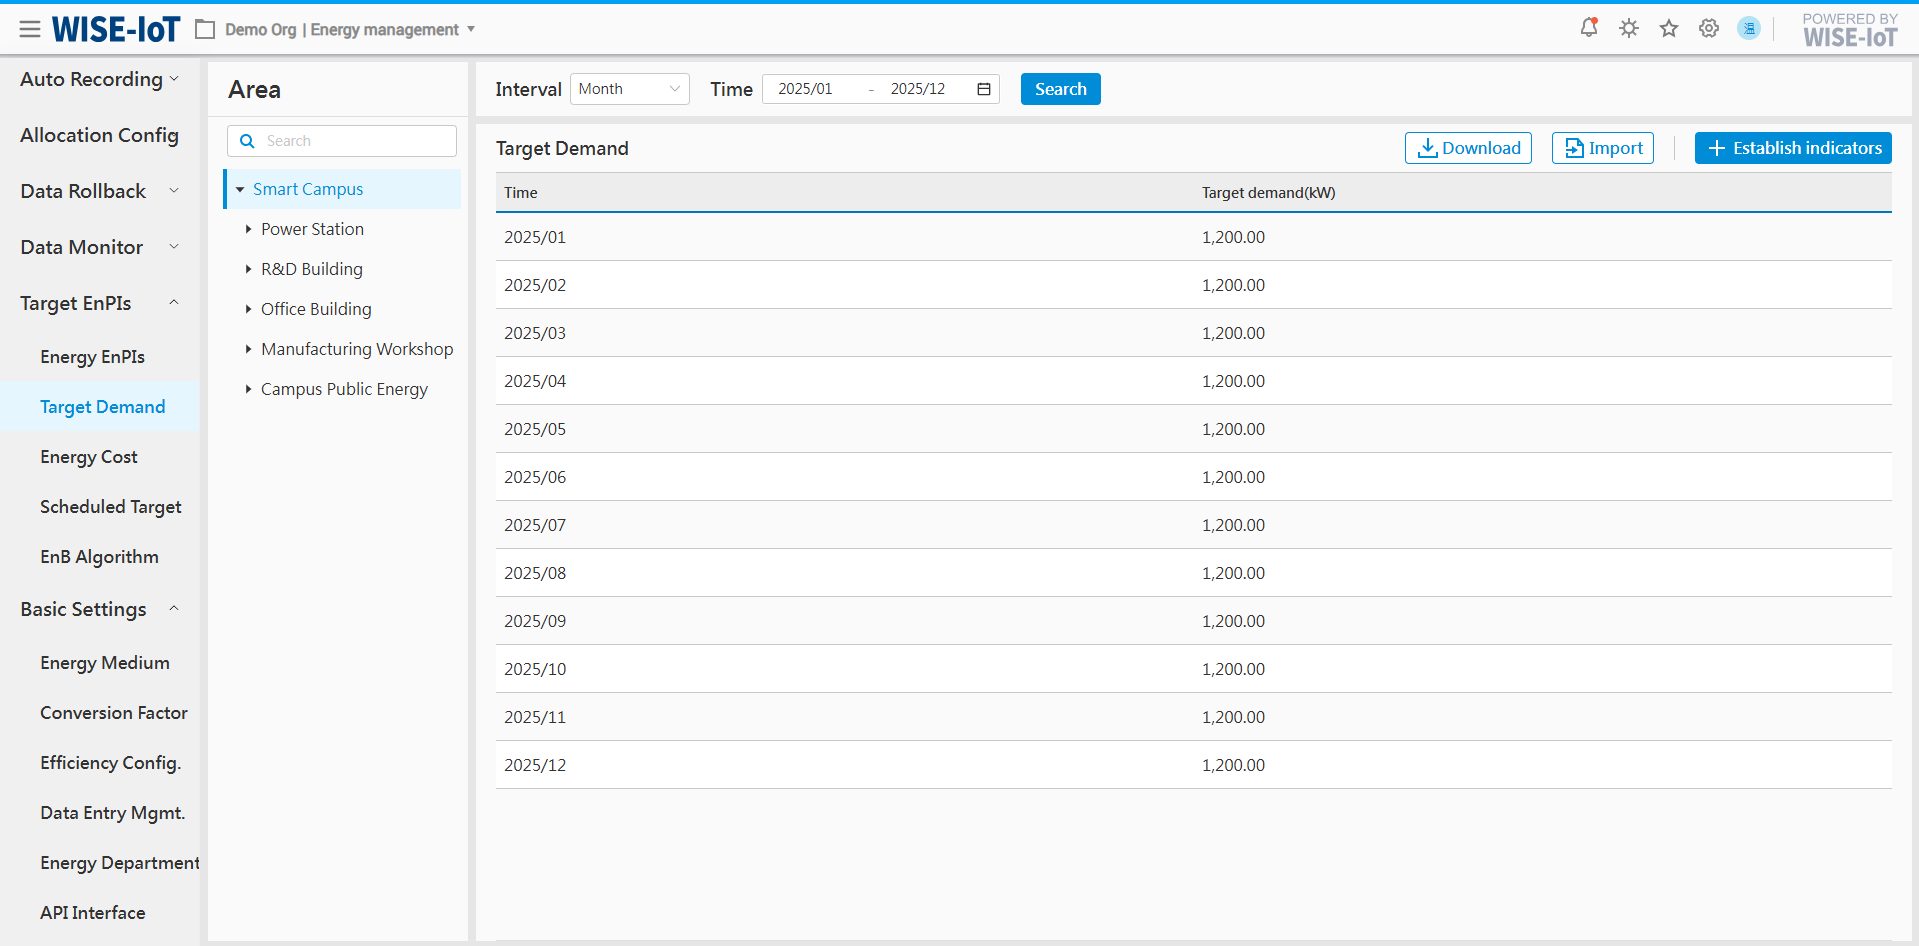
- Click "Import" and select "Download Template" in the pop-up window to access the import template of target demand. Enter the required indicators according to the template format, and upload the template to import data.
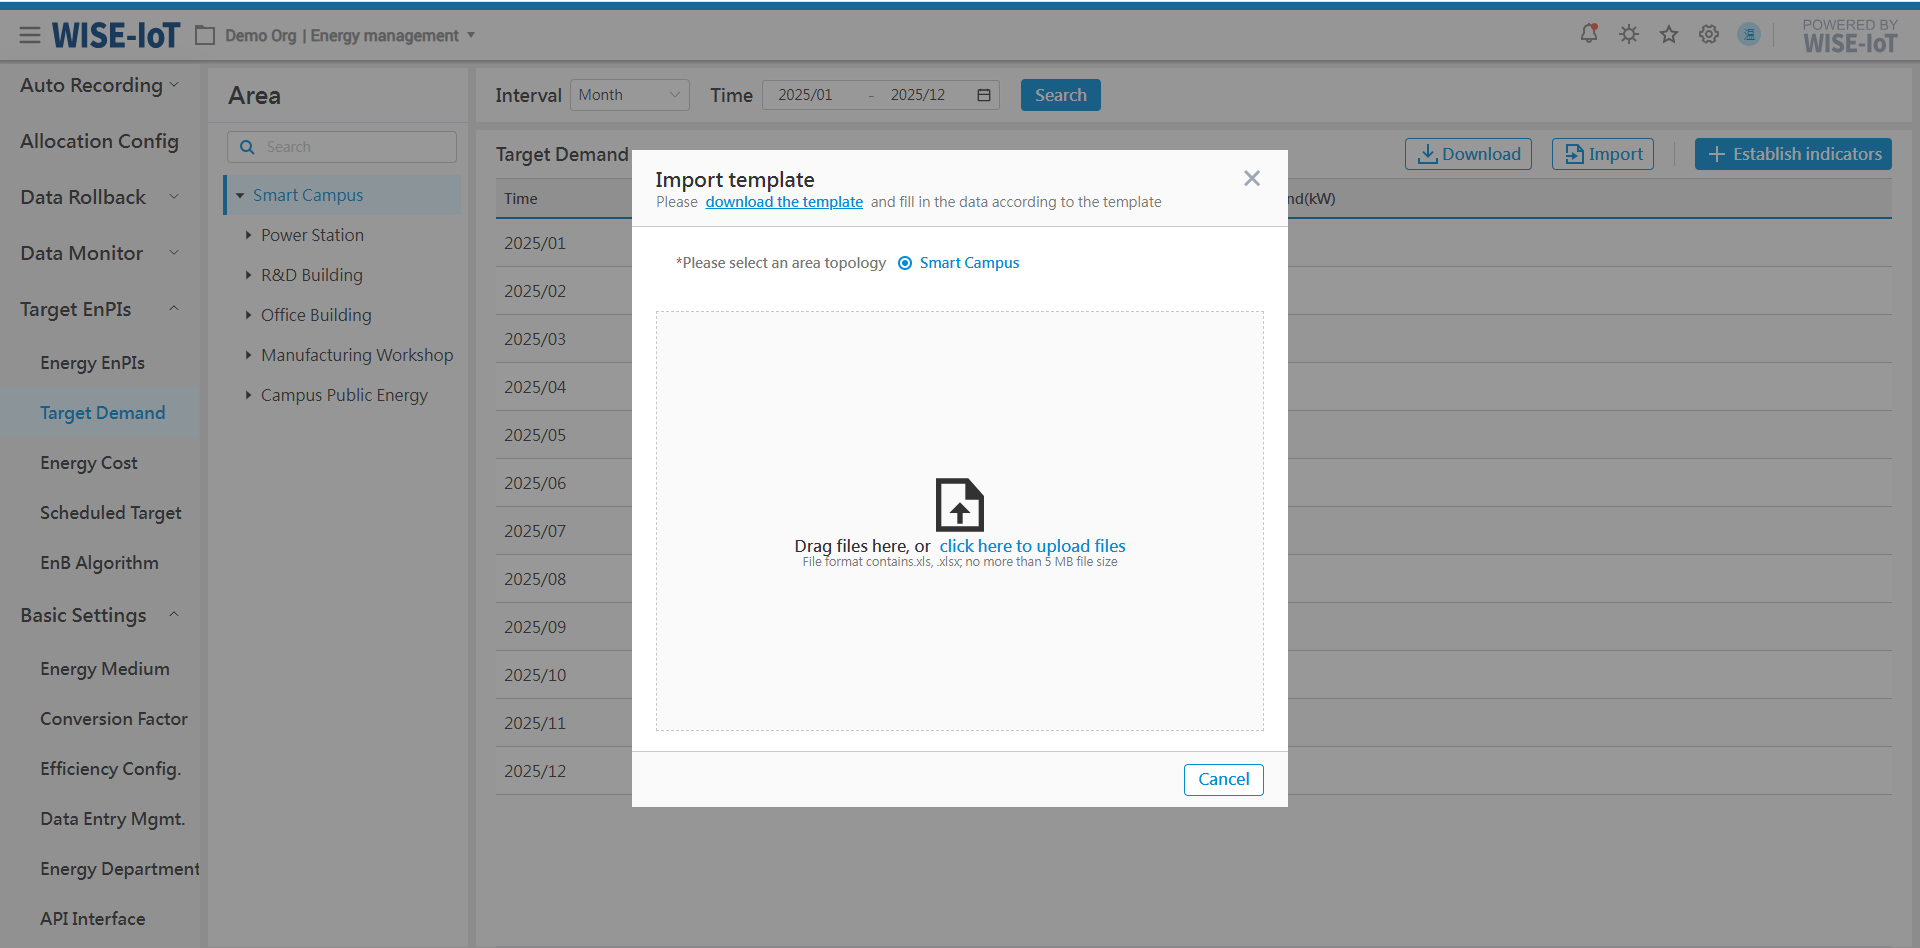
- The target demand information will be displayed in the list interface.
Target Demand List
-
Access the ECOWatch Energy Management System, select Target EnPIs > Target Demand from the menu on the left to navigate to the Target Demand List interface.
-
On the interface:
(1) The minimum granularity supported for target demand setting is monthly. Data can be viewed at yearly or monthly granularity.
(2) Click "Download" to export data in Excel.
Add Target Demands
- Click "Establish indicators" in the Target Demand list to access the Demand Formulation page:
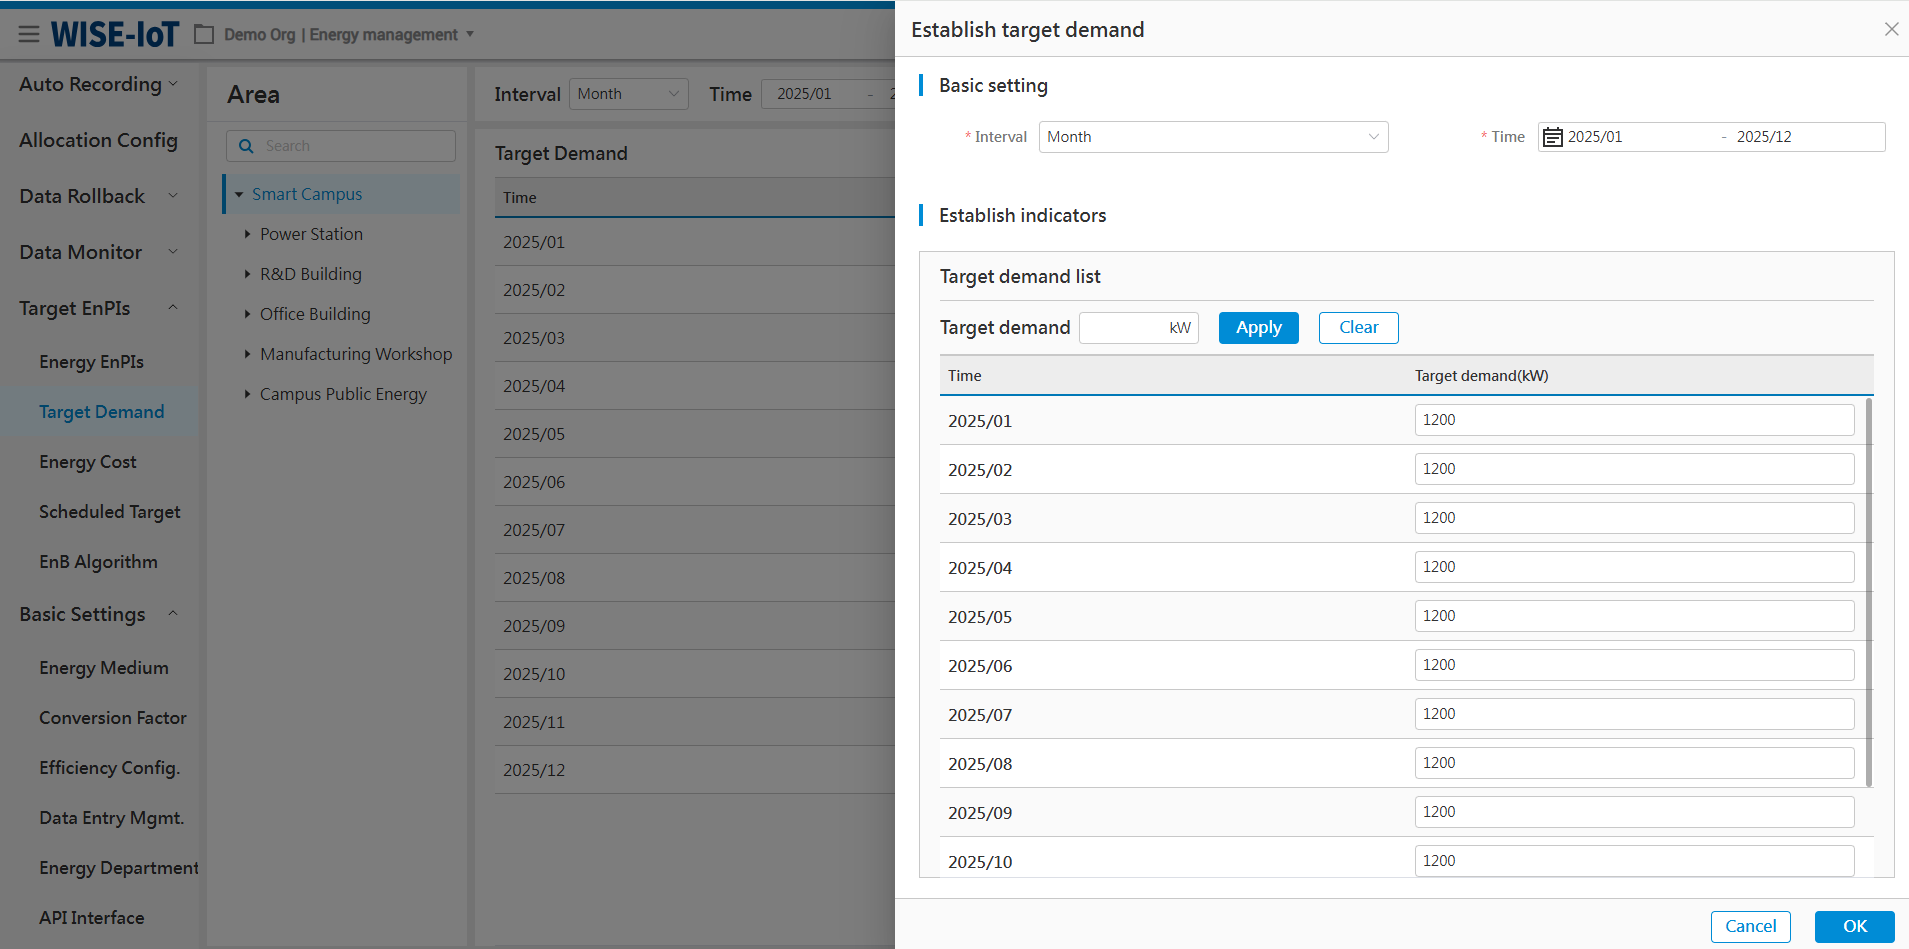
-
Before formulating target demand, select the time range for it.
-
On the interface:
(1) Enter a value in the target demand field, then click "Apply" to batch-populate the target demands into the target value fields for the selected period;
(2) Manually enter or adjust target demand for any given date;
(3) Click "Ok" to save the changes.
Adjust Target Demands
The system permits modifications or redefinitions of target demands. The process is the same as adding target demands:
-
Click "Establish indicators";
-
Select the time range for the demand to be modified to filter out indicators.
-
Modify the target demands and save the changes.
Energy Costs
The Energy Cost Indicators page:
-
Support target setting for energy unit price, energy cost, cost per unit output value, cost per unit output, cost per unit area, and cost per capita of a specific energy type at area nodes.
-
Indicators can be set manually.
The procedures are as follows:
Import Energy Cost Indicators
- In the ECOWatch Energy Management System, select Target EnPIs > Energy Cost in the menu on the left:
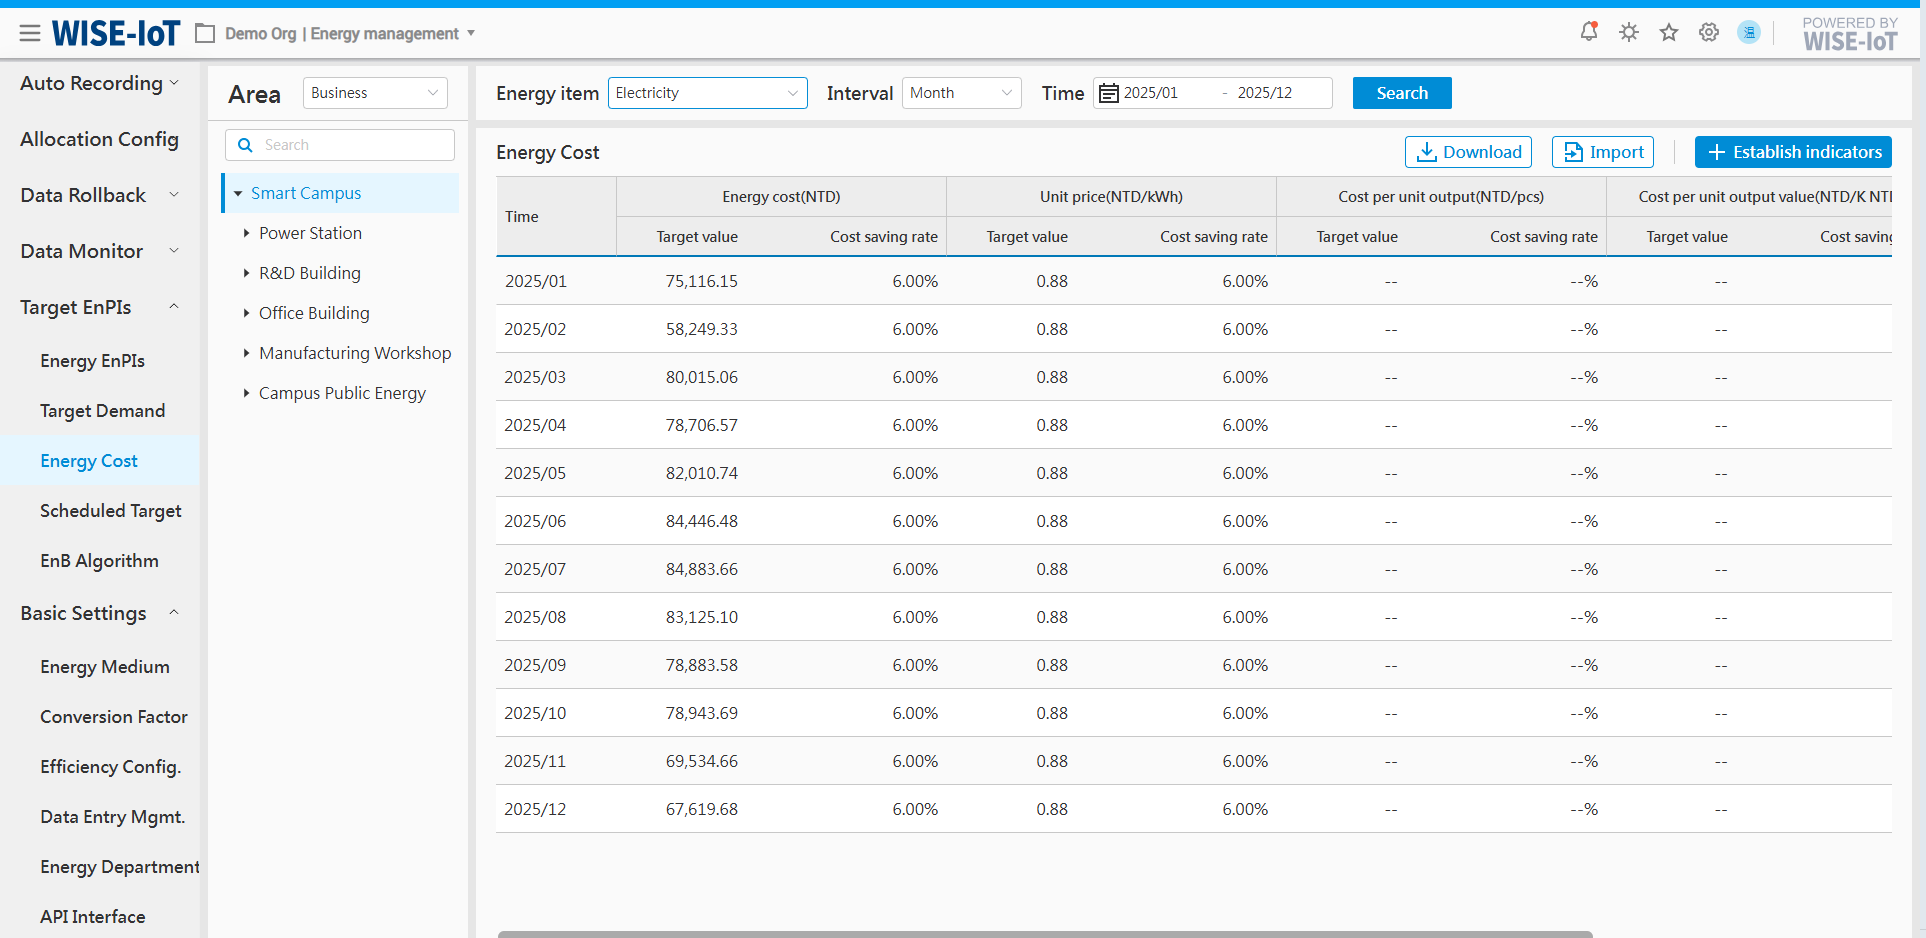
- Click "Import" and "Download Template" in the pop-up window to obtain the Energy Cost import template. Enter the relevant indicators according to the template format and upload the template.
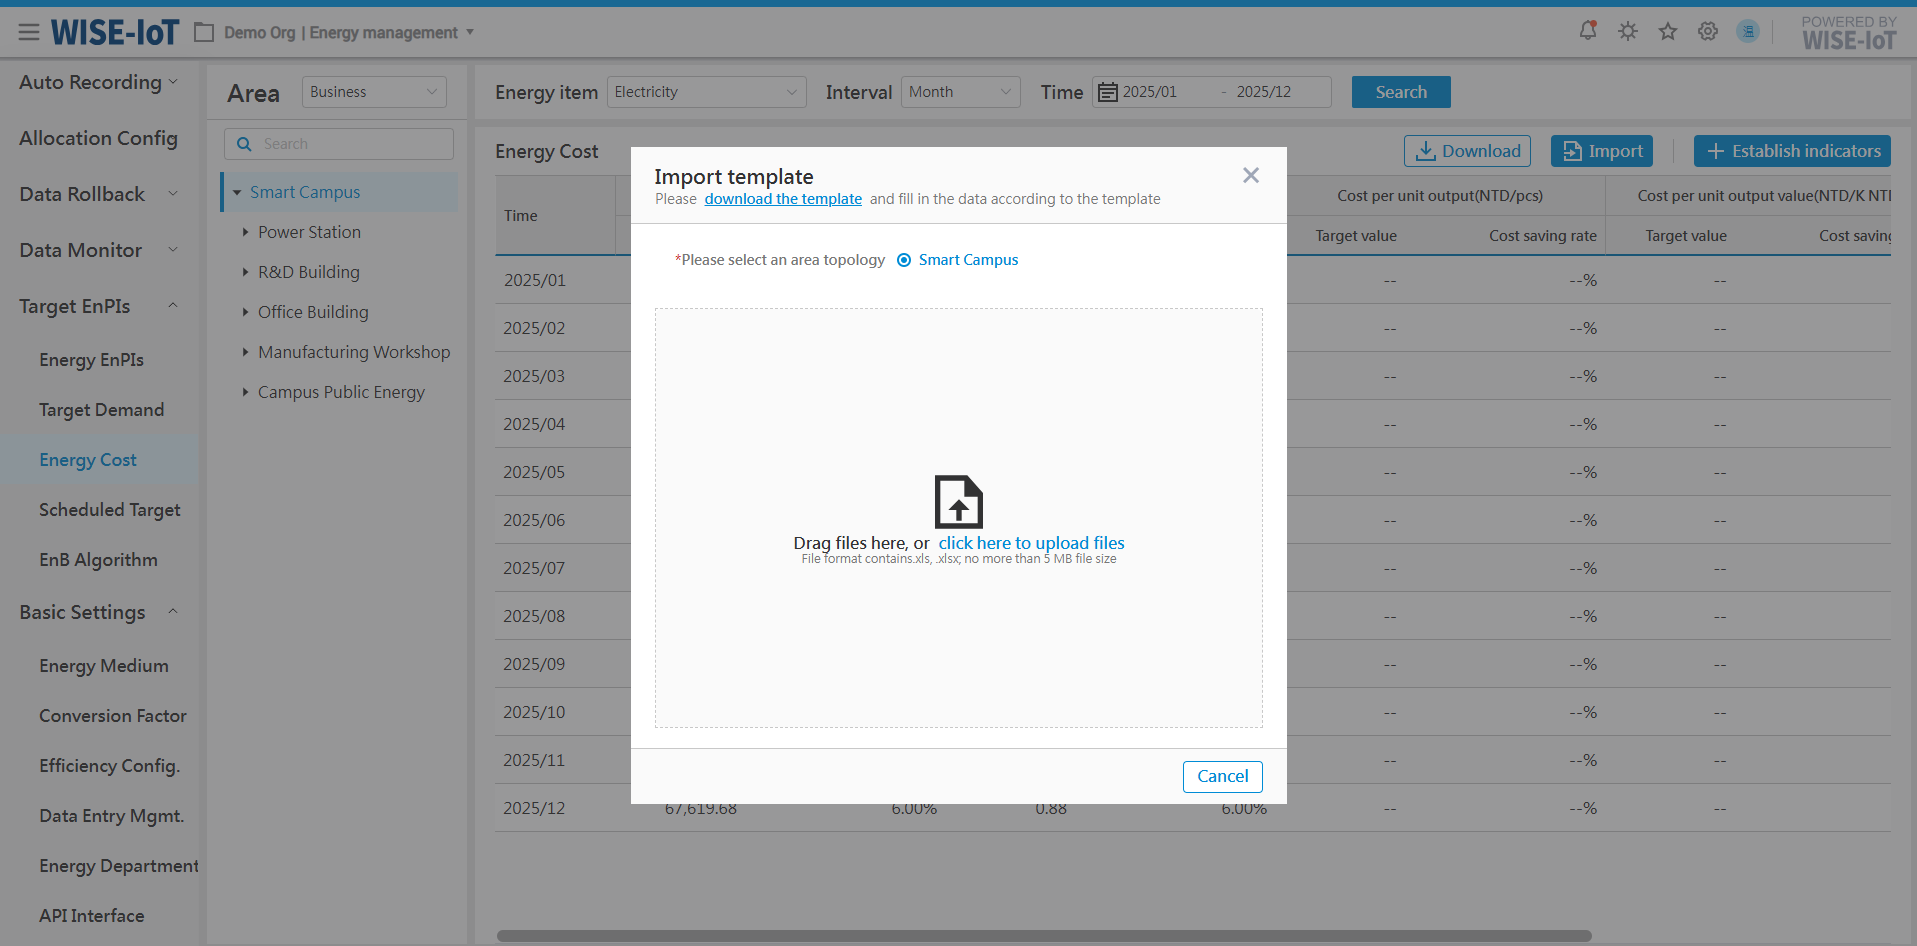
- Then users can access the imported energy cost indicators in the list interface.
Energy Cost Indicators List
-
In the ECOWatch Energy Management System, select Target EnPIs > Energy Costs in the menu on the left to access the Energy Cost Indicators List interface.
-
In the interface:
(1) Support selecting area nodes based on "business structure" to view corresponding indicators;
(2) Support selecting area nodes based on "energy department" to view corresponding indicators;
(3) Energy cost indicators vary by energy type. The system supports data querying by energy types.
(4) Support viewing data by time granularity (year/month/day);
(5) Click "Download" to export data in Excel.
Add Energy Cost Indicators
- Click "Formulate Indicators" in the Energy Cost Indicators List:
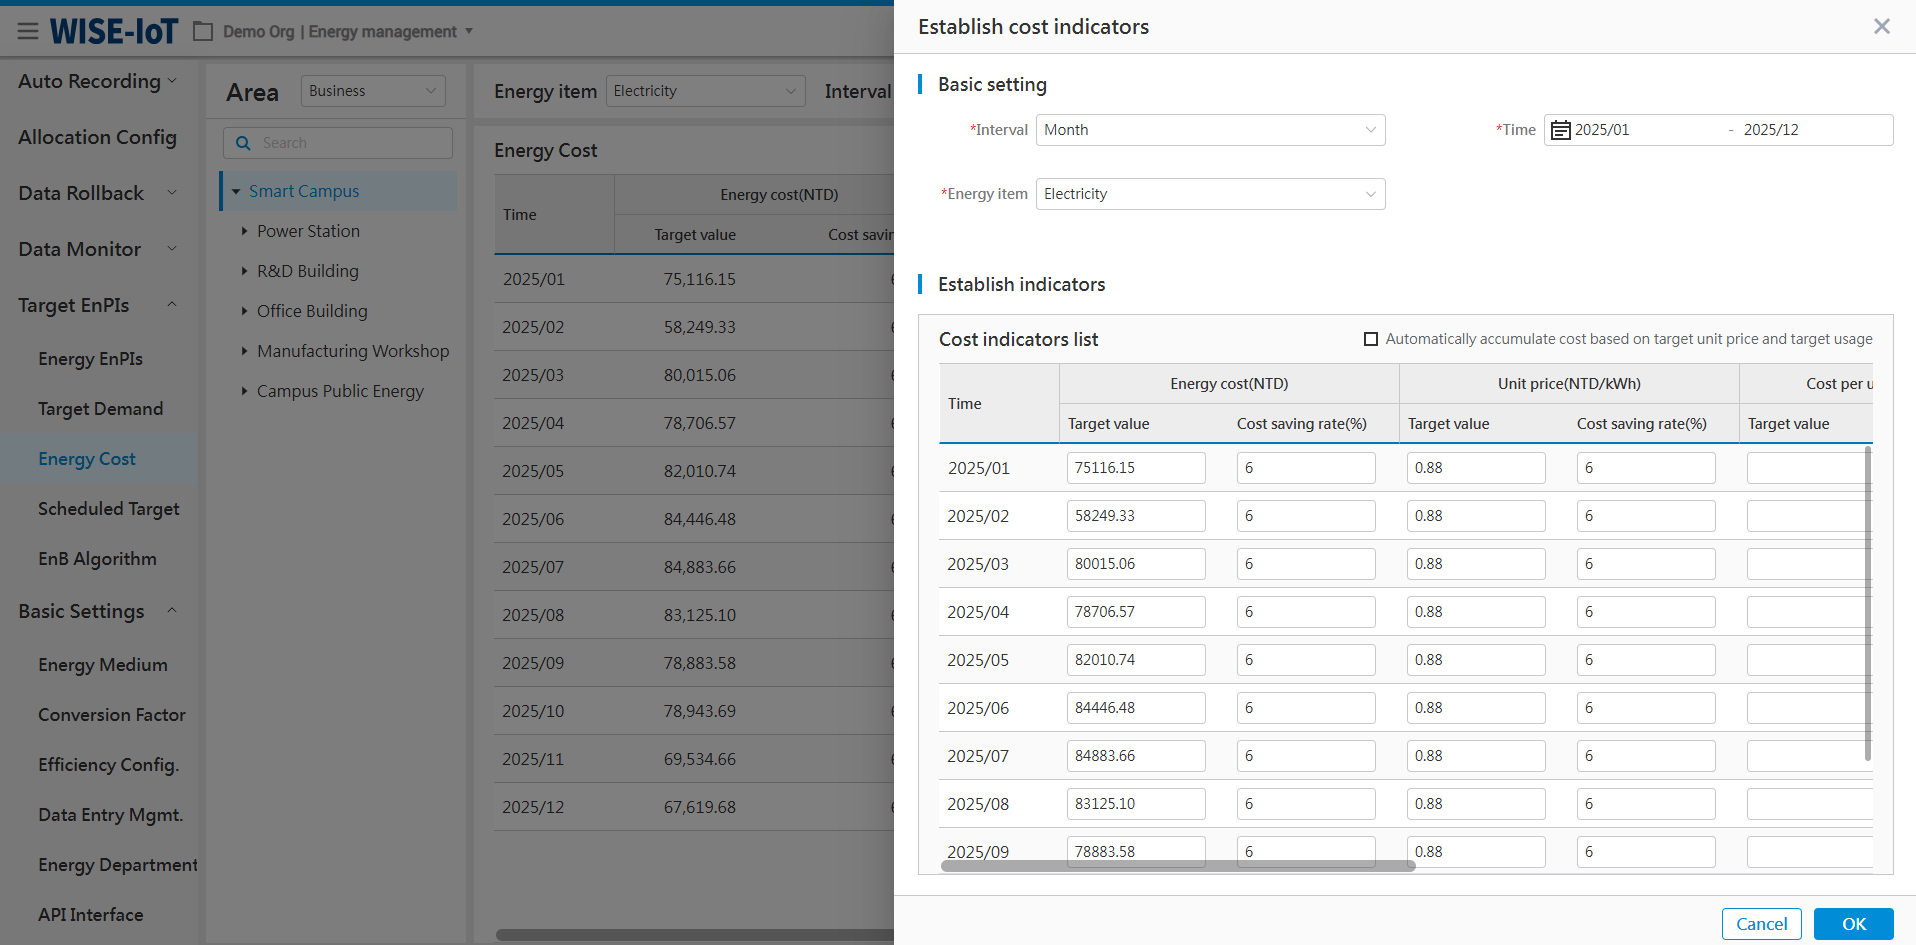
-
Before setting energy cost indicators, configure basic information including the time range and the energy type for the indicator.
-
Manual formulation: Manually enter the energy cost indicators of the selected area.
(1) Support setting target values for energy unit price, energy cost, cost per unit output value, cost per unit output, cost per unit area, and cost per capita and energy-saving rates. (Note: Only numeric values are allowed here)
(2) After selecting "Calculate Energy Cost Based on Target Unit Price and Target Usage" in the upper-right corner of the interface, the system will automatically calculate the target energy cost using the formula "Energy Cost = Target Unit Price × Target Usage and populate the result into the system.
(3) Click "Ok" to save the data.
Modify Energy Cost Indicators
The system permits modifications or redefinitions of energy cost indicators. The process is the same as adding energy cost indicators.
-
Click "Establish Indicators" to enter its formulation page;
-
Select the energy type and time range to be modified to filter out indicators;
Adjust the indicators in the module.
Basic Settings
Energy Medium
Energy medium refer to various types of energy consumed by enterprises during production, such as electricity, industrial water, compressed air, nitrogen, etc.
The ECOWatch system is pre-configured with common energy items. Users can delete or add pre-configured data according to actual site conditions. The system supports multiple languages, requiring users to manually input translations of different languages.
In the menu bar on the left, click Basic Settings > Energy Medium:
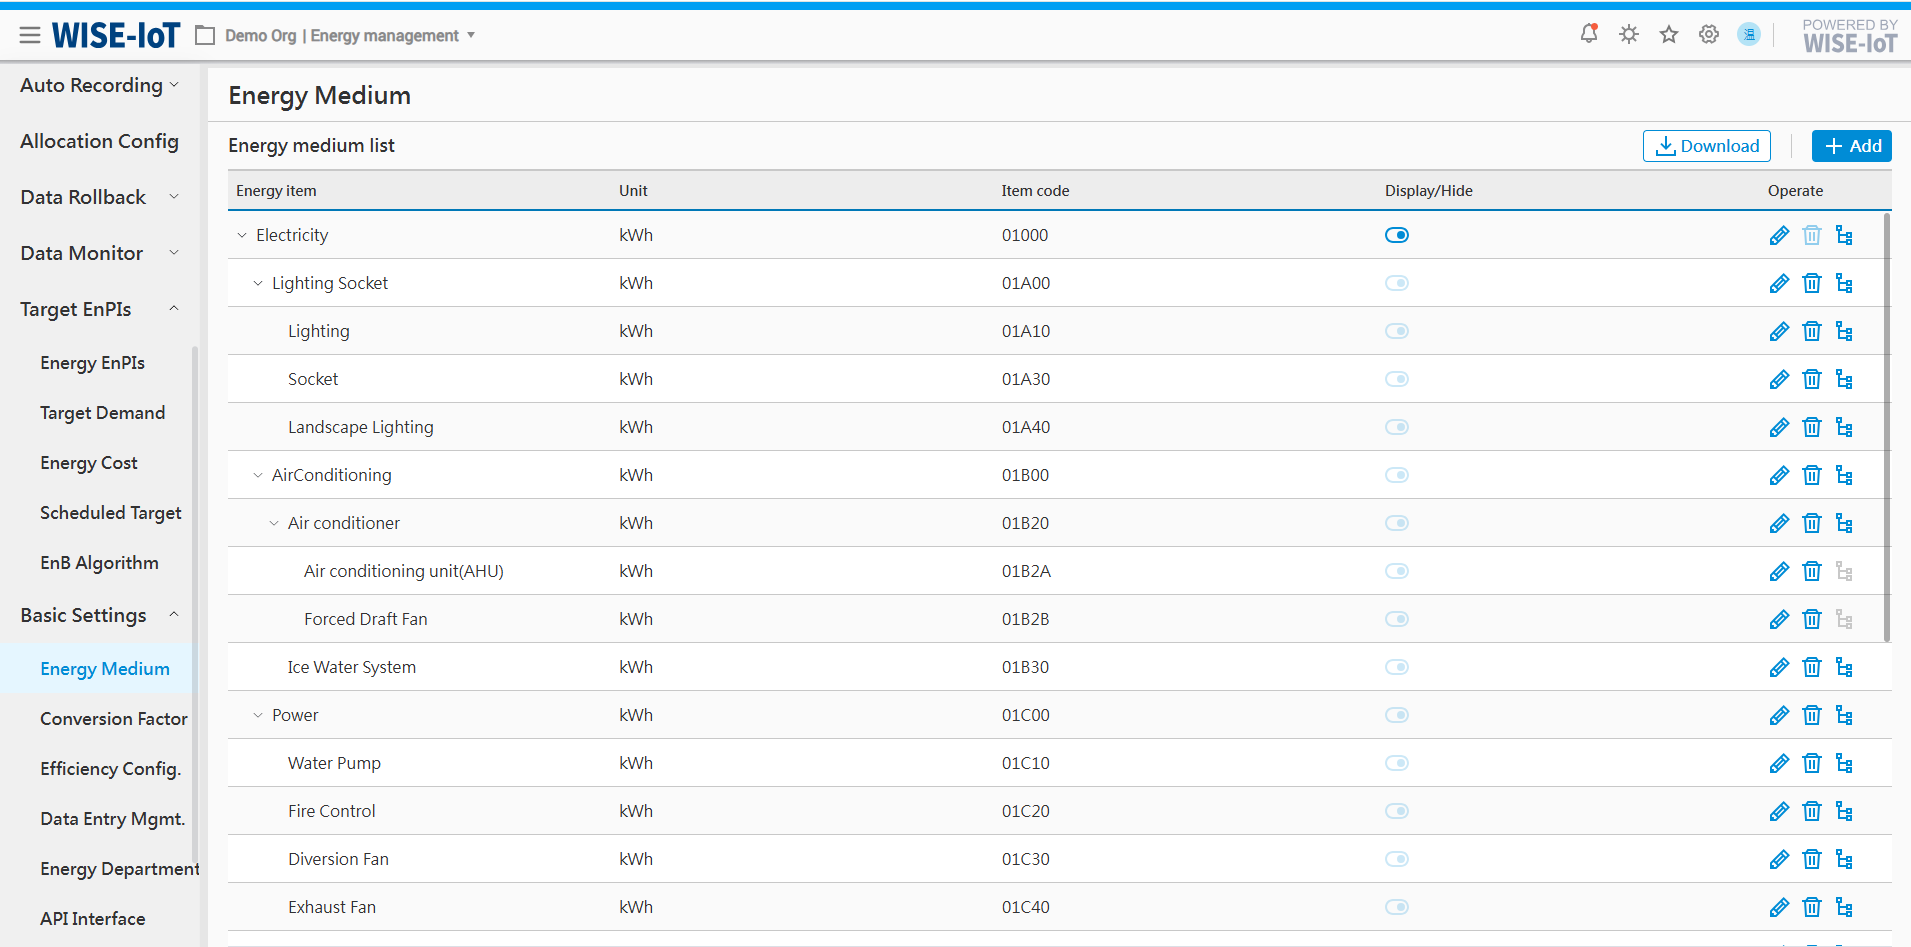
Add Energy Types
Click[Add Energy Type]to navigate to the Type Creation page.
- Enter basic information for the energy type, such as name, unit, and whether it is included in total energy usage calculations.
If it is not included, select "No". In this case, when calculating comprehensive energy usage on the Total Energy Usage Analysis page, this energy type will not be counted.
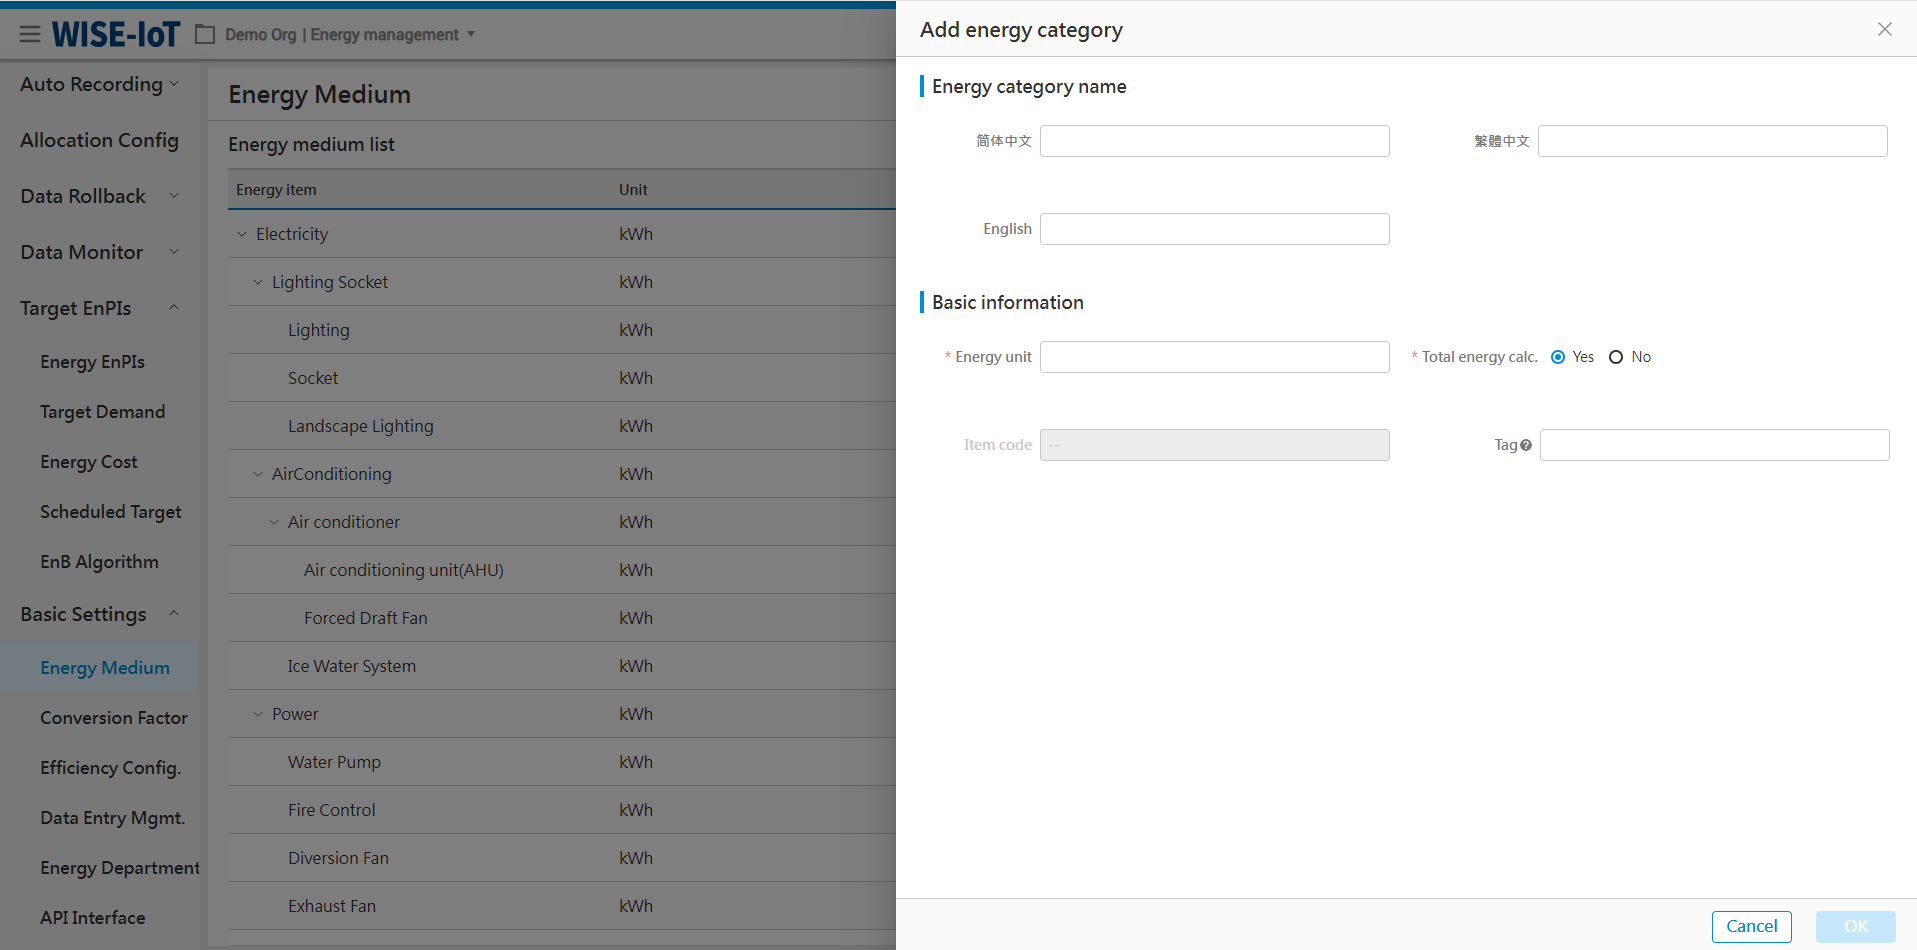
- After adding an energy type such as electricity, click
 on the right of Electricity to access the energy type editing page.
Add Energy Sub-items
Click Energy Medium > Energy Medium List, and click ![]() next to an energy type to add its sub-item.
next to an energy type to add its sub-item.
- Enter the name of an energy sub-item.
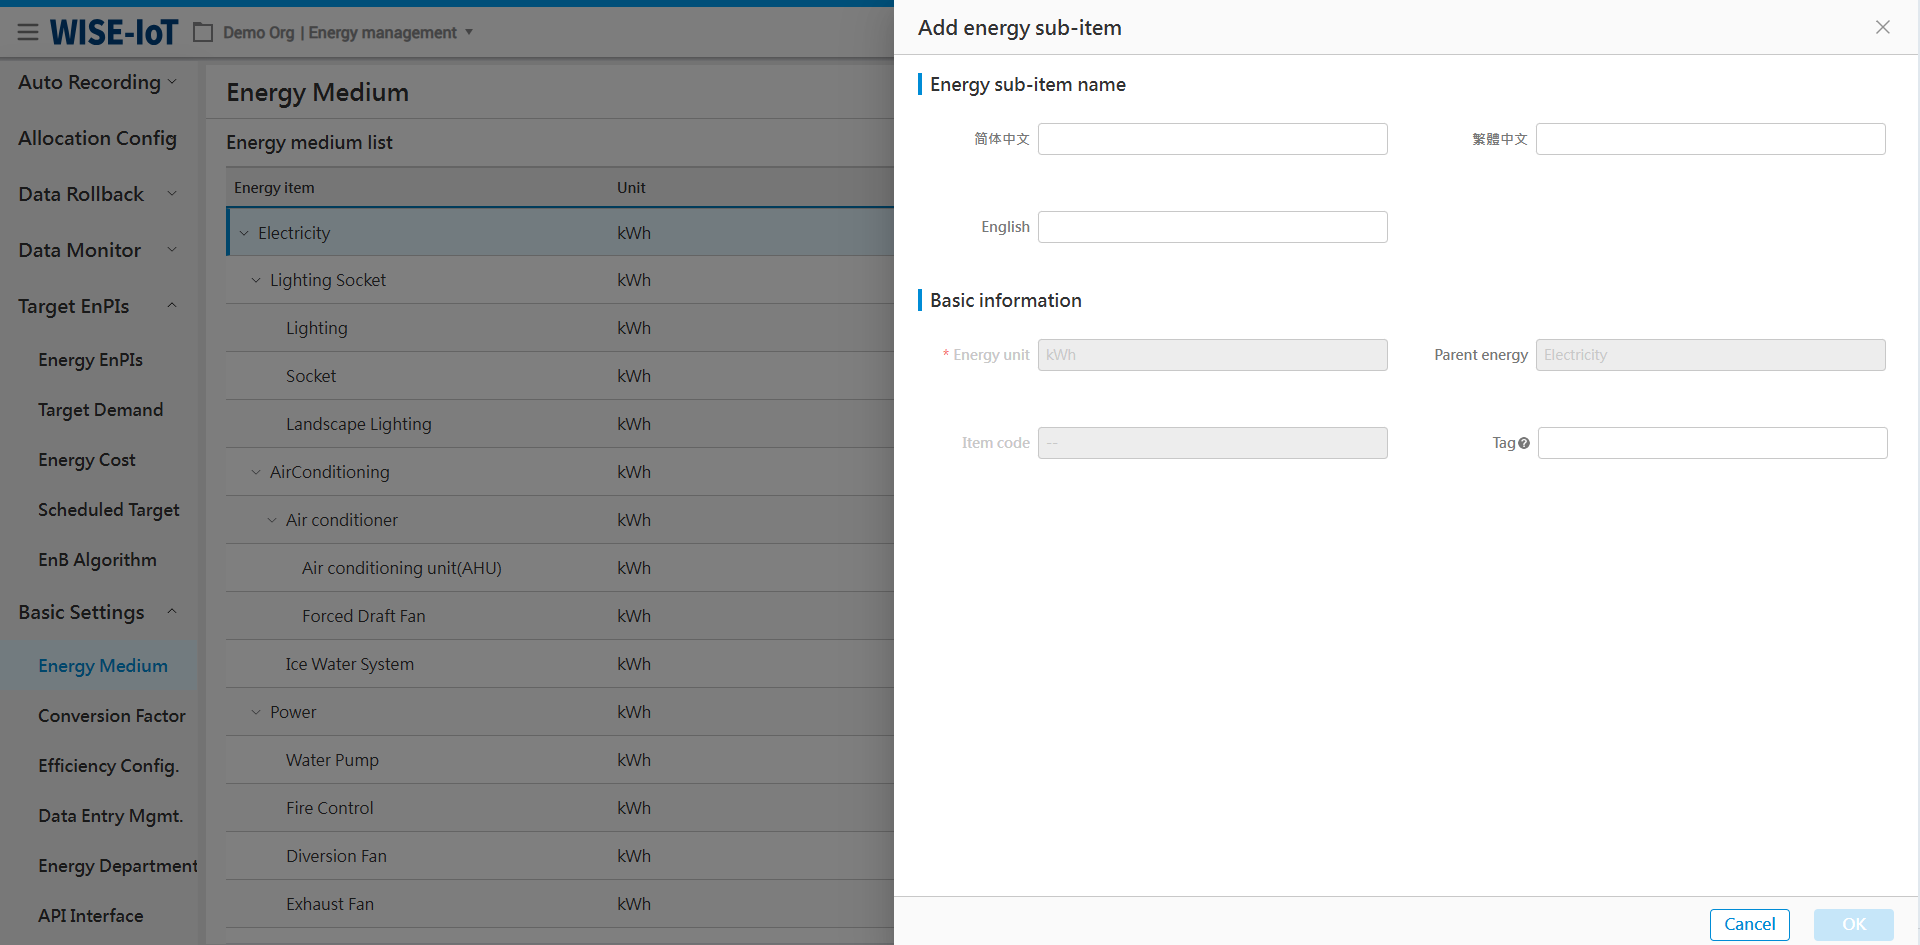
After adding an energy sub-item, users can configure its conversion coefficients in the "Energy Conversion Coefficient" module.
Set Energy Conversion Factors
In the menu bar on the left, click Basic Settings > Conversion Factor to access the its configuration interface.
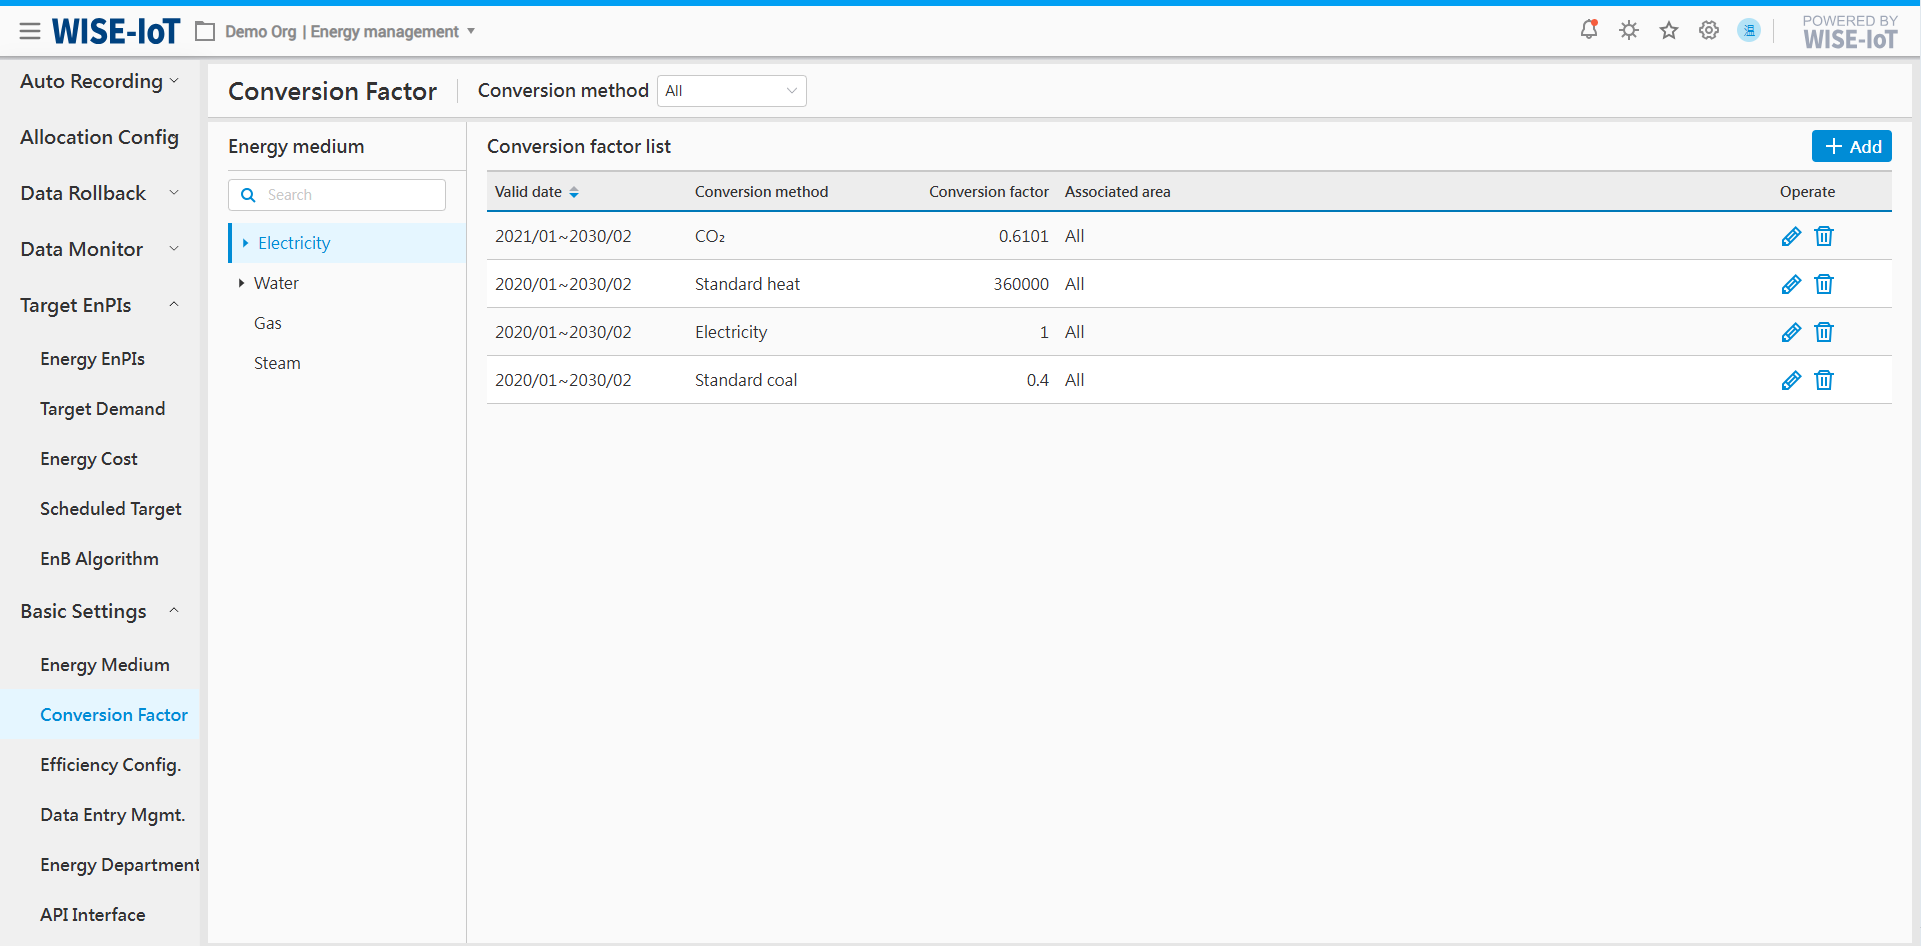
On the Energy Conversion Coefficient page, click an energy type on the right to view its conversion methods, including calculation coefficients for coal equivalent, carbon equivalent, standard electricity, thermal equivalent, oil equivalent.
-
Click "Add" to access the energy sub-item's Coefficient Creation interface.
-
Click "
 " to modify conversion coefficients in the Energy Conversion Coefficient list.
 -
Click "
 " to remove a coefficient.
Add Conversion Factors for Energy Types
Click[Add]on the right of the coefficient list to access its creation interface.
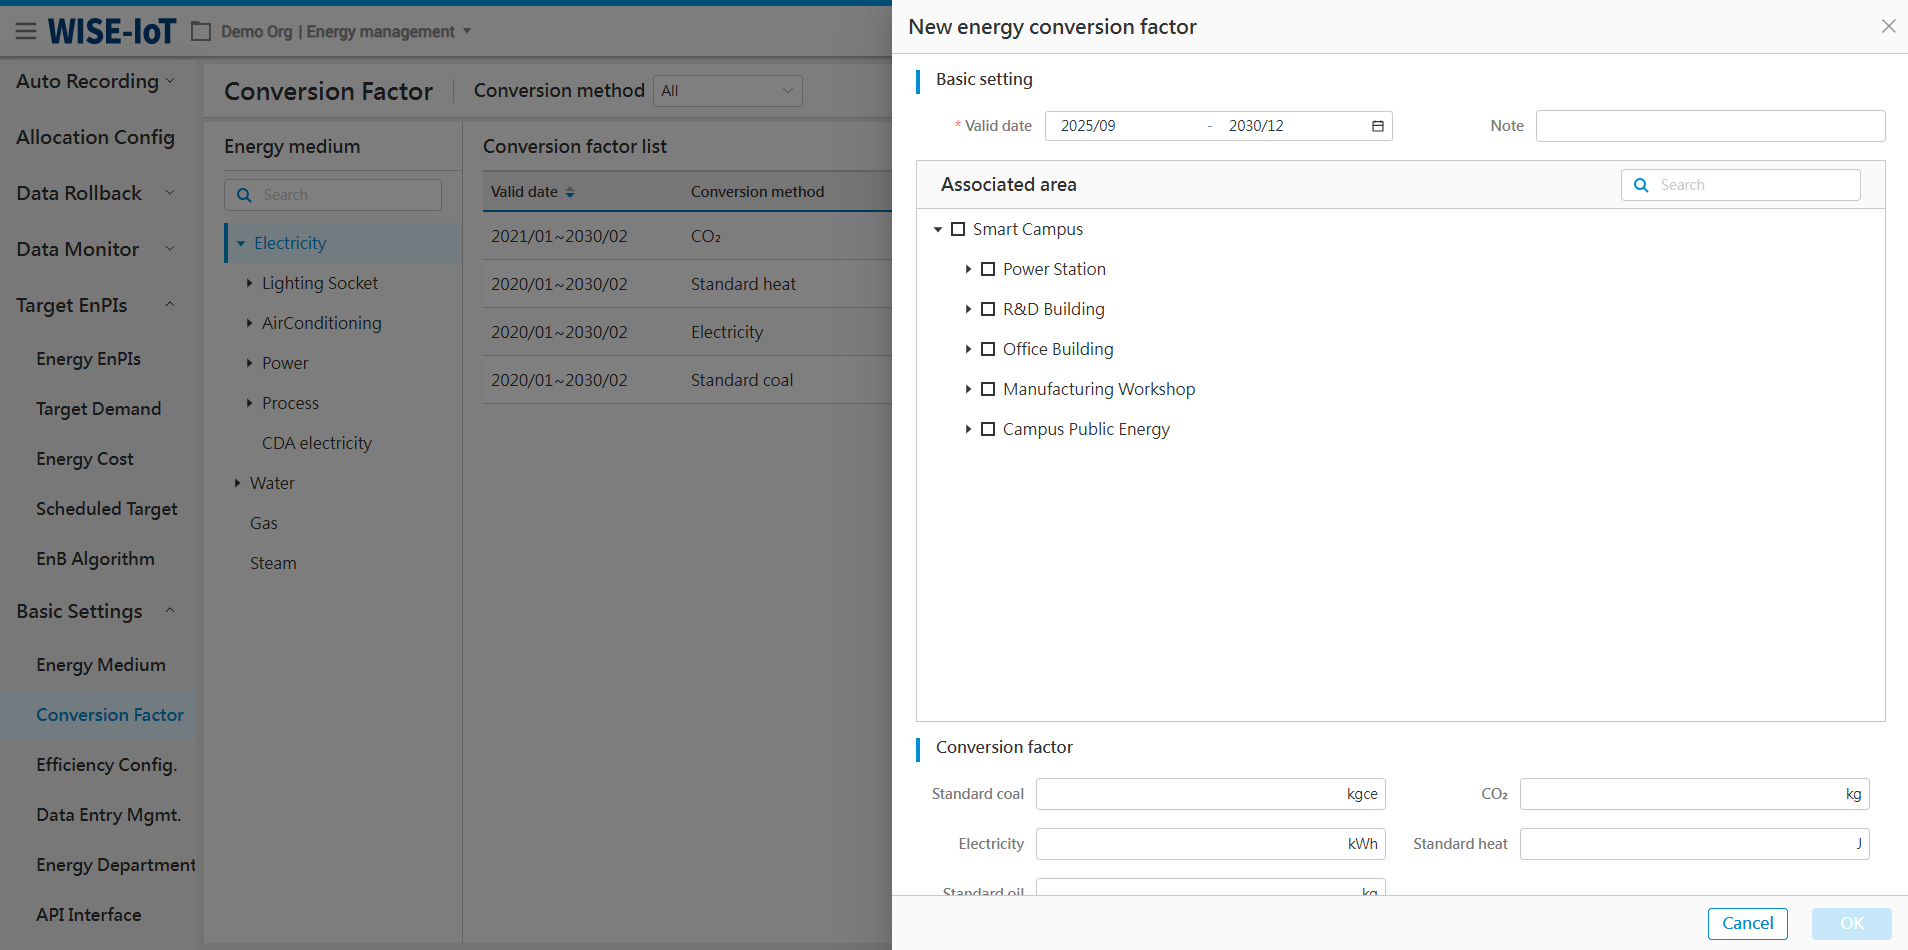
-
Enter the effective time range for the conversion coefficients.
-
Select associated areas for calculating total energy usage in the [Usage Statistics] interface.
-
Input conversion coefficients for coal equivalent, carbon equivalent, standard electricity, thermal equivalent, and oil equivalent.
Then the system generates different data rows based on conversion methods.
Click "![]() " in the list to modify a coefficient. The step is the same as adding a coefficient.
" in the list to modify a coefficient. The step is the same as adding a coefficient.
Add Conversion Factor for Energy Sub-items
For energy sub-items, the system defaults to using the conversion coefficient same as the parent level.
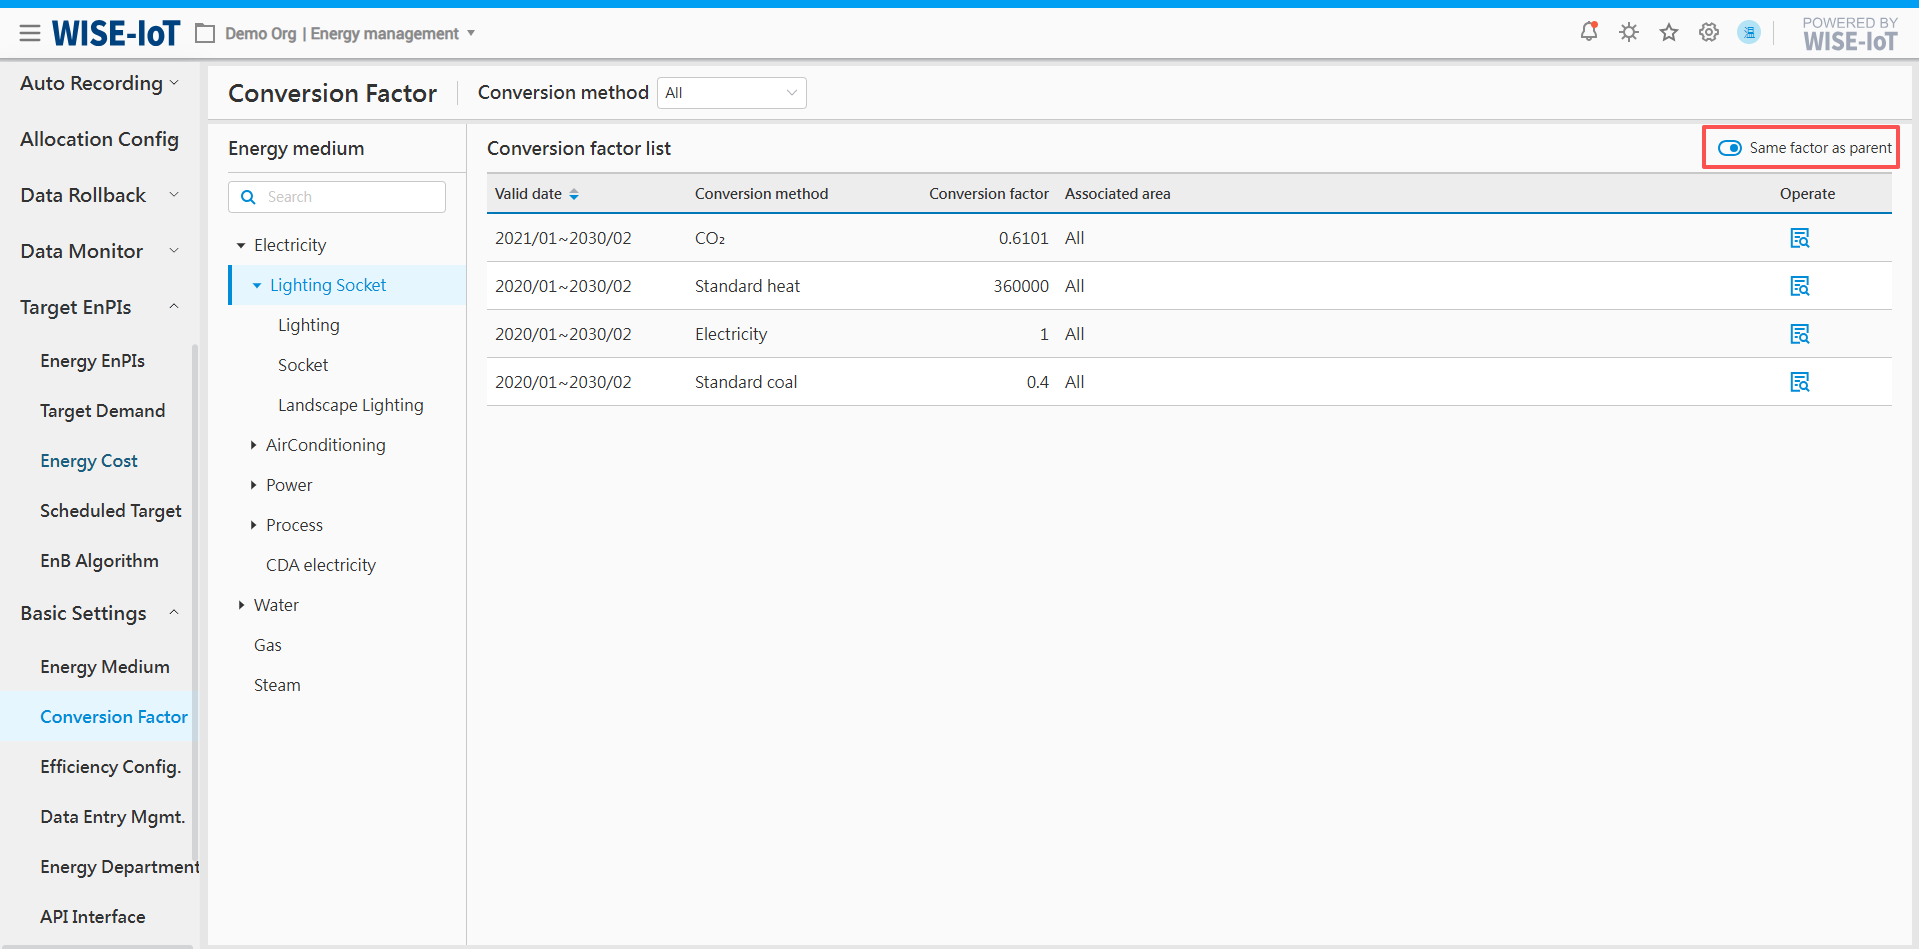
If the energy sub-item' conversion coefficient differs from its parent type, disable the "Same as Parent" toggle switch.
The customization button is grayed out. Users can click "Add" to configure energy conversion coefficients for the sub-item. This process is the same as adding conversion coefficients for energy types.
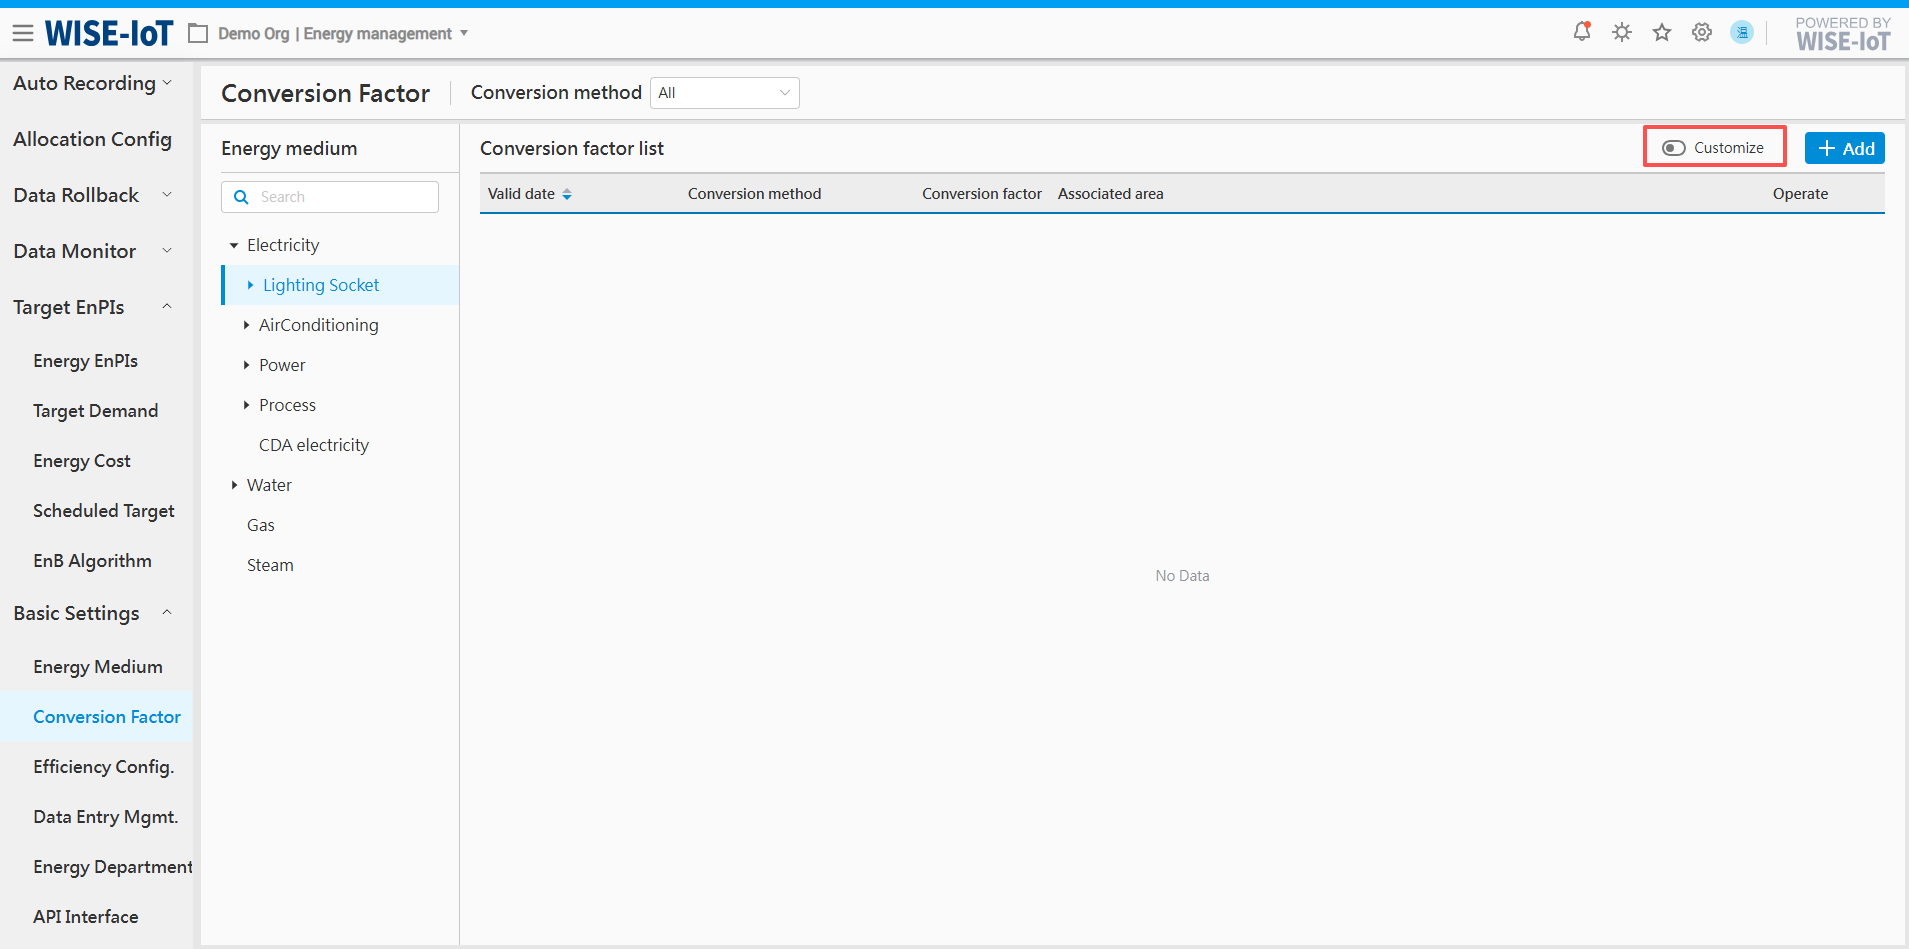
※ Notes: Please configure conversion coefficients based on the actual conditions on the site. If no conversion coefficient is configured, the system will include the energy type's usage in the comprehensive energy usage calculation by default.
Efficiency configuration
This module mainly serves the [Device Efficiency] analysis module. If not configured here, the Device Energy Efficiency analysis page will not display data.
Before performing equipment energy efficiency configuration, implementation personnel need to prepare for or be clear about the following work:
-
What equipment needs to be established?
-
What is the energy efficiency formula for these devices?
-
Where are the data sources for each element in the equipment energy efficiency formula?
-
Does the customer need to configure an energy efficiency threshold? What is the threshold range? What is the threshold time granularity?
Device List
Click Basic Settings >> Efficiency Config., enter the device-related configuration page, as shown in the figure below:
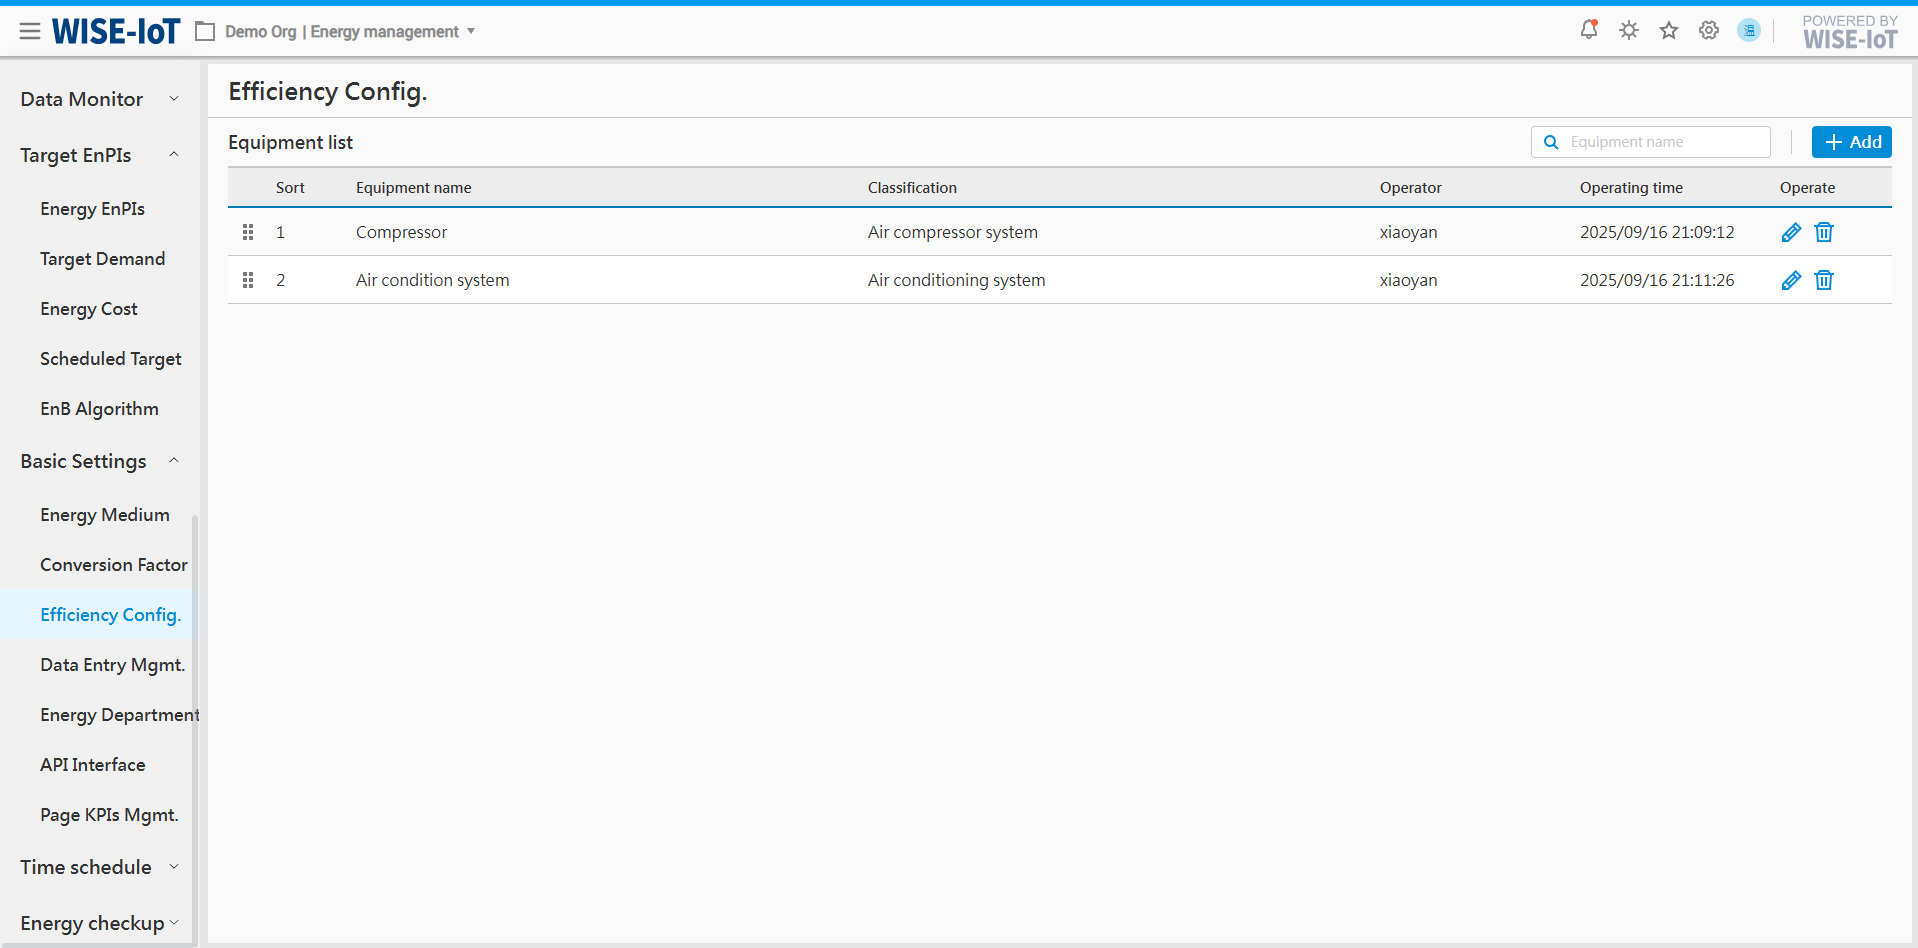
The initial page is empty, newly added device information will be displayed here.
-
Click "
 " button, which can adjust the display order of the device;
 -
In the "Device Name Search" field, enter device information, supporting fuzzy search.
-
Click the "New" button to enter the device energy efficiency formula configuration page;
-
Click "
 " button, go to the device information update page;
 -
Click "
 " button, can delete this device.
Device Add/Edit
On the Add/Edit page, the following needs to be configured:
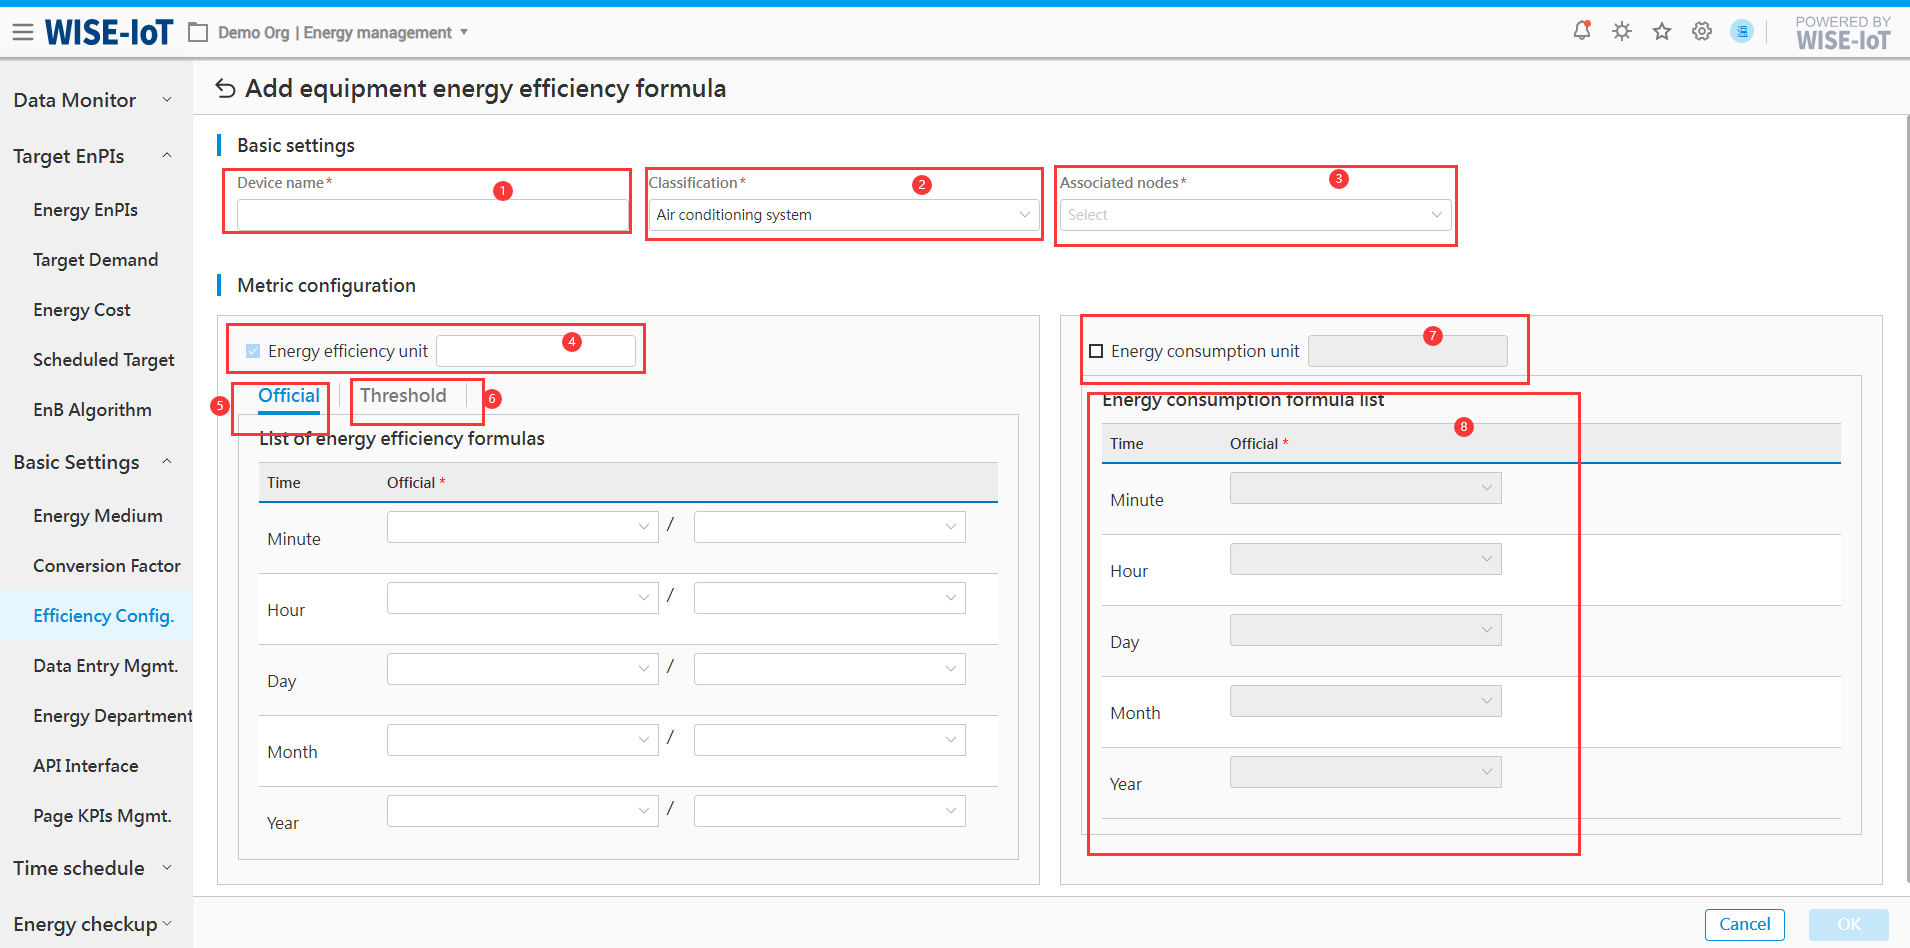
-
Device Name: Enter device name information, which will be displayed in the filtering conditions on the [Device Energy Efficiency] page in the future, and presented on the graphical page;
-
Classification: Default includes HVAC systems, air compression systems, process equipment. If your desired category is not available, you can customize the input and add it by pressing the 'Enter' key. In the future, it will be presented as a filter condition on the [Equipment Energy Efficiency] page.
-
Associated Nodes: Select a business topology for ECOWatch;
-
Energy efficiency unit: Required, enter the unit information of the device;
-
Official(Energy Efficiency Formula): Available at minute, hour, day, month, and year granularities, please configure a complete calculation formula for at least one time dimension. Specifically, the formula dropdown options support calculation items from the usage analysis component, custom metric component, and script component associated with the selected node.
Here's what to note:
Notes Image caption
If you are using custom metric components or script components, please ensure that the calculation time of the numerator and denominator in the formula is within the same time dimension, otherwise calculation will not be possible. 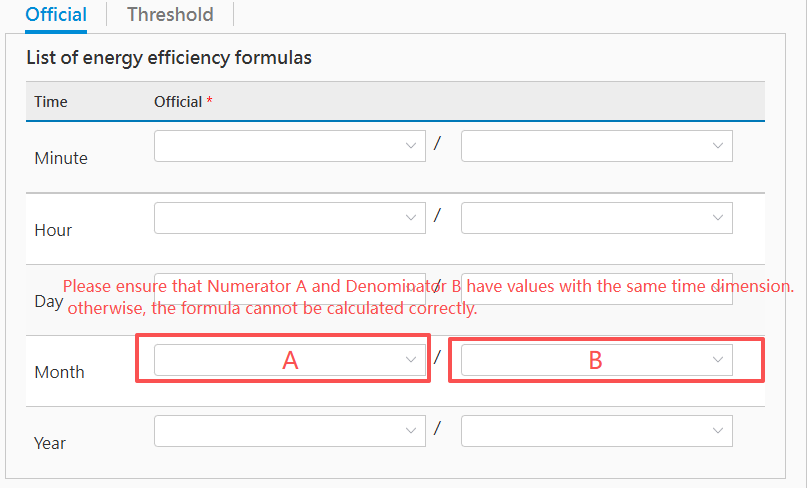
If using a usage analysis component of non-ECOWatch energy classification, please add "_EC" to the attribute name suffix when defining calculation items in APM. 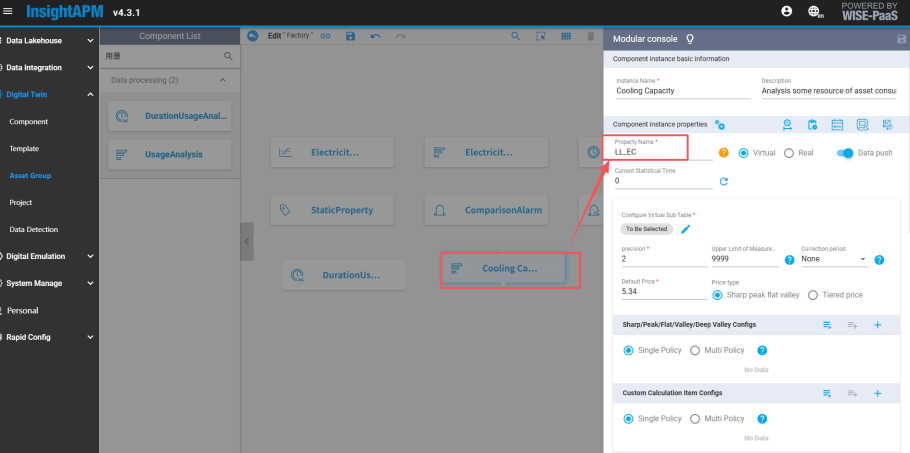
-
Energy efficiency threshold: Click the "Threshold" tab to enter the threshold configuration page. This step is not mandatory and can be filled in after subsequent users have determined the threshold.
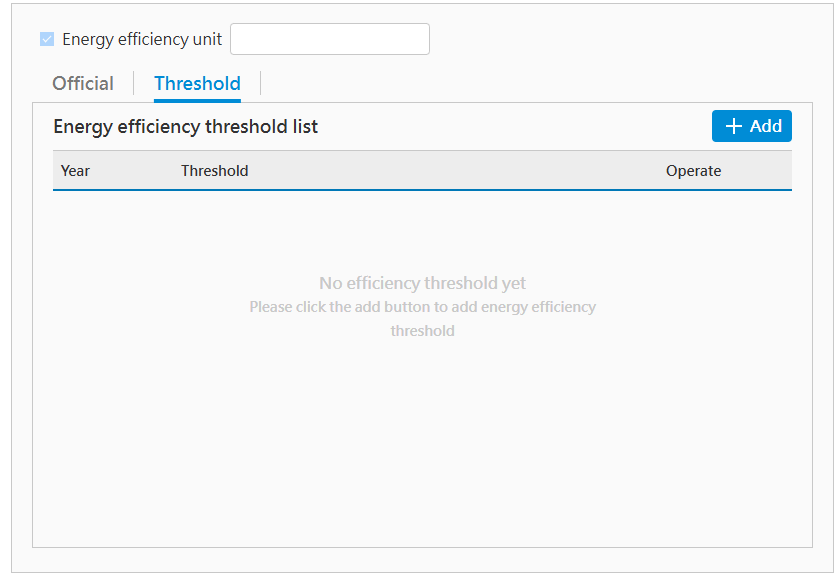
(1) Click the "Add" button to enter the New Threshold Page, as shown below:
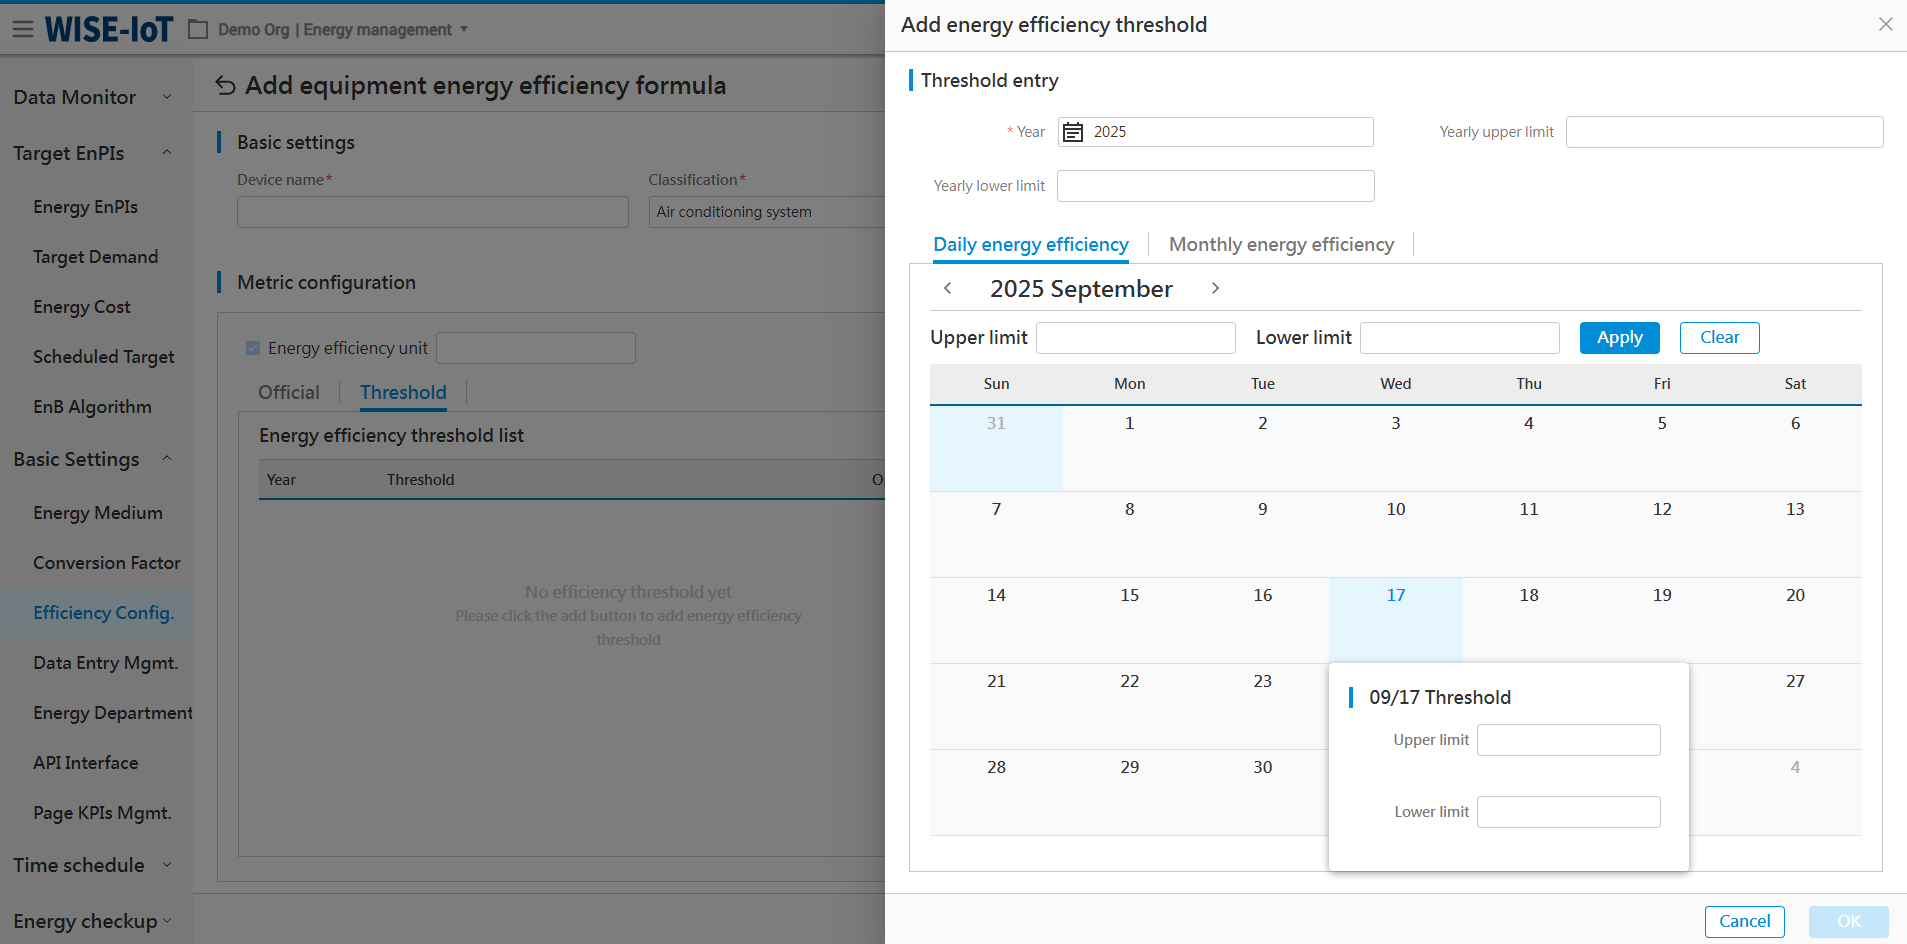
(2) Supports threshold settings at year, month, and day granularity.
(3) If the user's daily and monthly thresholds are the same, you can enter the upper limit and lower limit below, click the "Apply" button, and this will allow you to batch fill the thresholds for the corresponding dates, as shown in the figure below:
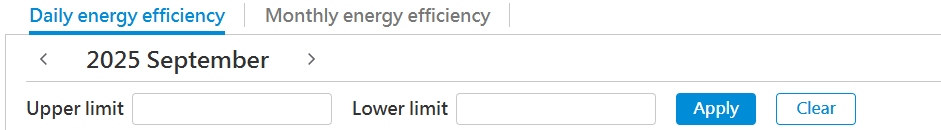
(4) After the settings are complete, click the "OK" button to save.
The threshold after successful saving will be displayed on the [Device Energy Efficiency] analysis page in the future.
-
Energy consumption unit: If energy consumption information needs to be presented on the energy efficiency analysis page of this device, please now "Check to display, then set energy consumption unit;
-
Energy Consumption Formula: If energy consumption is to be displayed, please configure the corresponding time-granularity energy consumption calculation items here.
Once the operation on the above information is complete, click the "Confirm" button to save.
Data Entry Mgmt.
The Data Entry Mgmt. module records enterprise/department area, headcount, energy usage, output value, output, and energy unit prices.
Enter Area
Click Basic Settings > Data Entry Mgmt. > Building Area to enter the area information.
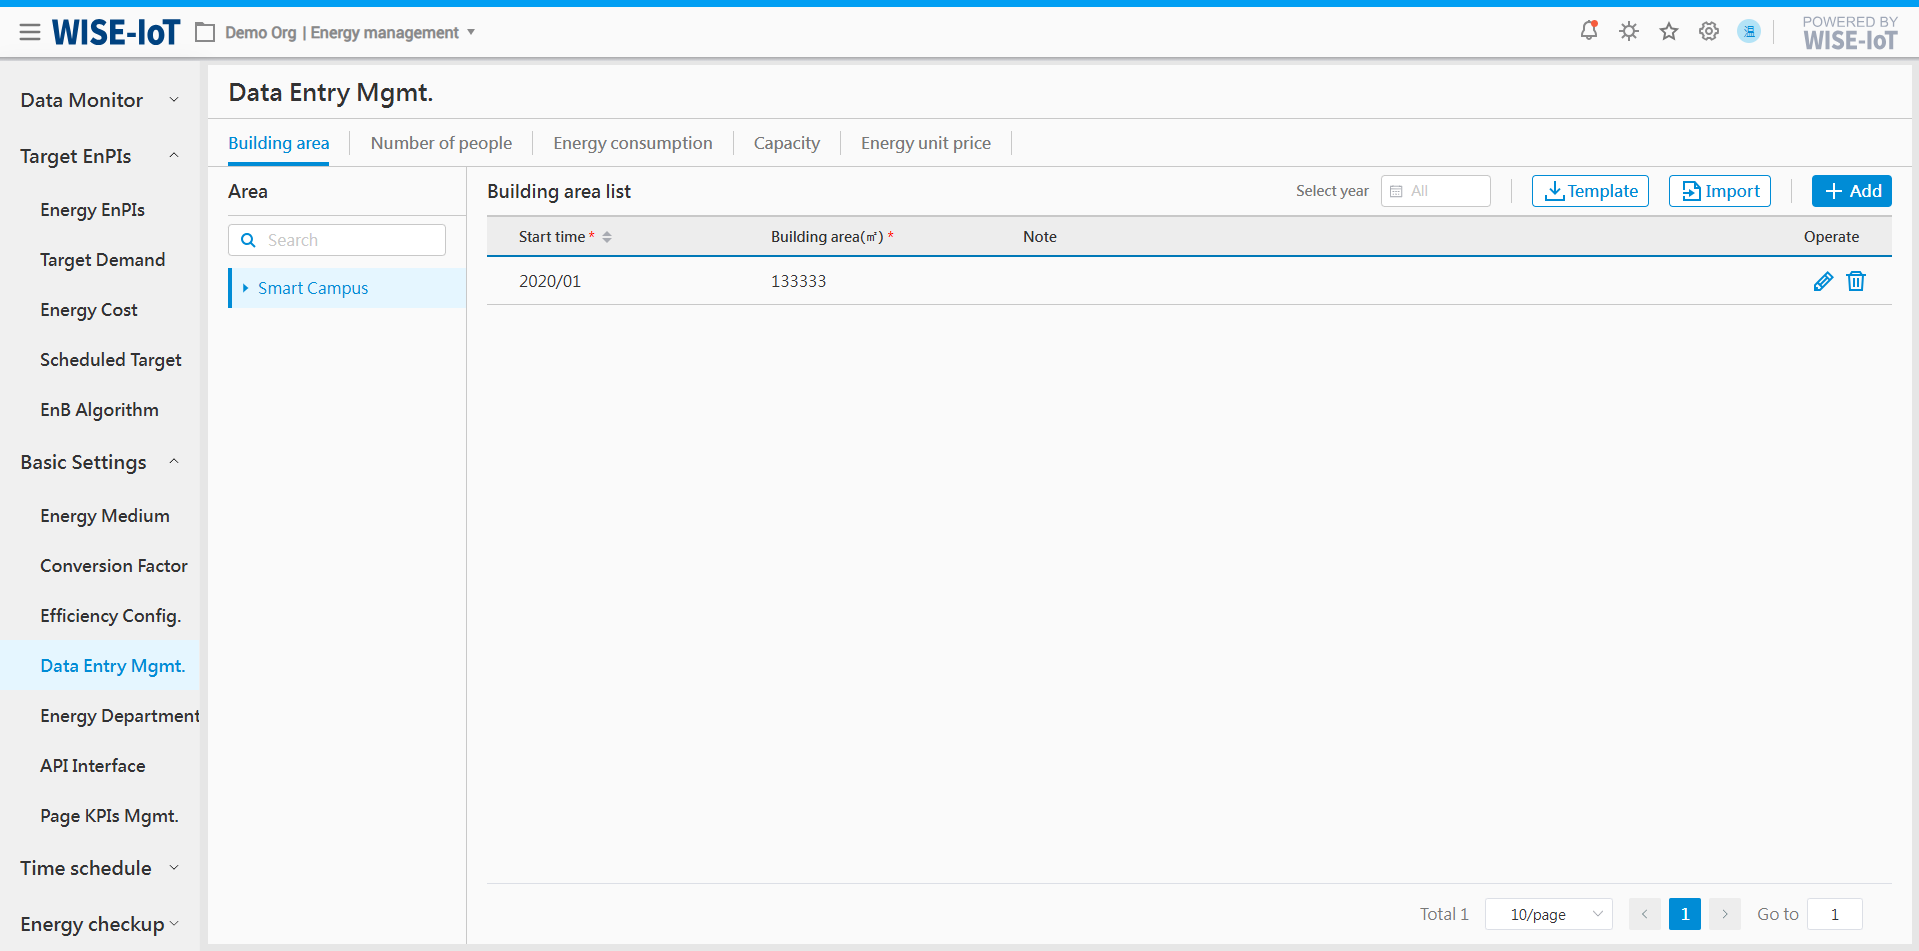
Import Area Data
-
Click [Template] to obtain the ECOWatch Building Area's import template.
-
After completing the template according to formatting requirements, select the corresponding area topology before clicking [Import]. The system will verify whether the data is imported based on the content. Imported data can be reviewed in the Building Area list.
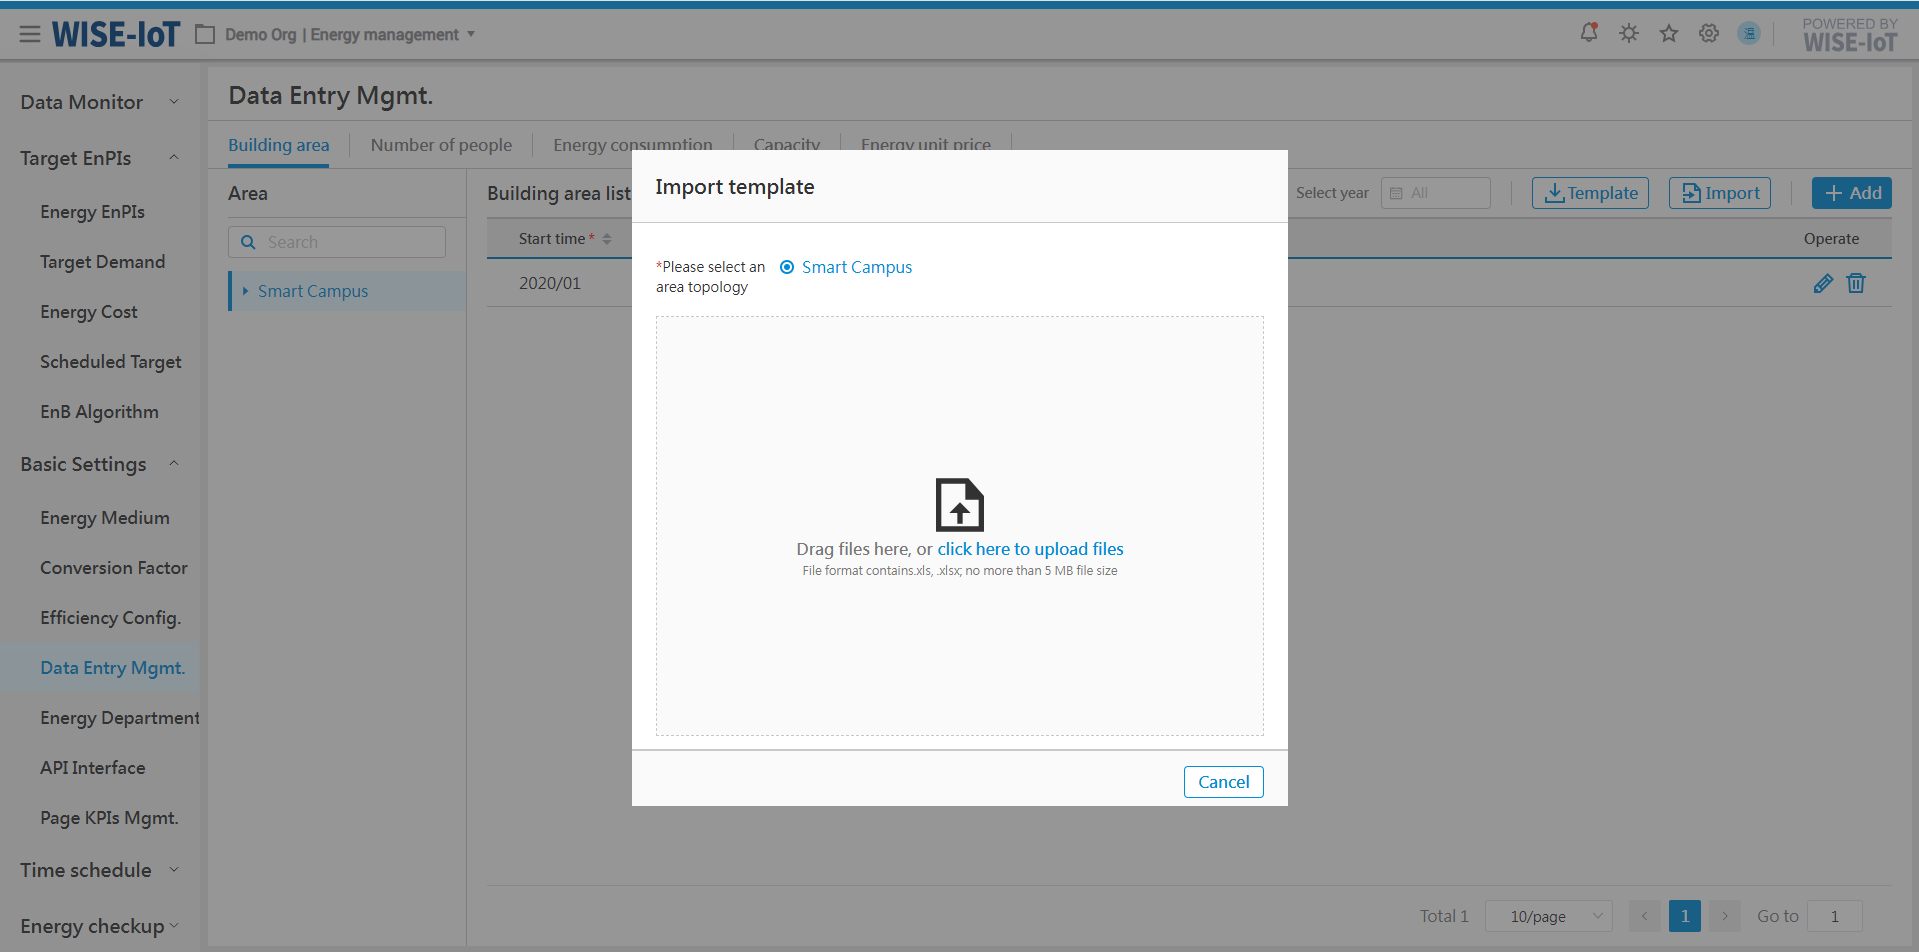
Enter Area Data
- On the Building Area List page, click [Add], and a new row of data will be appended to the list.
Note: The data entered here corresponds to the area selected on the right of the interface.
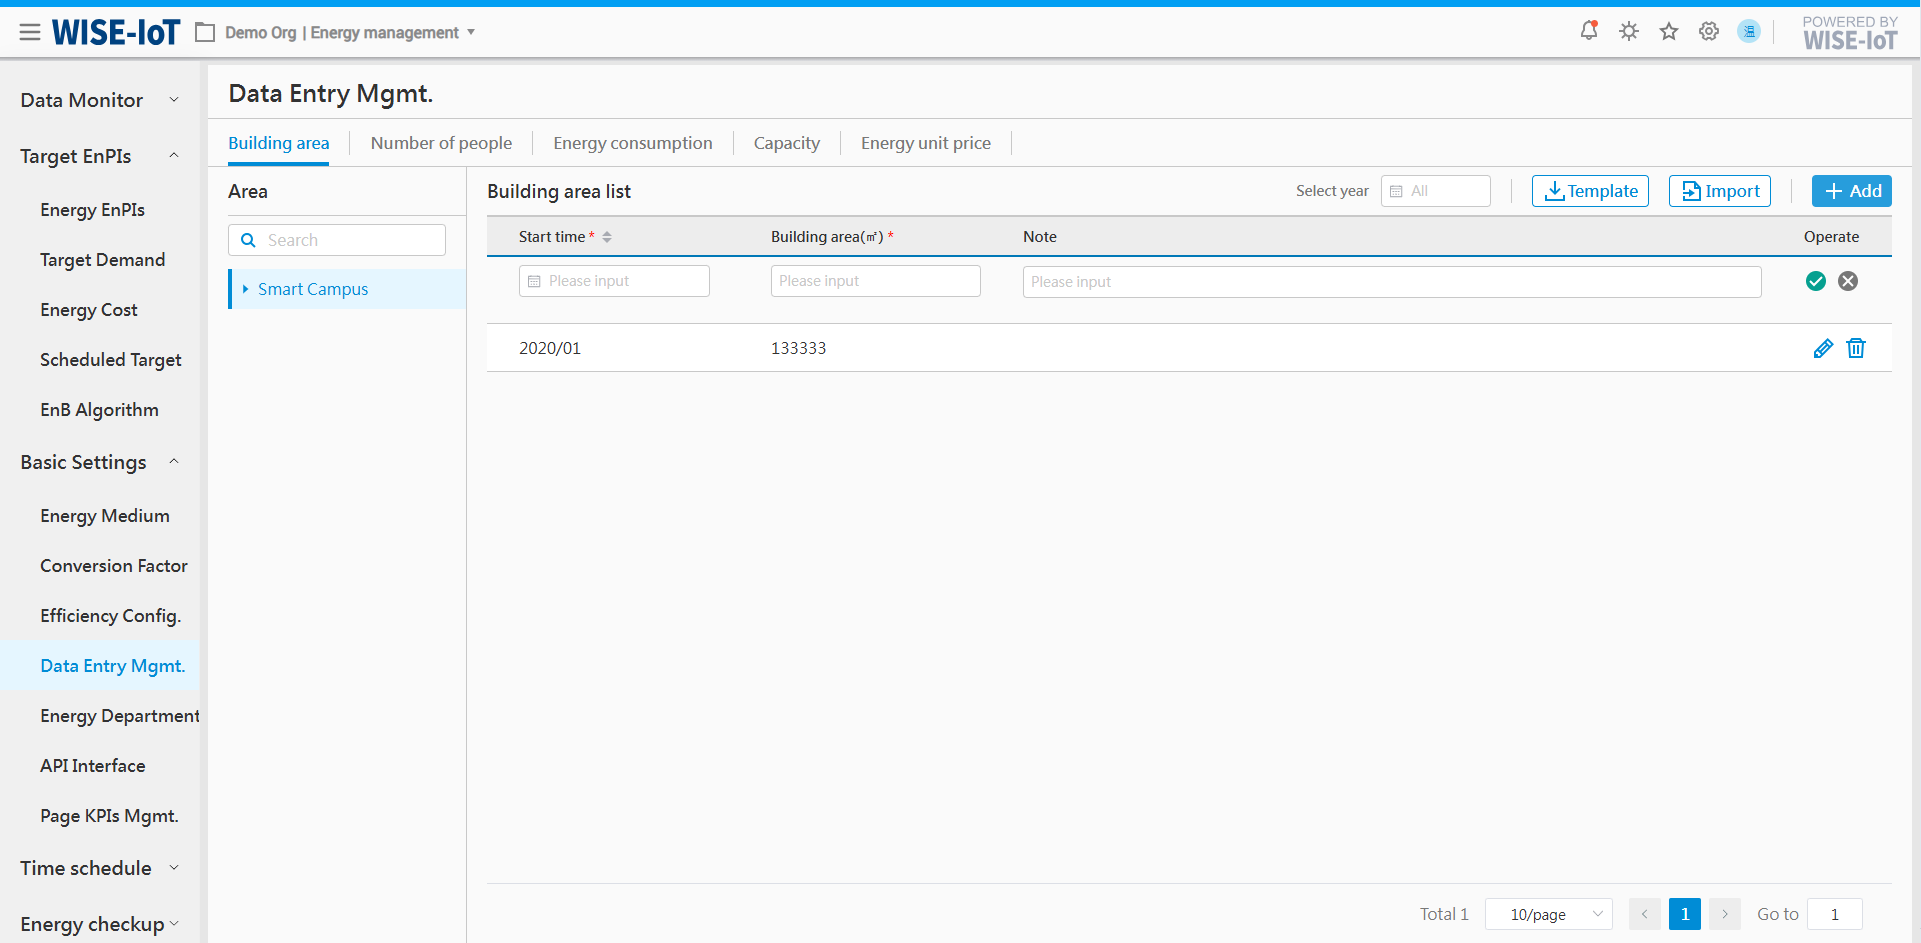
- Select the effective date for the building area, input the building area, and then click "
 " to [Save] the information. Click "
 " to discard the operation.
Edit Area Data
To modify the area data, select the area in the list, click[![]() ], and the list row will then switch to an editable state.
], and the list row will then switch to an editable state.
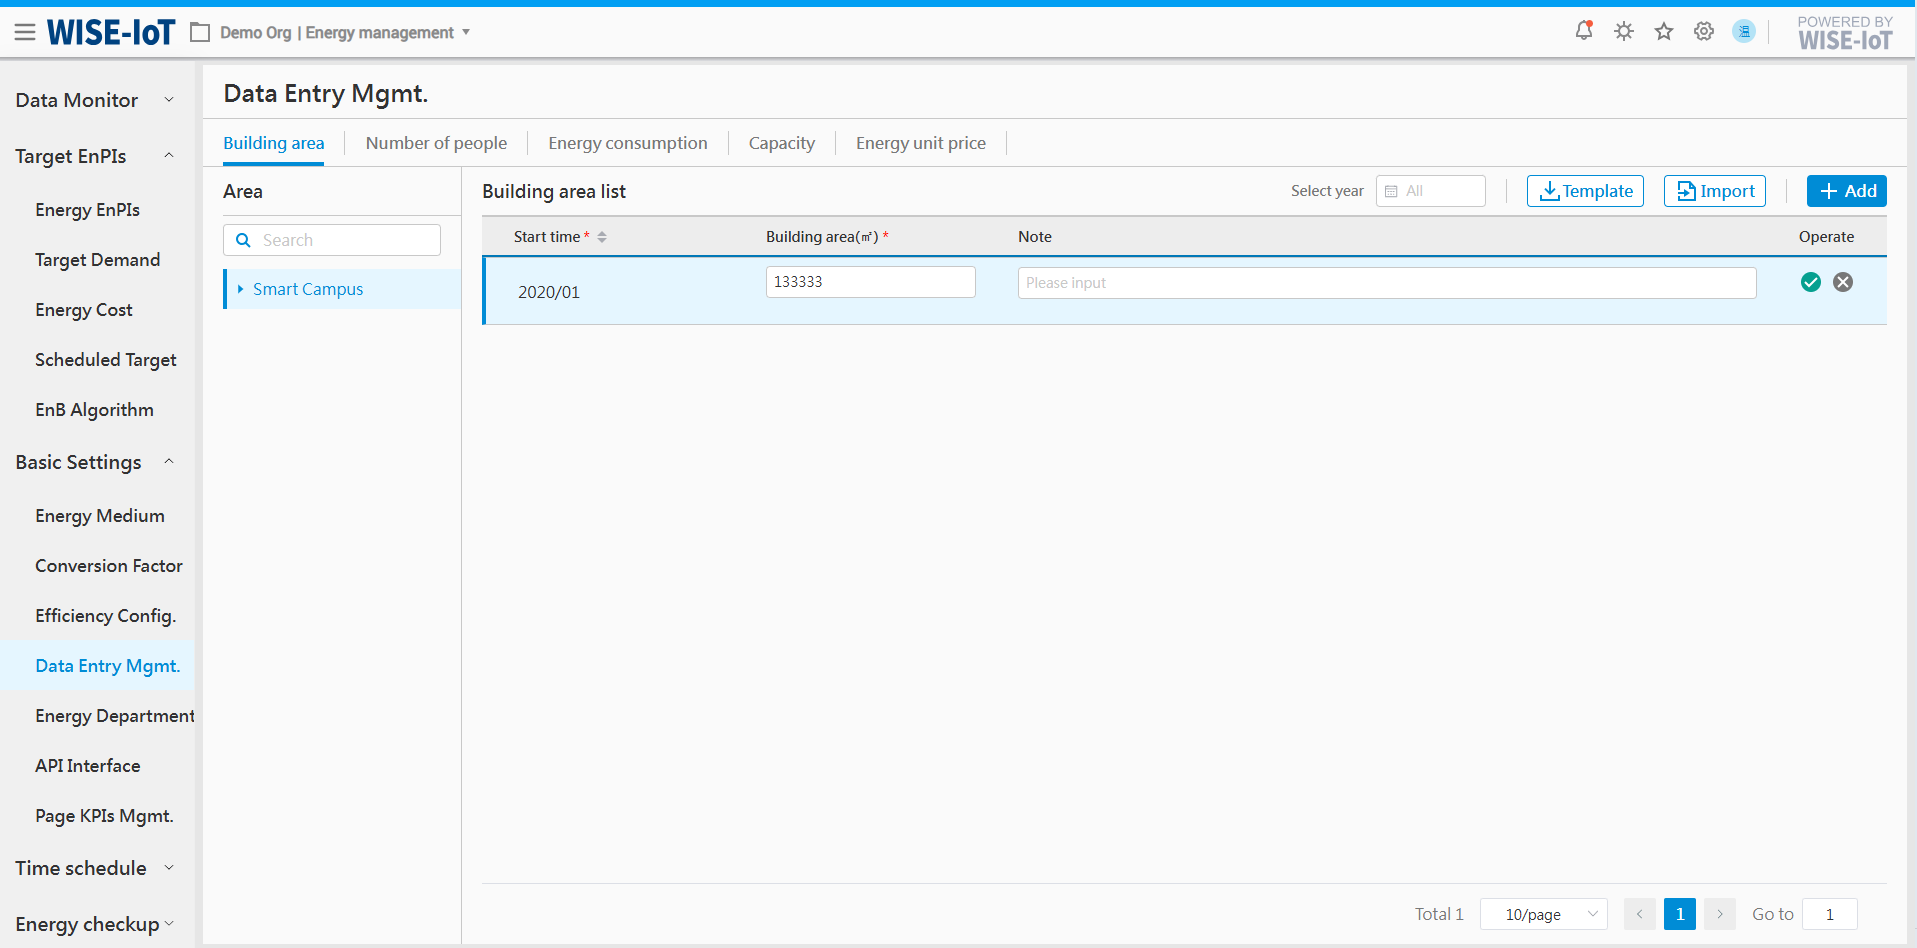
During editing, the effective date cannot be changed whereas the building area and remarks can be modified. Click "![]() " to save the area data and click "
" to save the area data and click "![]() " to cancel the operation.
" to cancel the operation.
Delete Area Data
Select the area data and click[![]() ]to delete it.
]to delete it.
Enter Number of people
Click Basic Settings > Data Entry Mgmt. > Number of people tab to access the Input interface.
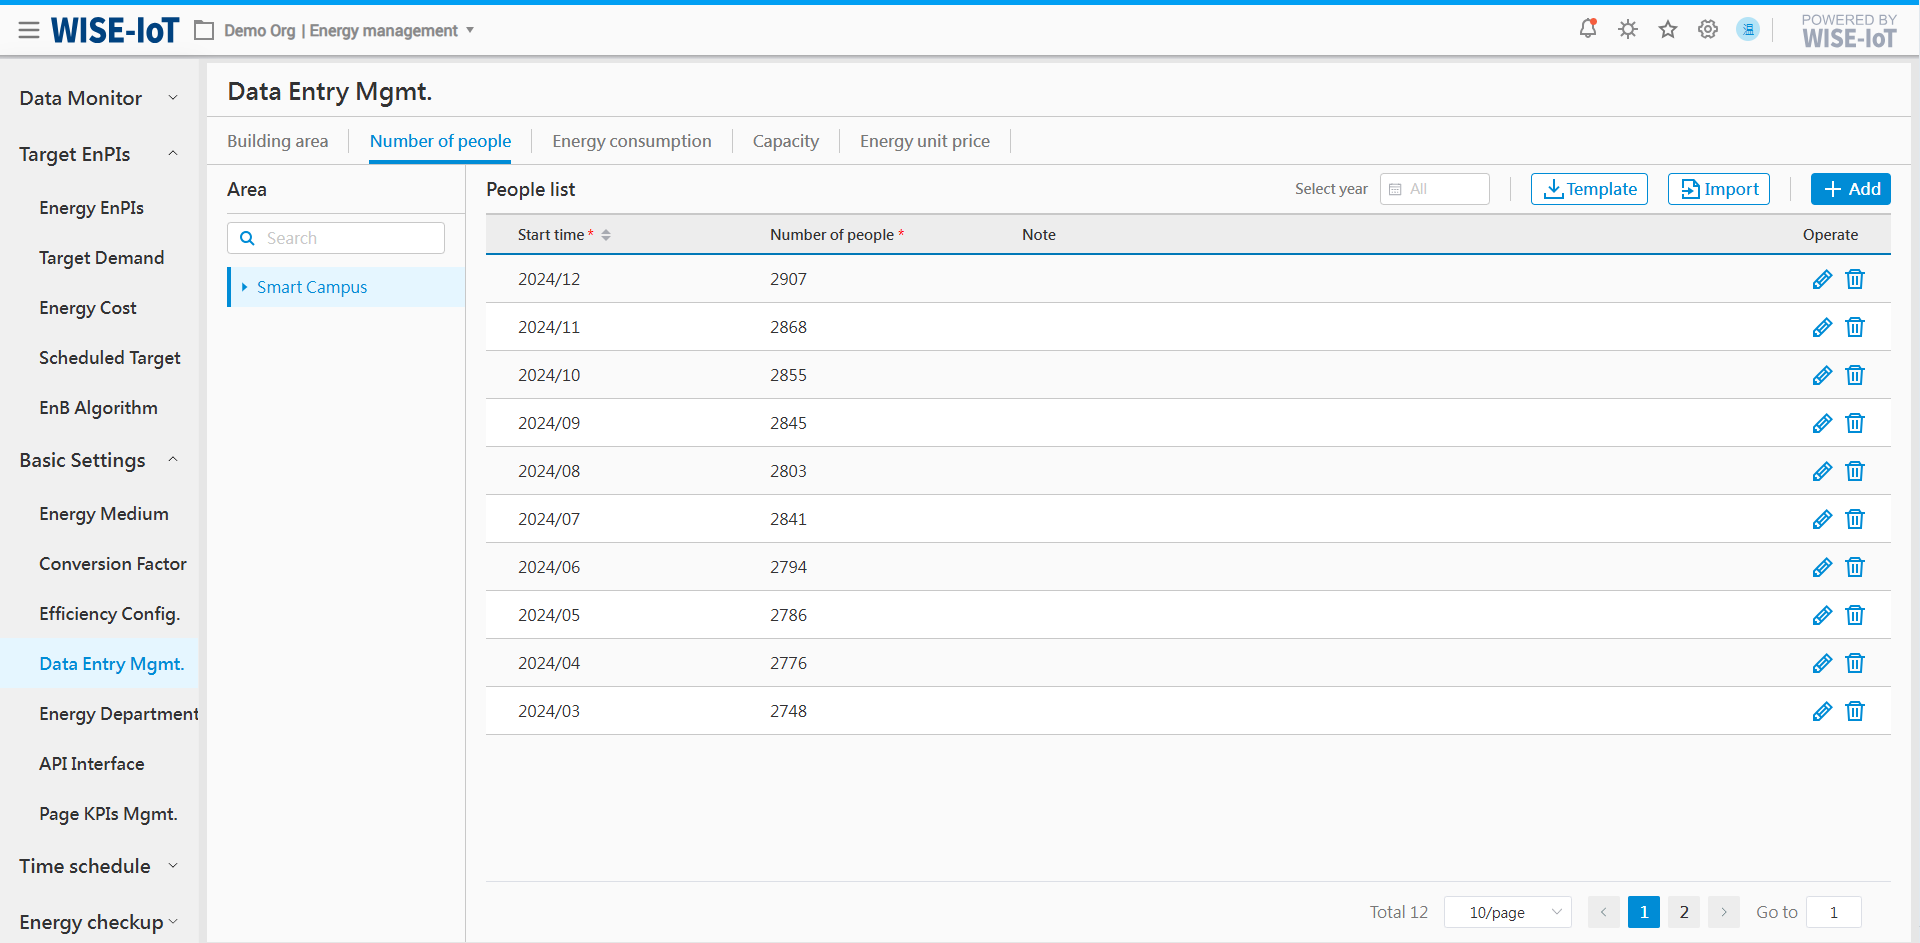
Import Number of people
-
Click [Template] to obtain the ECOWatch headcount import template.
-
After completing the template according to formatting requirements, select the corresponding area topology before clicking [Import]. The system will verify whether the data is imported based on the content. Imported data can be reviewed in the Headcount list.
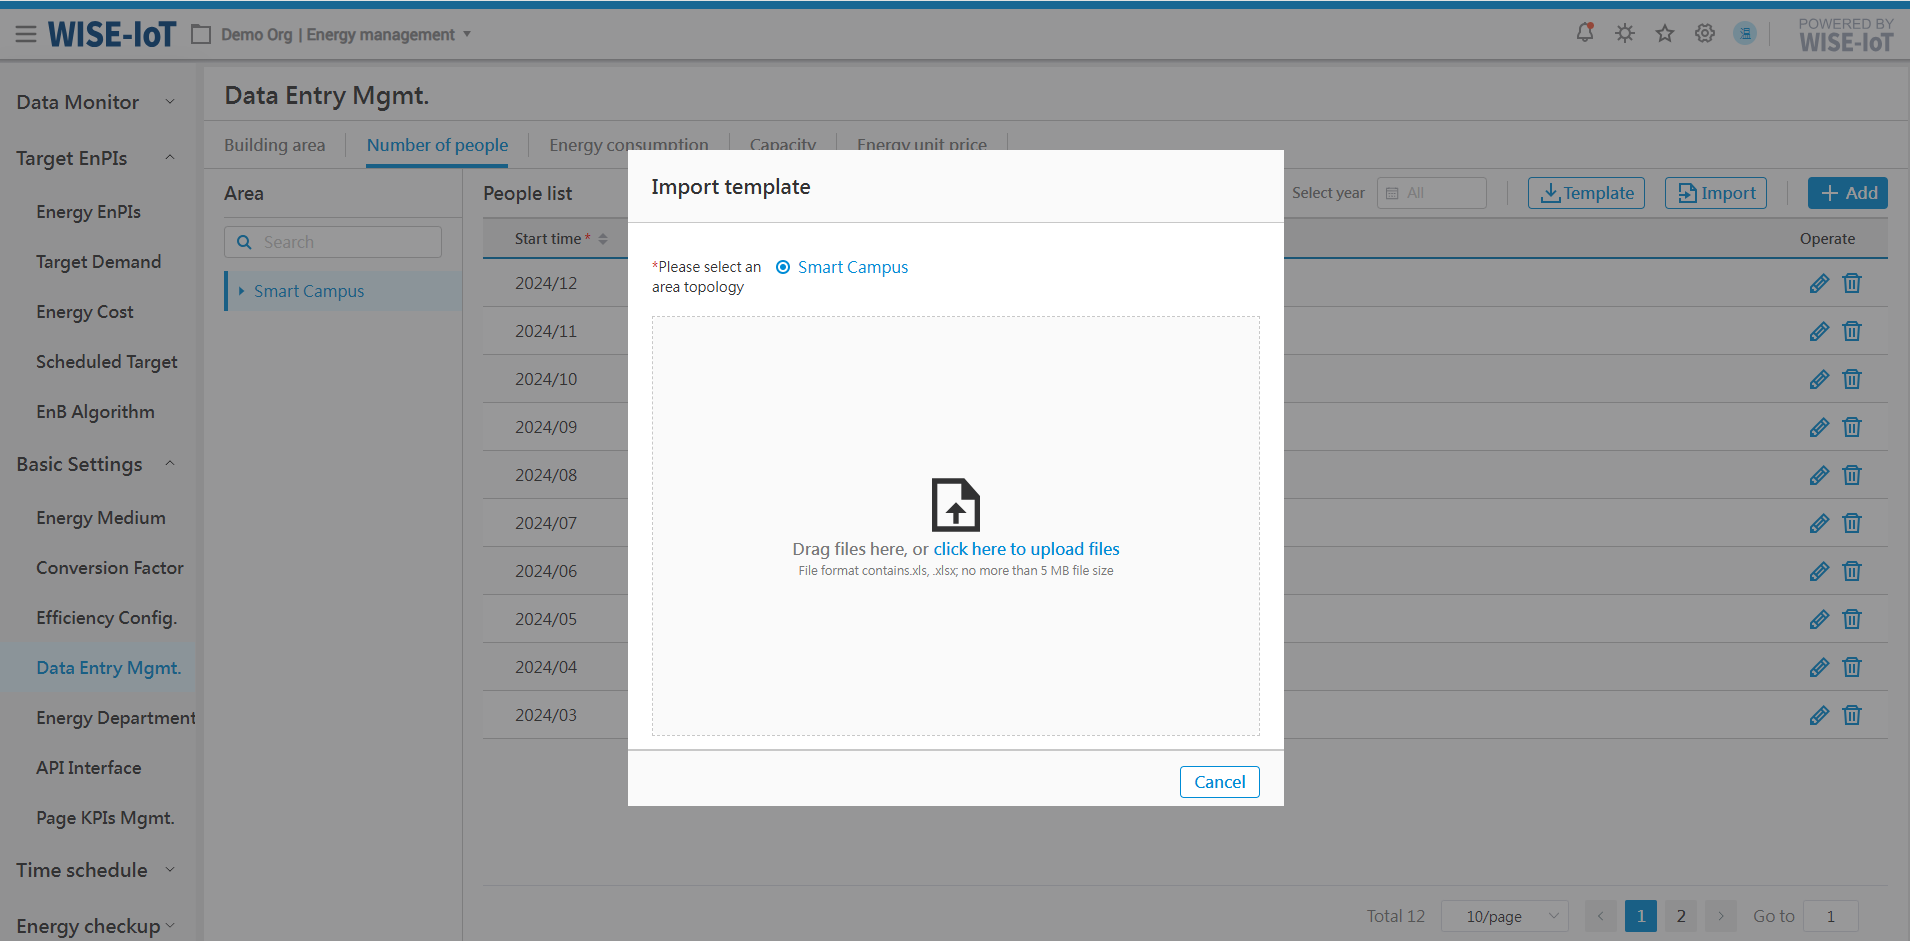
Enter Number of people
- On the people List page, click [Add] to insert a row.
Note: The data entered here corresponds to the area selected on the right of the interface.
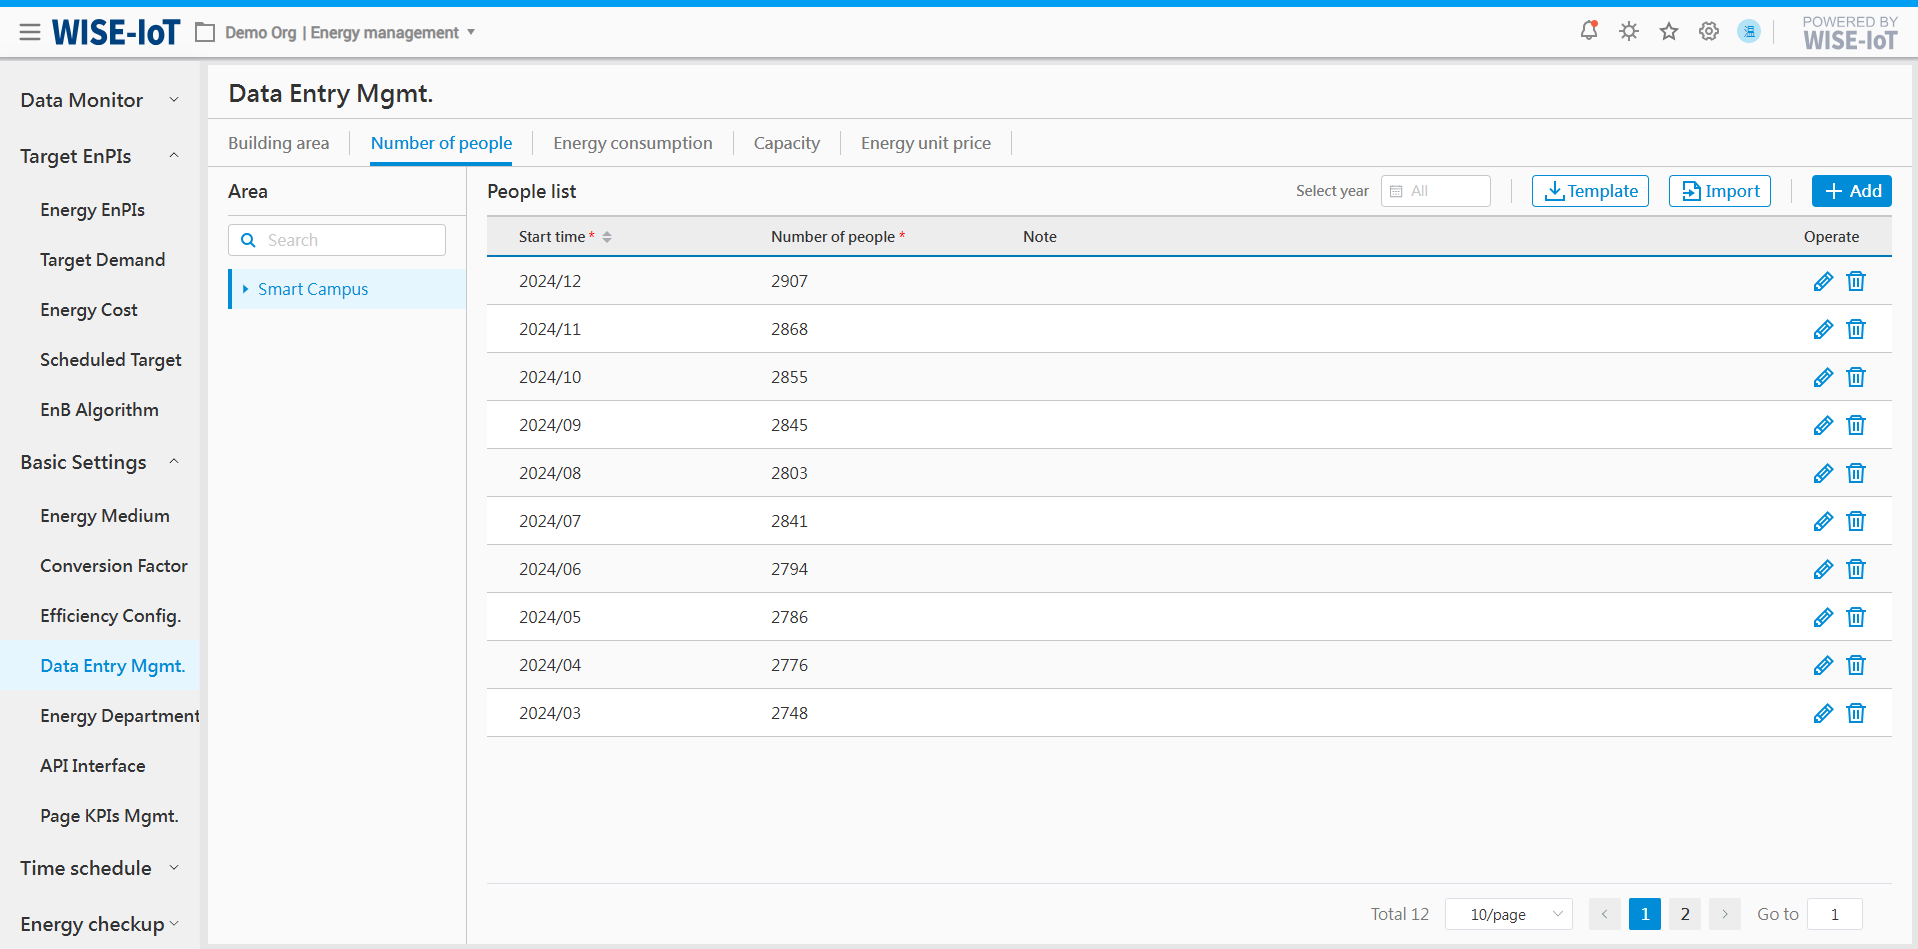
- Select the effective date for the headcount, input the headcount, then click "" to save the information. Click "" to cancel the operation.
Edit Number of people
Select an area's headcount in the list and click [![]() ], and the headcount will become editable.
], and the headcount will become editable.
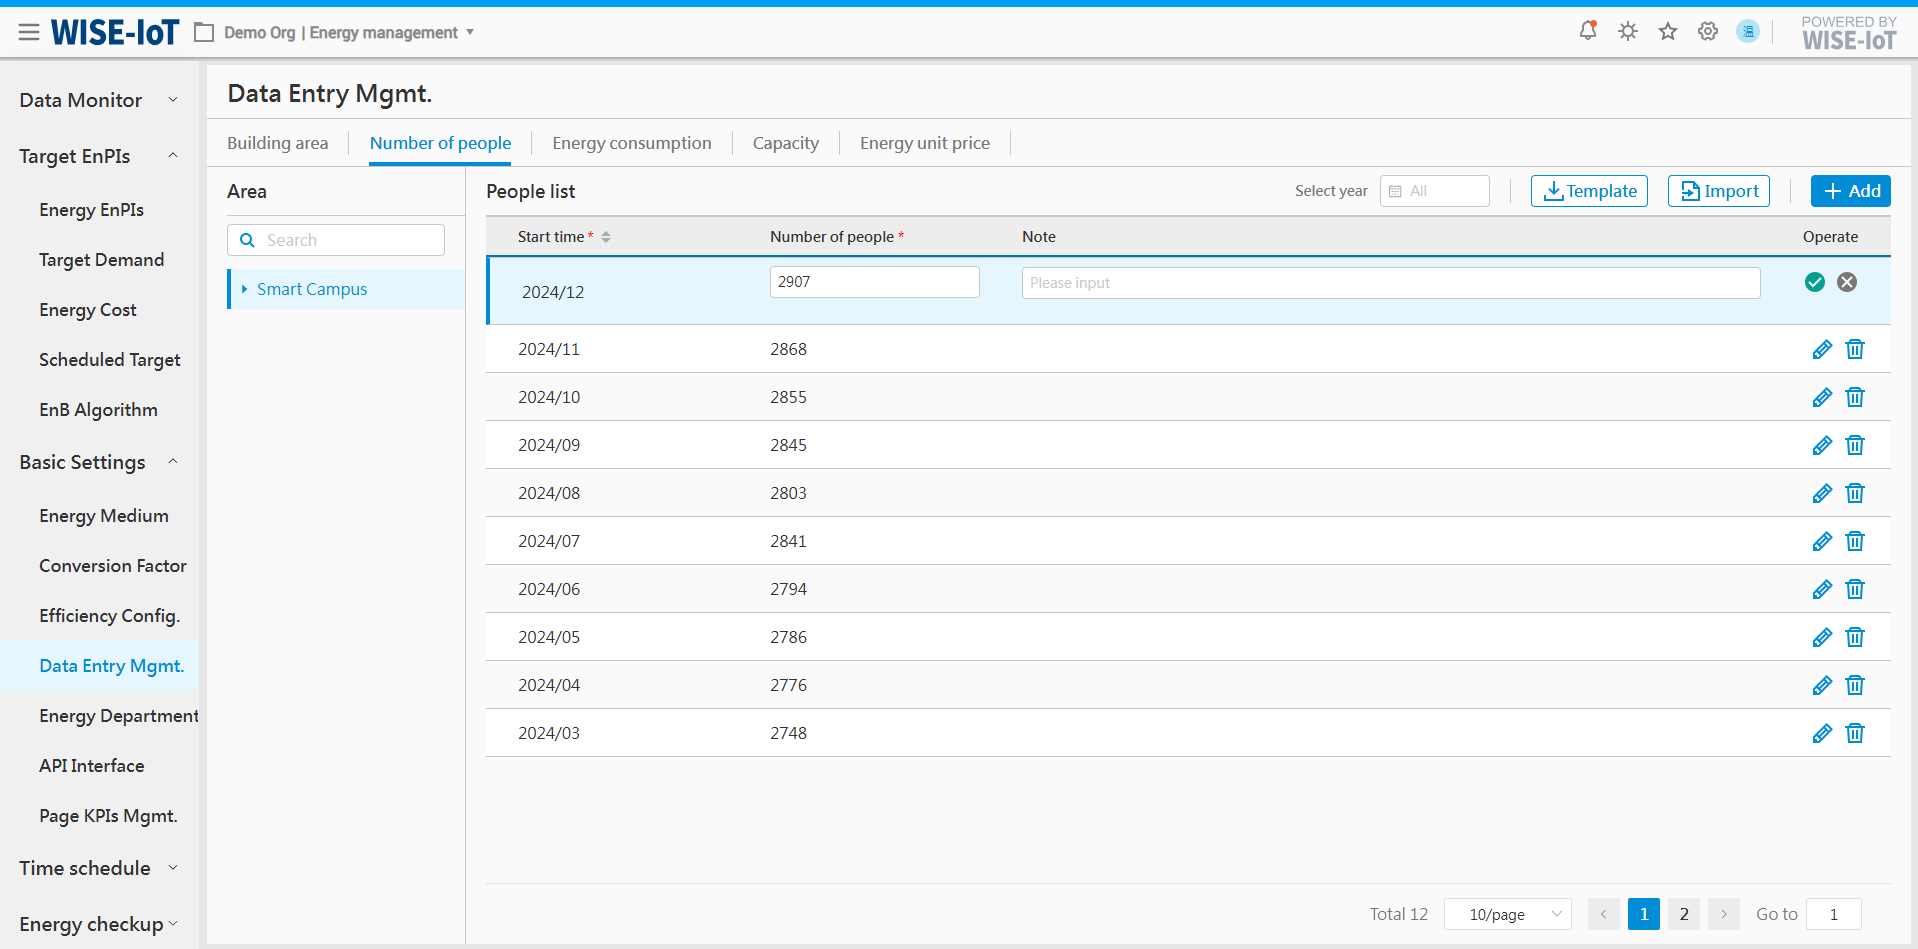
During editing, the effective date cannot be changed whereas the headcount and remarks can be modified. Click "![]() " to save the information and click "
" to save the information and click "![]() " to cancel the operation.
" to cancel the operation.
Delete Number of people
Select an area's headcount and click [![]() ] to delete it.
] to delete it.
Enter Energy Consumption
Cautions
There are two ways to enter data in ECOWatch, please select as needed. We recommend using the Metered Data Entry for operational efficiency and convenience.
+------------------------------------------------------------------------------------------------------------------------------------------------+-----------------------------------------------------------------------------------------------------------+ | Energy Consumption Data Entry Methods | +------------------------------------------------------------------------------------------------------------------------------------------------+-----------------------------------------------------------------------------------------------------------+ | Method 1:Meter Data Entry | Method 2:Mixed Entry: Meters + Business Nodes | +------------------------------------------------------------------------------------------------------------------------------------------------+-----------------------------------------------------------------------------------------------------------+ | Enter all data into the meters, and the meter readings will drive the consumption calculation of parent nodes. | Ensure the following data is entered for all business nodes: | | | | | ----------------------- | 1.Energy media and their classification by category and sub-item | | | | | After data entry, the following steps are required: | 2.Daily, monthly (excluding the current month), and yearly (excluding the current year) data | | | | | 1.Go to InsightAPM>System Monitoring, and perform data rollback based on the entered meter nodes or by selecting relevant meter asset groups. | --------------------- | | | | | 2.Rollback Time: The earliest time point in 3.the entered meter values | After data entry, to calculate the annual consumption for the current year, perform the following: | | | | | Rollback Type: Do not overwrite entered values | 1.Select all meters in the target area, go to the [Data Rollback]page, and for all meters in this area: | | | | | | 2.Rollback Start Time: Any time on the current day, 3.preferably within the last hour | | | | | | Click to execute rollback. | +------------------------------------------------------------------------------------------------------------------------------------------------+-----------------------------------------------------------------------------------------------------------+
After confirming site-specific conditions, proceed with data entry. The values entered are final energy usage. If the system already contains usage information for the corresponding date, the newly entered data will overwrite the existing information
Enter Energy consumption List
Click Basic Settings > Data Entry Mgmt. > Energy consumption Information.
-
Click "Enter" to go to the Energy Usage Input page;
-
Click "
 " to modify data.
 -
Click "
 " to remove energy usage.
 -
Click "
 " to export associated data of selected rows to Excel.
 -
Click "
 " to import Excel of energy usage data.
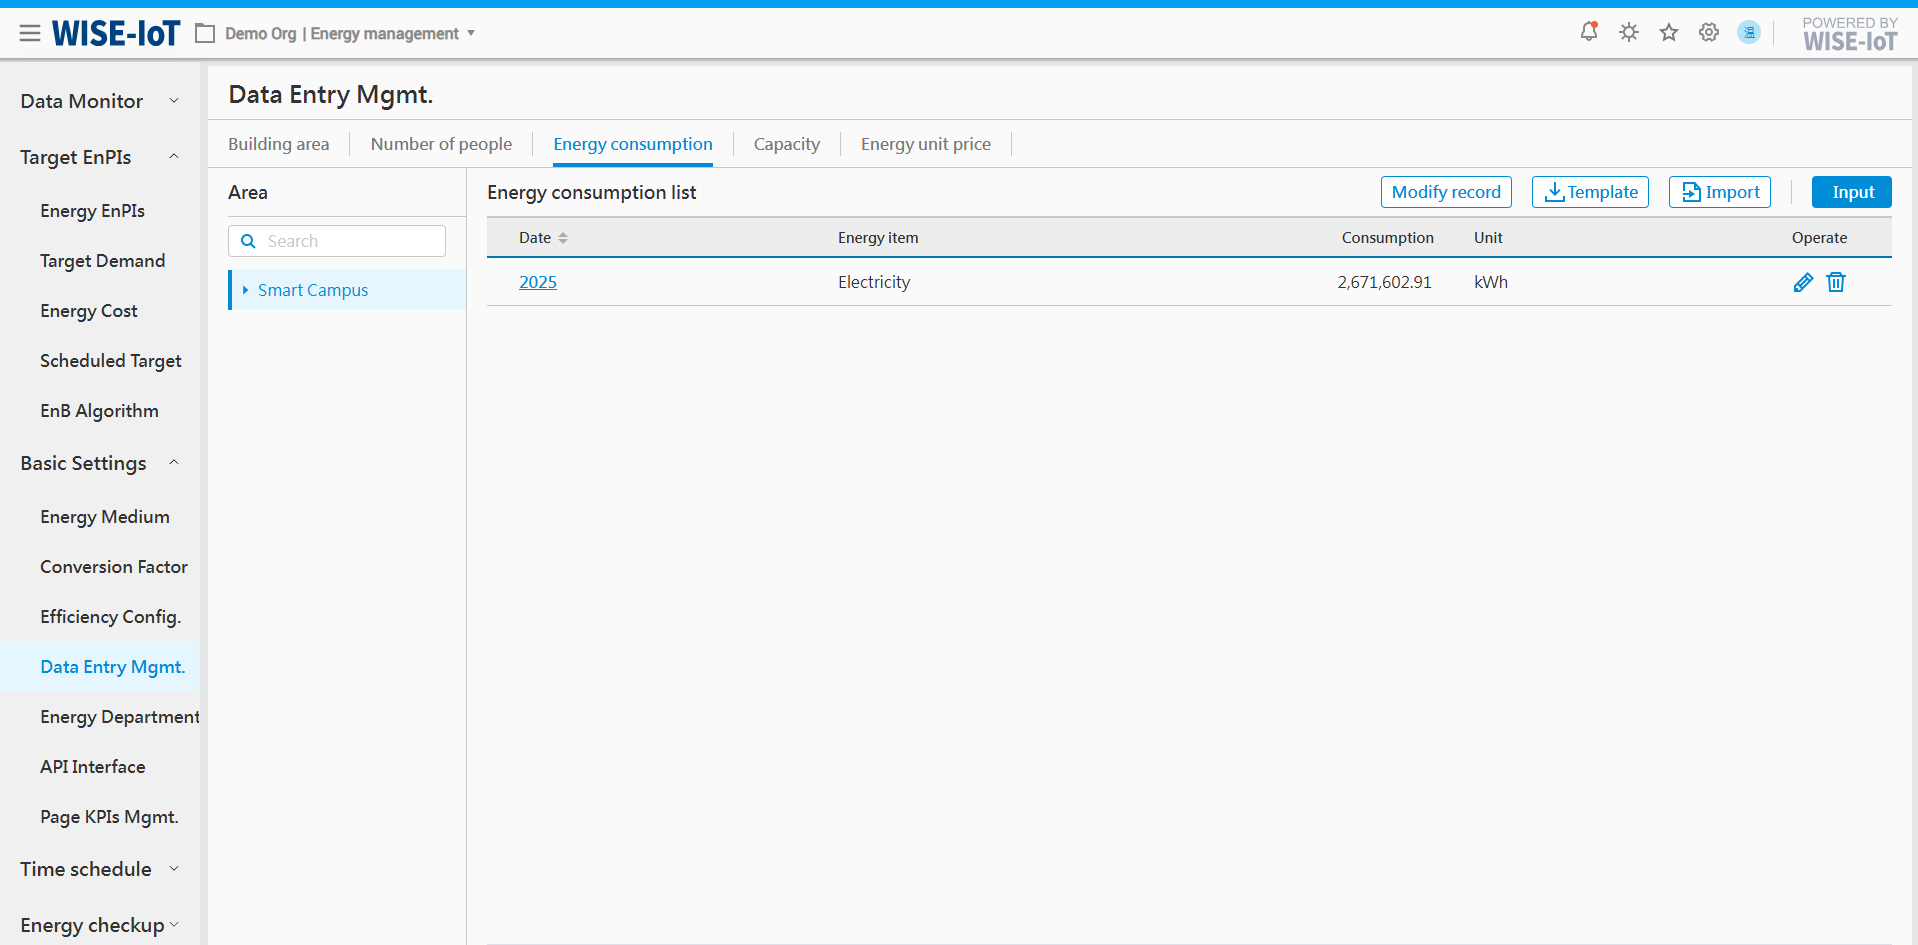
Import Energy Usage Data
-
Click [Template] to obtain the ECOWatch Energy Import Template.
-
After completing the template according to formatting requirements, select the corresponding area topology before clicking [Import]. The system will verify whether the data is imported based on the content.
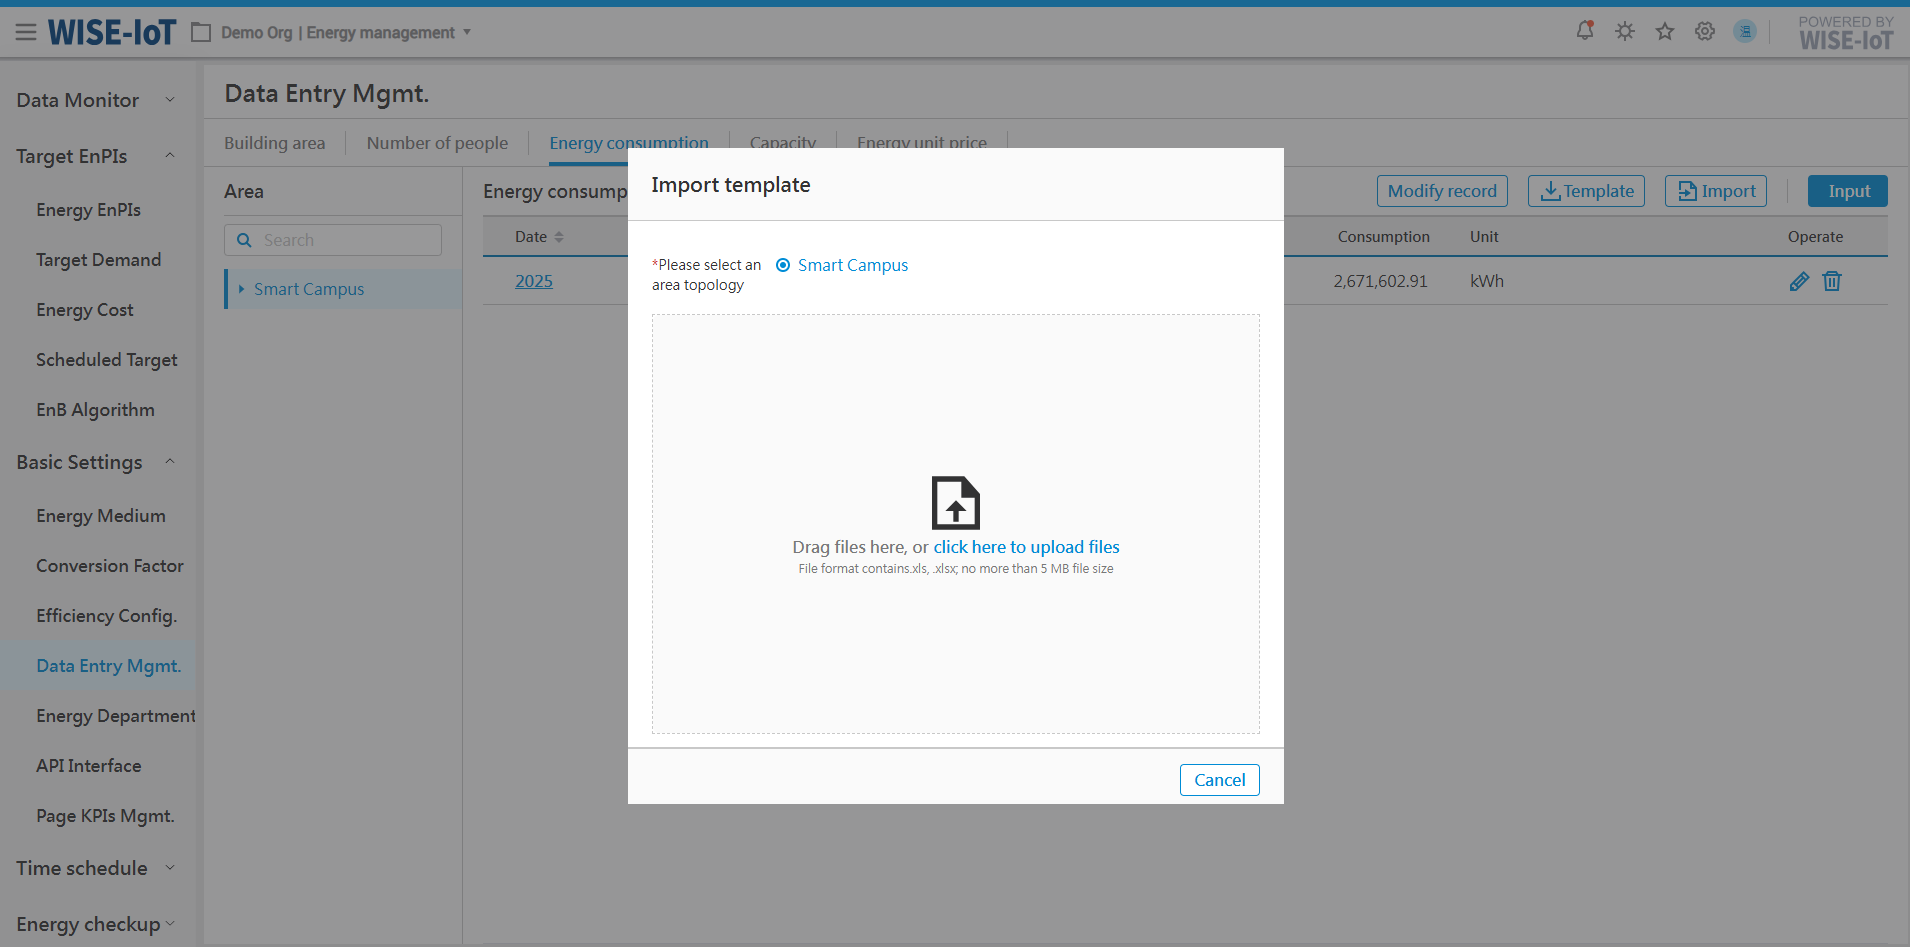
Enter Energy Usage Data
- On the Energy Usage List page, click [Input] to navigate to the Historical Data Entry interface.
Note: The data entered here corresponds to the area selected on the right of the interface.
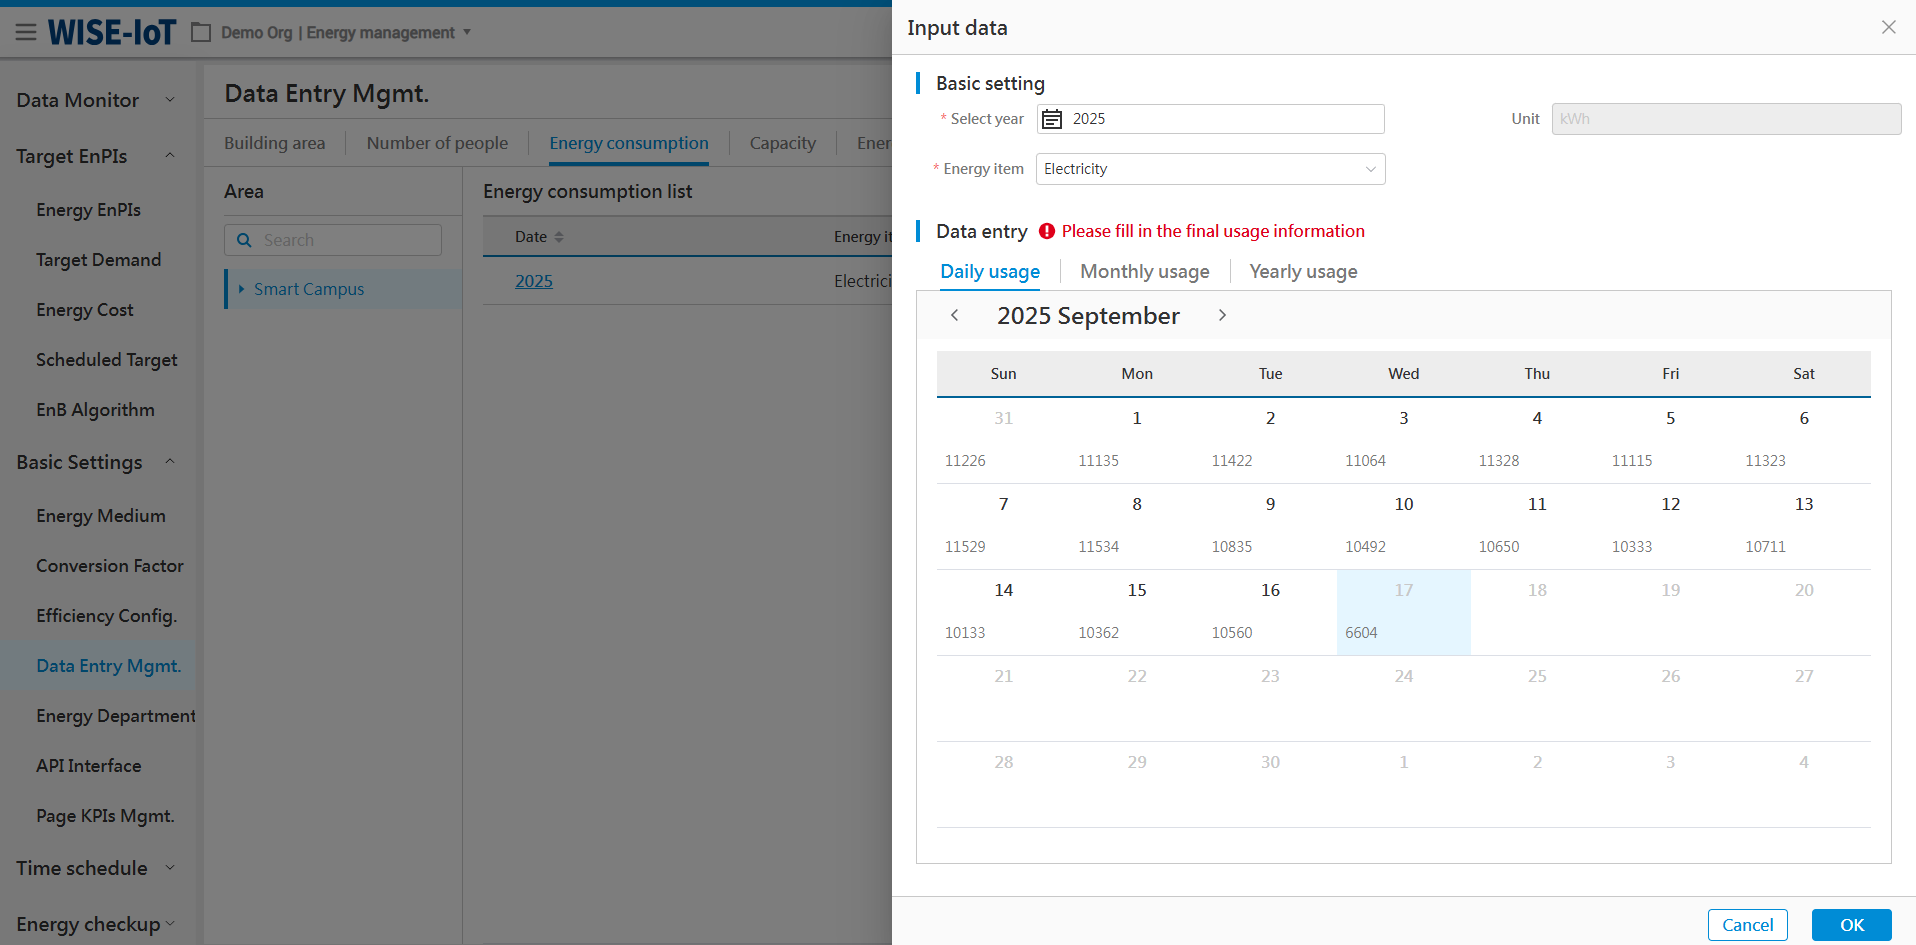
2. Select the year of history data and corresponding energy items;
3. If historical data of daily energy usage is available, click [Daily Usage], then click the blank of a day to enter daily energy usage.
4. Click[Monthly Usage]to enter monthly energy usage in two ways:
(1) Manually enter monthly data;
(2) Click [Automatic calculation of monthly energy consumption by day] to obtain the data.
5. Click[Yearly Usage]to enter annual energy usage in two ways:
(1) Manually enter annual data;
(2) Click [Automatic calculation of annual energy consumption by month] to obtain the data.
- Click "OK" to save the data.
Note: Only one copy is allowed to be saved for energy items of the same year.
Edit Energy Usage Data
Select the year in the corresponding list and click [![]() ] to edit energy usage for a specific area.
] to edit energy usage for a specific area.
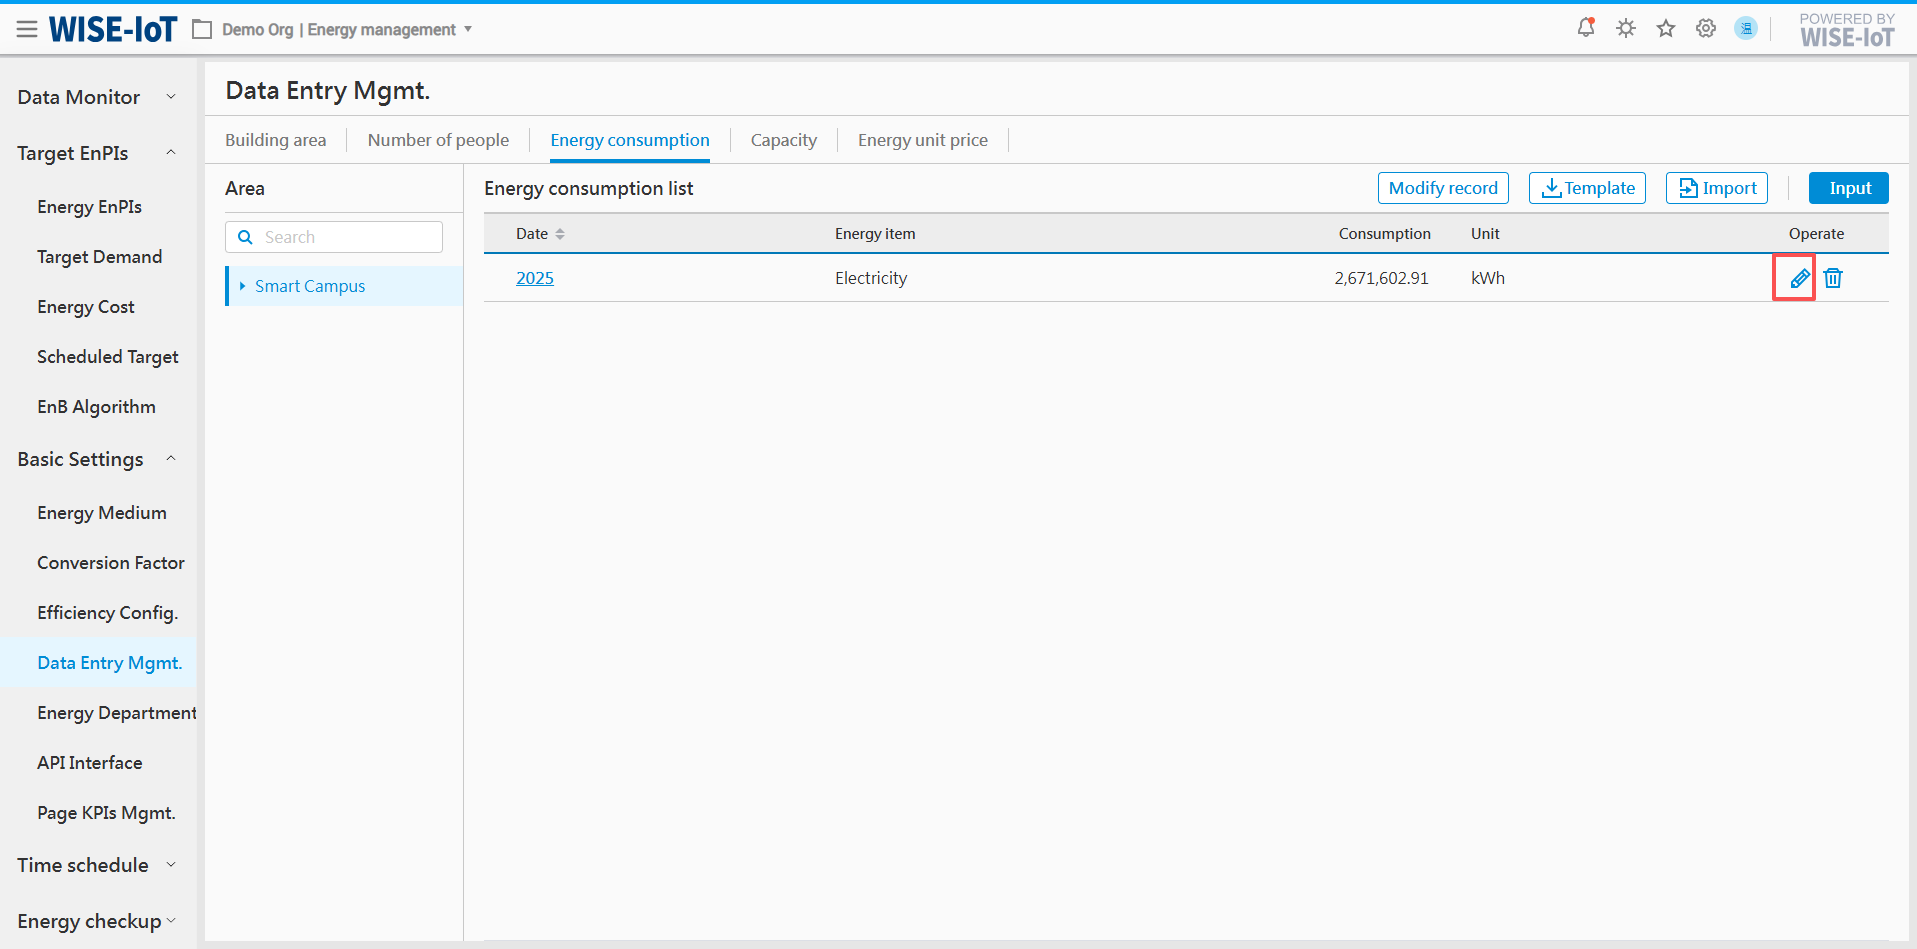
Delete Energy Usage Data
Select the year in the list and click [![]() ] to delete historical energy usage data for a specific area and all associated monthly and daily energy usage data for that year, month and day will be removed as well.
] to delete historical energy usage data for a specific area and all associated monthly and daily energy usage data for that year, month and day will be removed as well.
Modify Records
The system records each user's operation history for traceability purpose. Click [Modify record] to access the update record page.
For energy usage data adjusted via Excel import, please select "Excel import " in the "Input Method" field.
For energy consumption data adjusted via system form entry, please select "Manual input" in the "Input Method" field.
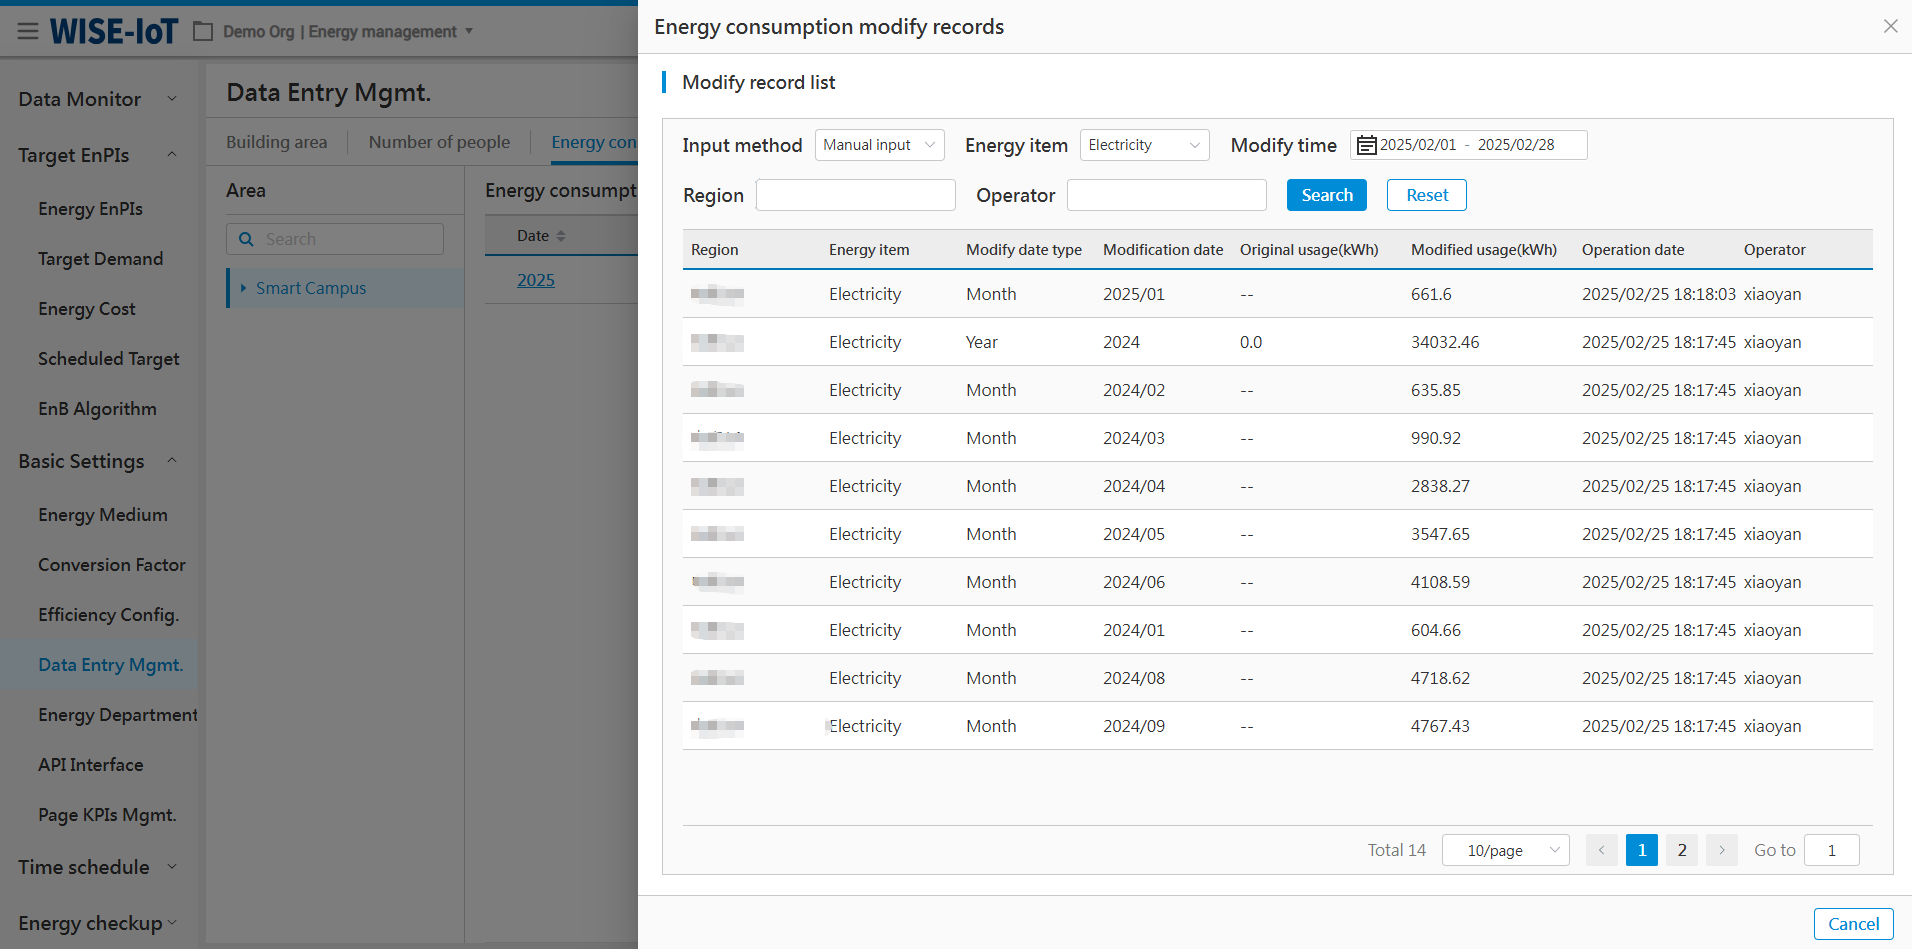
Enter Output Value and Output
Click Basic Settings > Data Entry Mgmt. > Capacity.
-
Click "Add" to navigate to the Output Value & Output Entry page.
-
Click [
] to edit data. -
Click [
] to remove the capacity data. -
Click [Template] to export the associated data of the selected row to Excel.
-
Click [Import] to import the Excel file of capacity data.
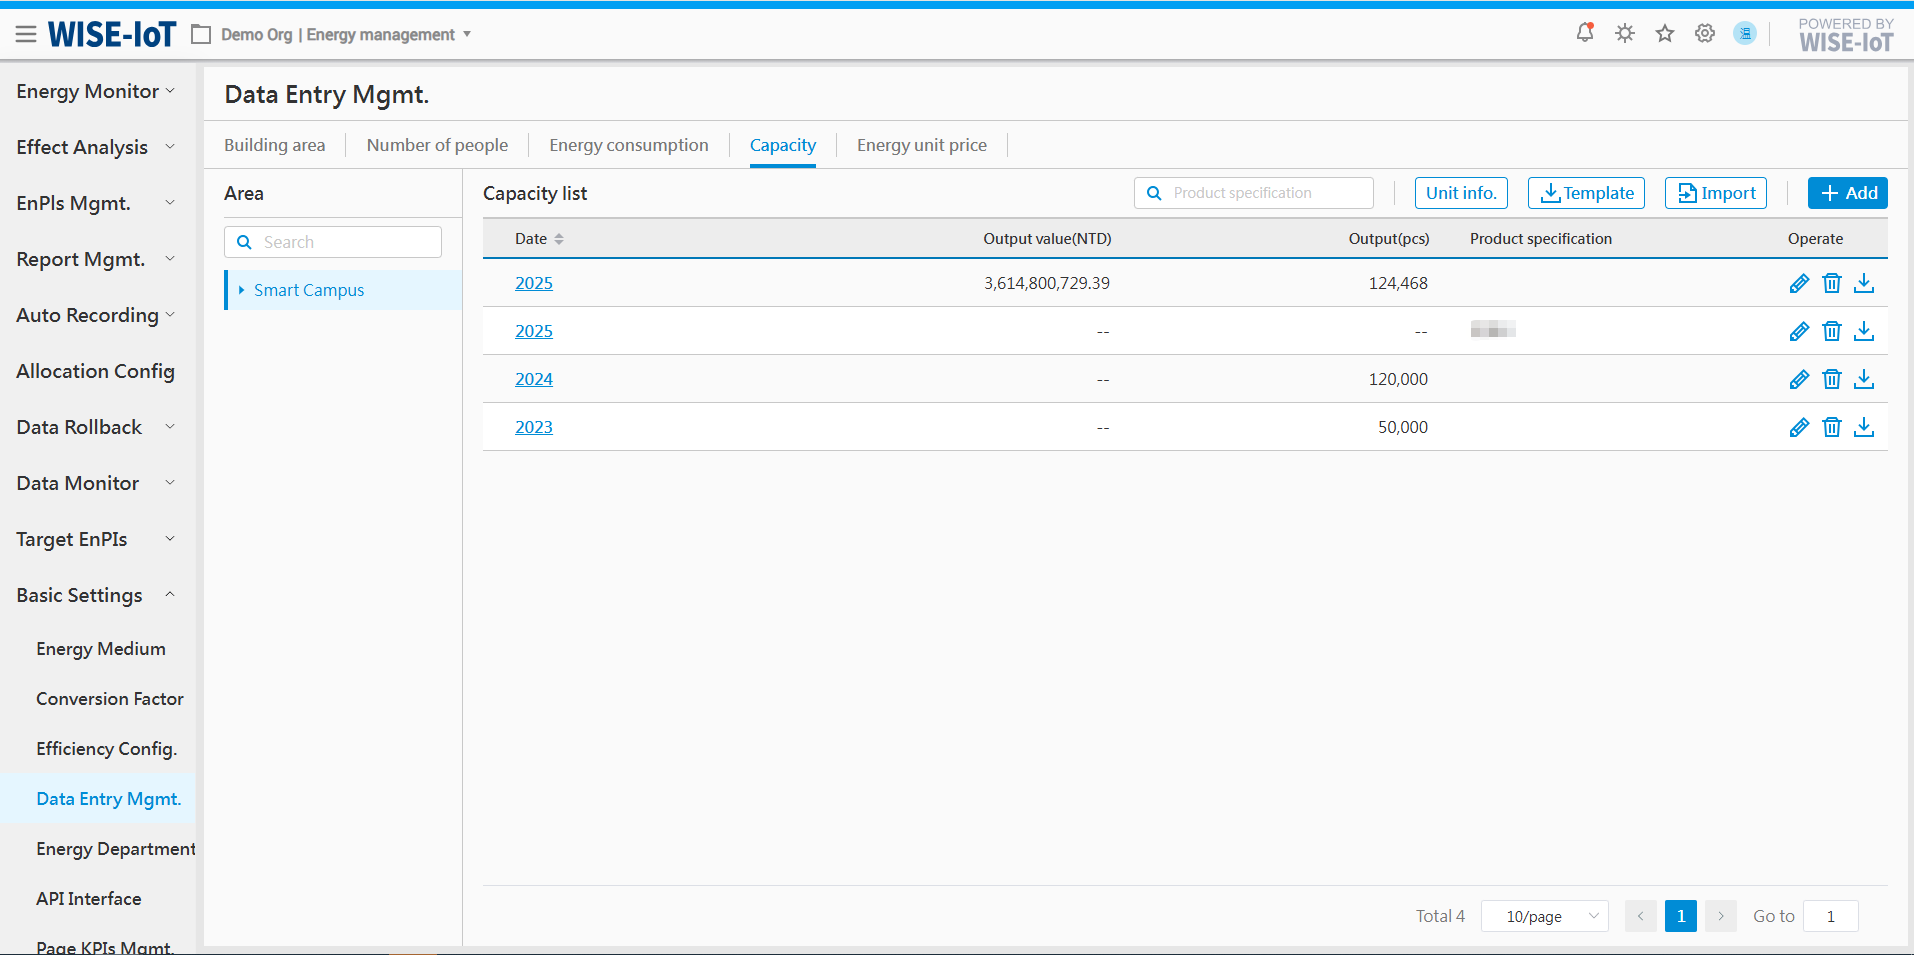
Import Output Value and Output
Click [Template] to obtain the ECOWatch output value and output import template.
After completing the template according to the format requirements, select the corresponding area topology before clicking [Import]. The system will verify whether the data is imported based on the content. If the import fails, the interface will provide detailed error messages for your reference.
Add Output Value and Output
1. On the output Value and Output List page, click [Add] to access the Data Entry page.
Note: The data entered here corresponds to the area selected on the right of the interface.
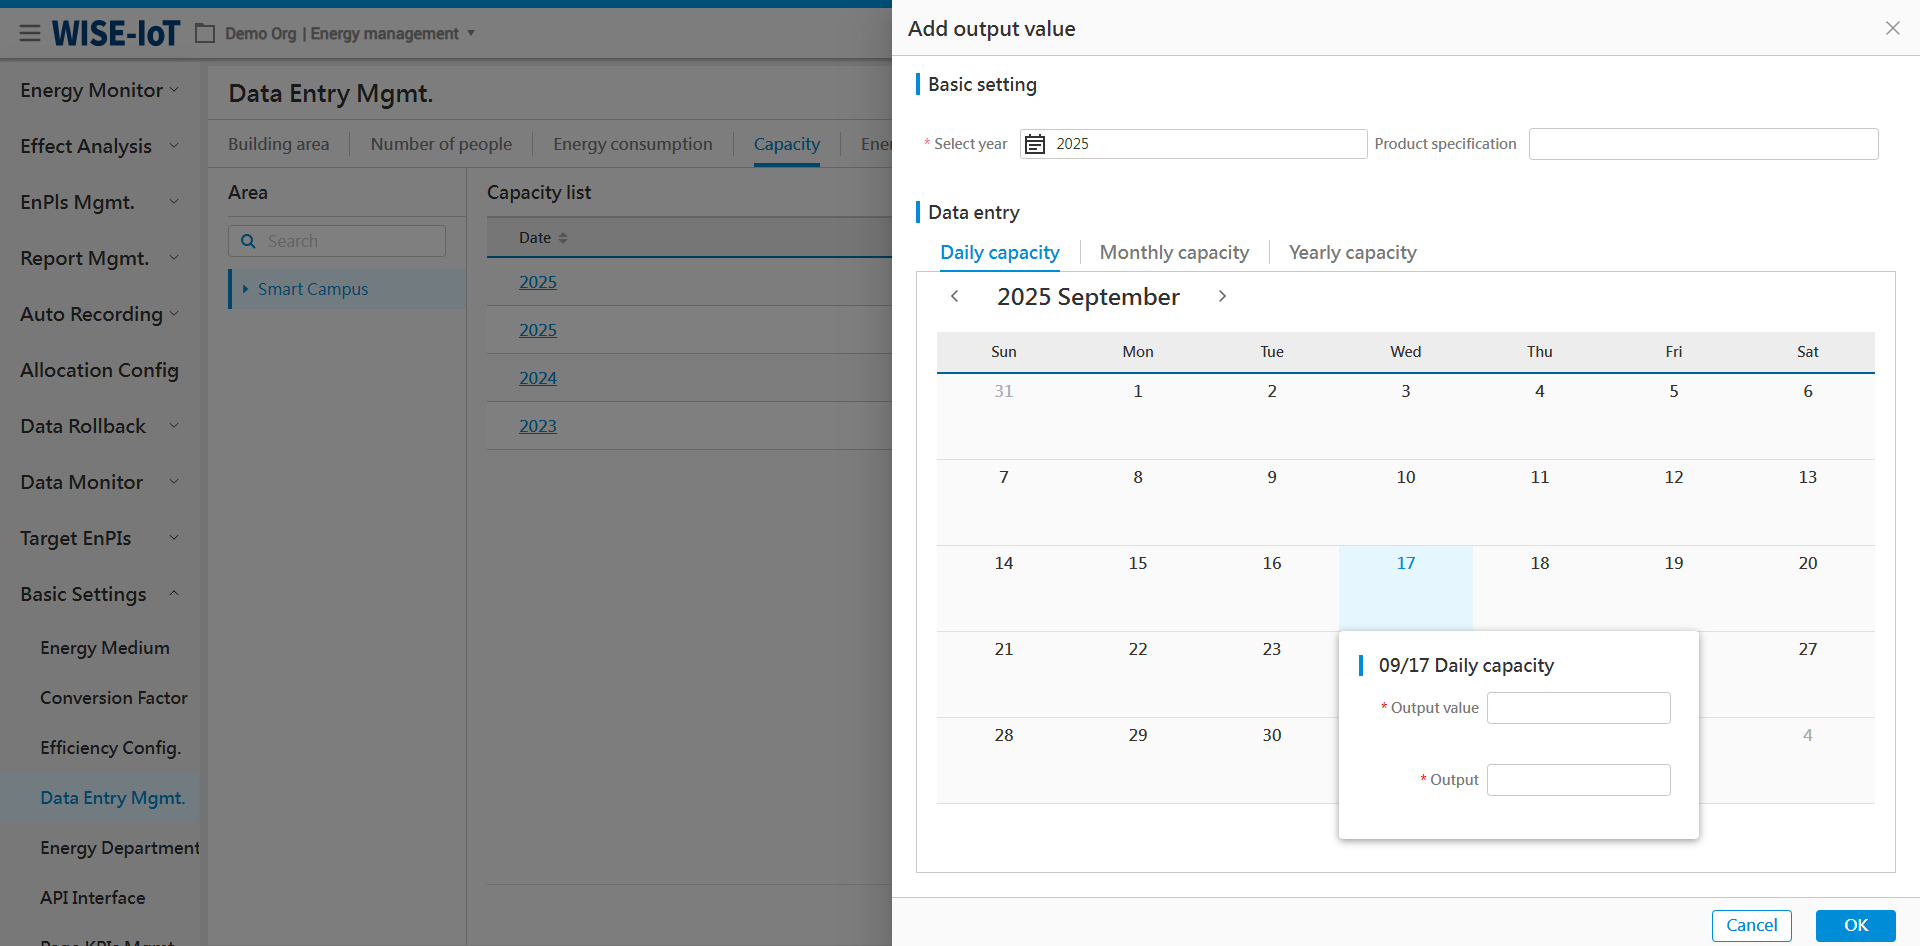
-
Select the year of the historical data, and product specifications are optional.
-
Click [Daily Capacity], and then click the blank of a day to enter the relevant data.
-
Click [Monthly Capacity] to enter the relevant data:
(1) Manually input monthly data;
(2) Click [Automatic calculation of monthly capacity by day] to automatically calculate each month's capacity based on daily capacity;
- Click [Yearly Capacity] to enter the relevant data:
(1) Manually enter the annual data;
(2) Click [Automatic calculation of annual production capacity by month] to automatically calculate the year's capacity based on monthly capacity;
- After entering the above information, click "Ok" to save.
Note: For product specifications of the same year, only one copy is permitted to be saved.
Edit Output Value/Output
Select the year in the corresponding list and click [![]() ] to edit the edit the capacity data.
] to edit the edit the capacity data.
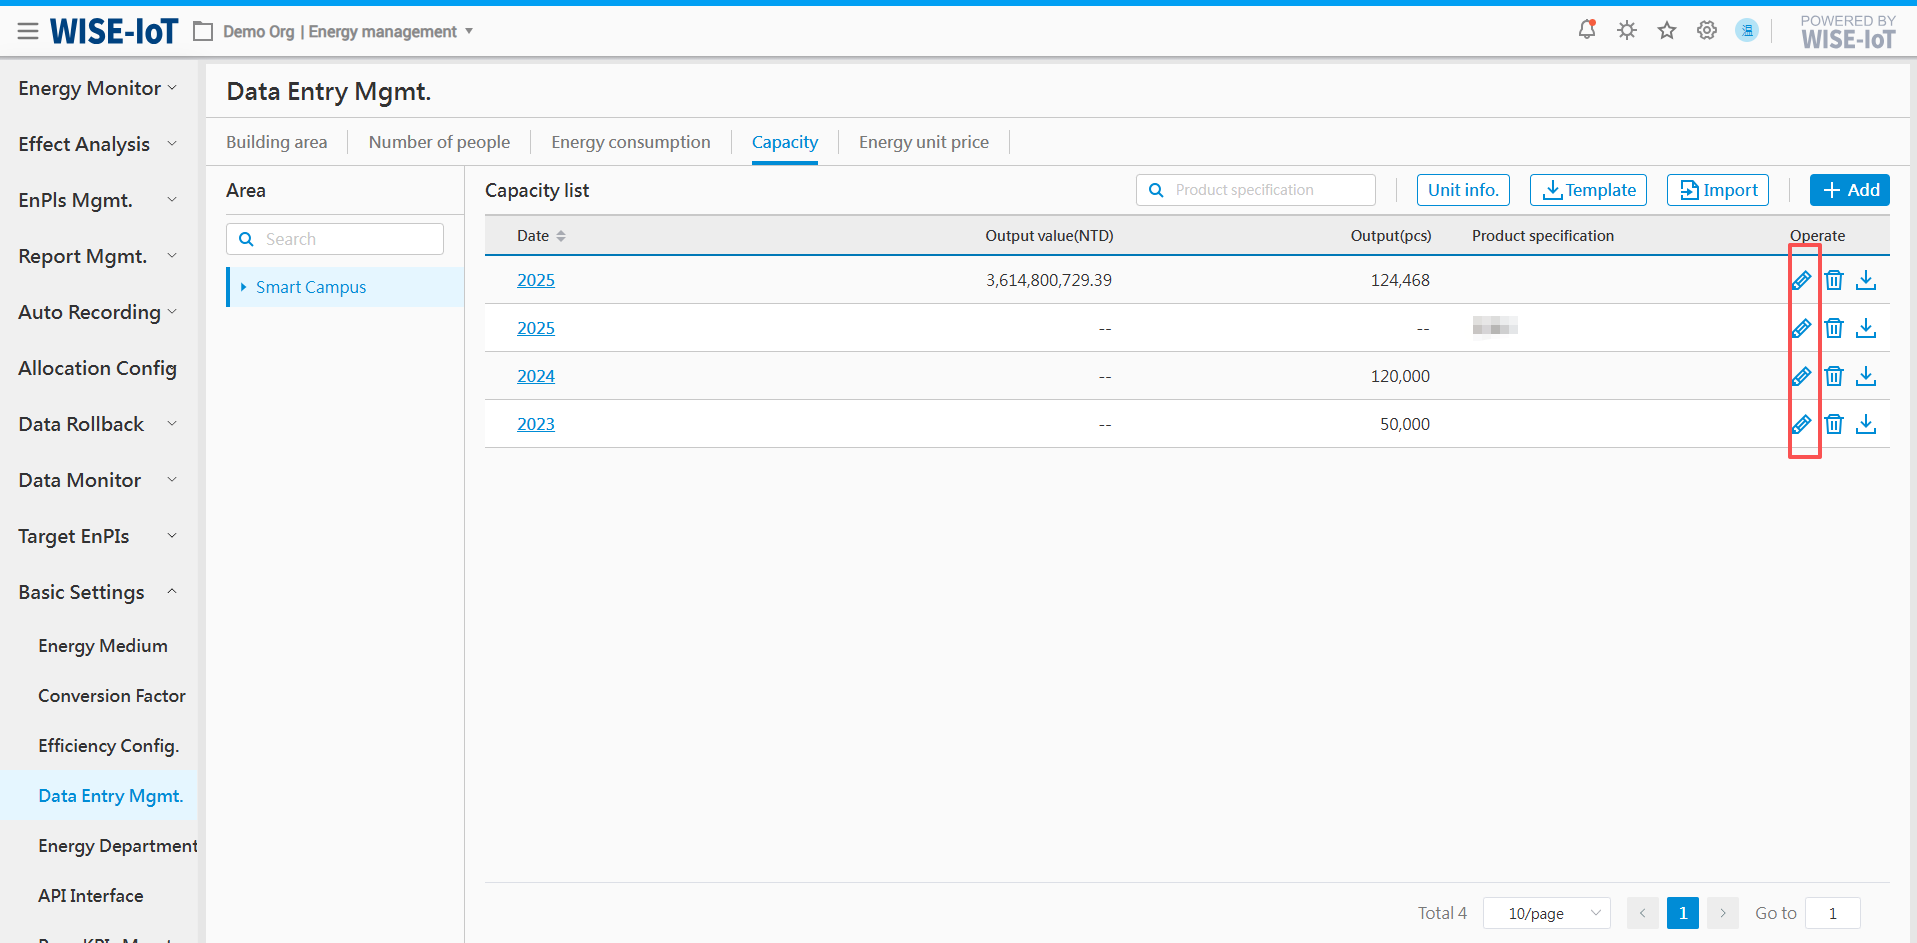
Delete Output Value/Output
To delete the output value/output of specific area, click [![]() ] next to the year in the output value/output list, and the annual, monthly and daily capacity data will be removed as well.
] next to the year in the output value/output list, and the annual, monthly and daily capacity data will be removed as well.
Maintain Output Value/Output Unit Data
In ECOWatch, all displays of output value/output unit originate from the Unit Information Maintenance interface under Data Entry - Output Value/Output module. The procedure is as follows:
1. Open Data Entry Mgmt. > Output Value/Output Information, then click "Unit info. ":
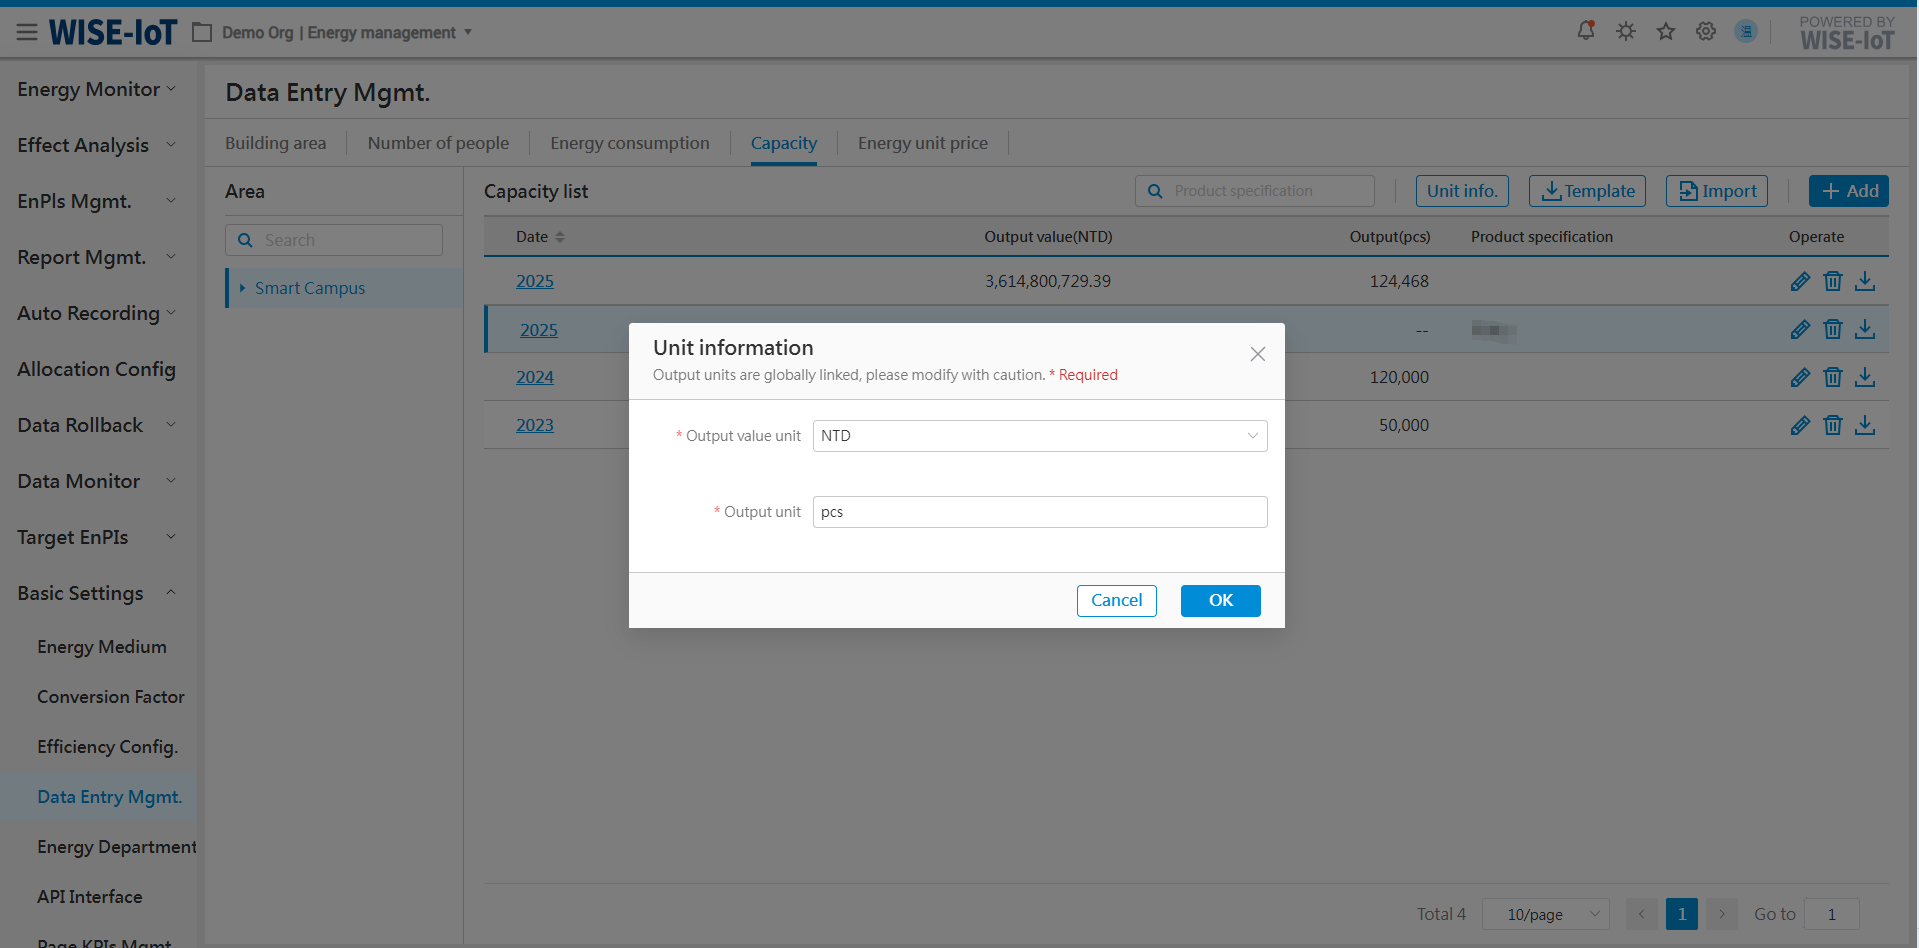
2. In the interface
- Select Output Value Unit information: Multiple currency options are available, including CNY, NTD, USD, KRW, JPY, EUR, CAD, HKD, etc. If the desired currency is not listed, enter it in the text box and then click Enter:
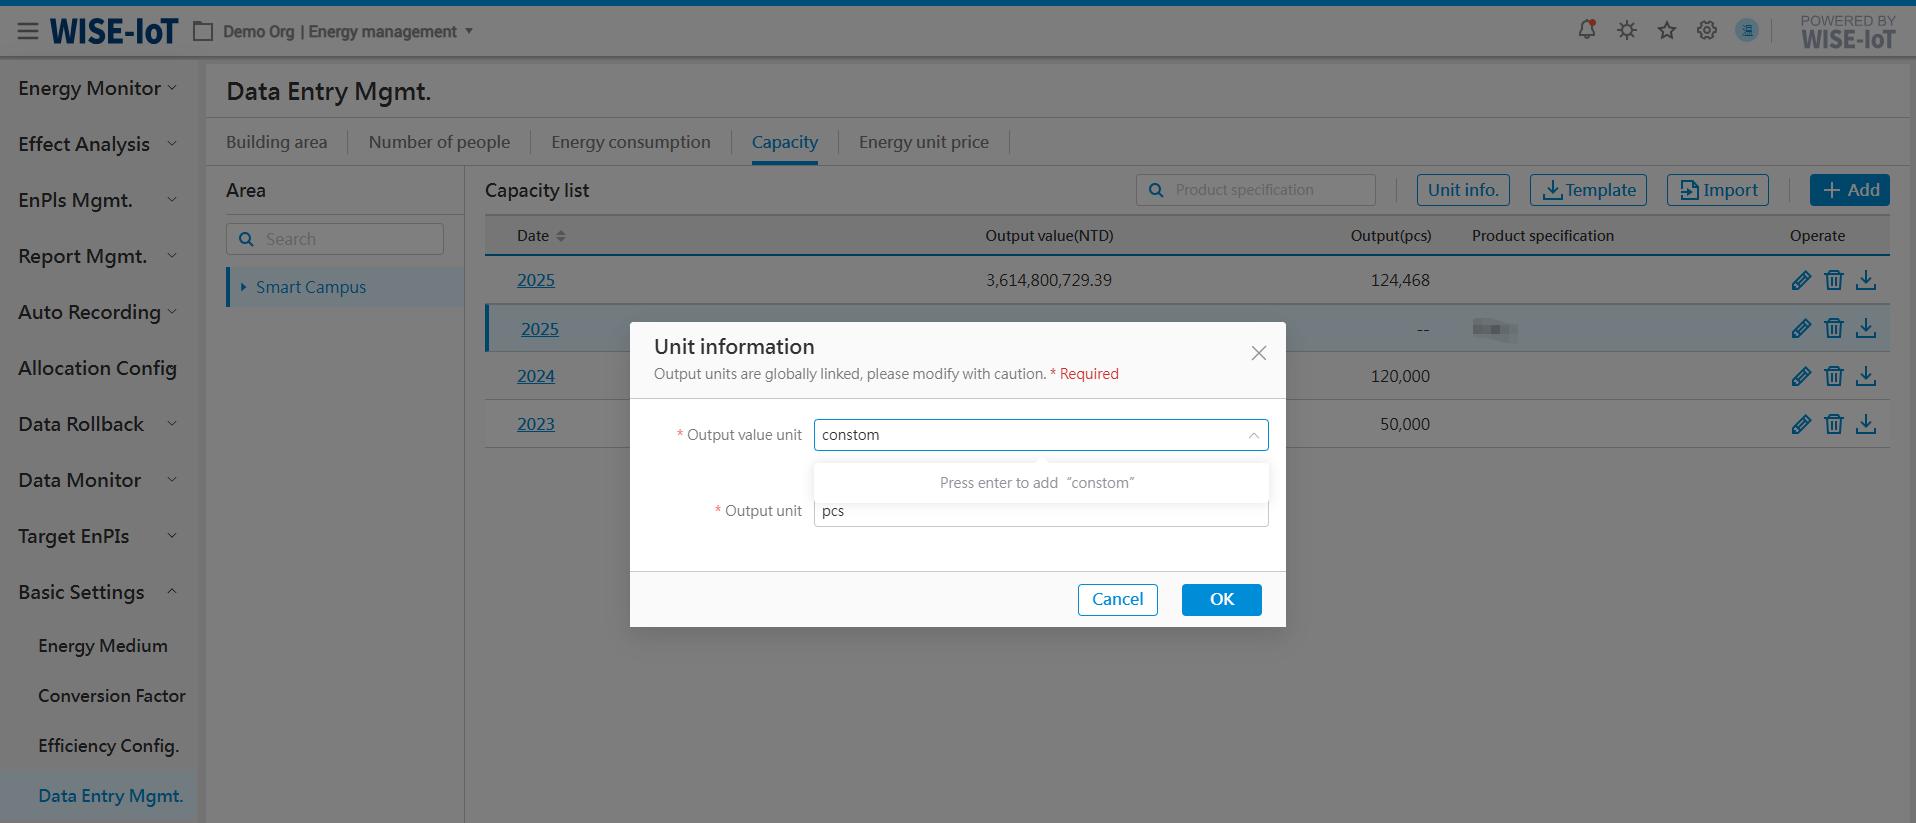
- Manually enter and save the Output Unit.
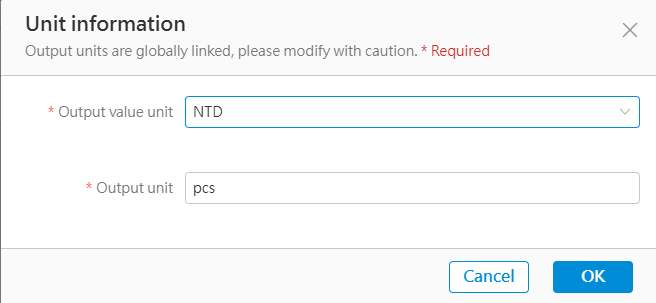
Enter Energy Unit Price
Click Basic Settings > Data Entry Mgmt. > Energy Unit Price to access the Energy Unit Price Entry interface.
-
Click "Add" to enter energy unit prices;
-
Click "
" to edit data; -
Click "
" to delete the energy usage data.
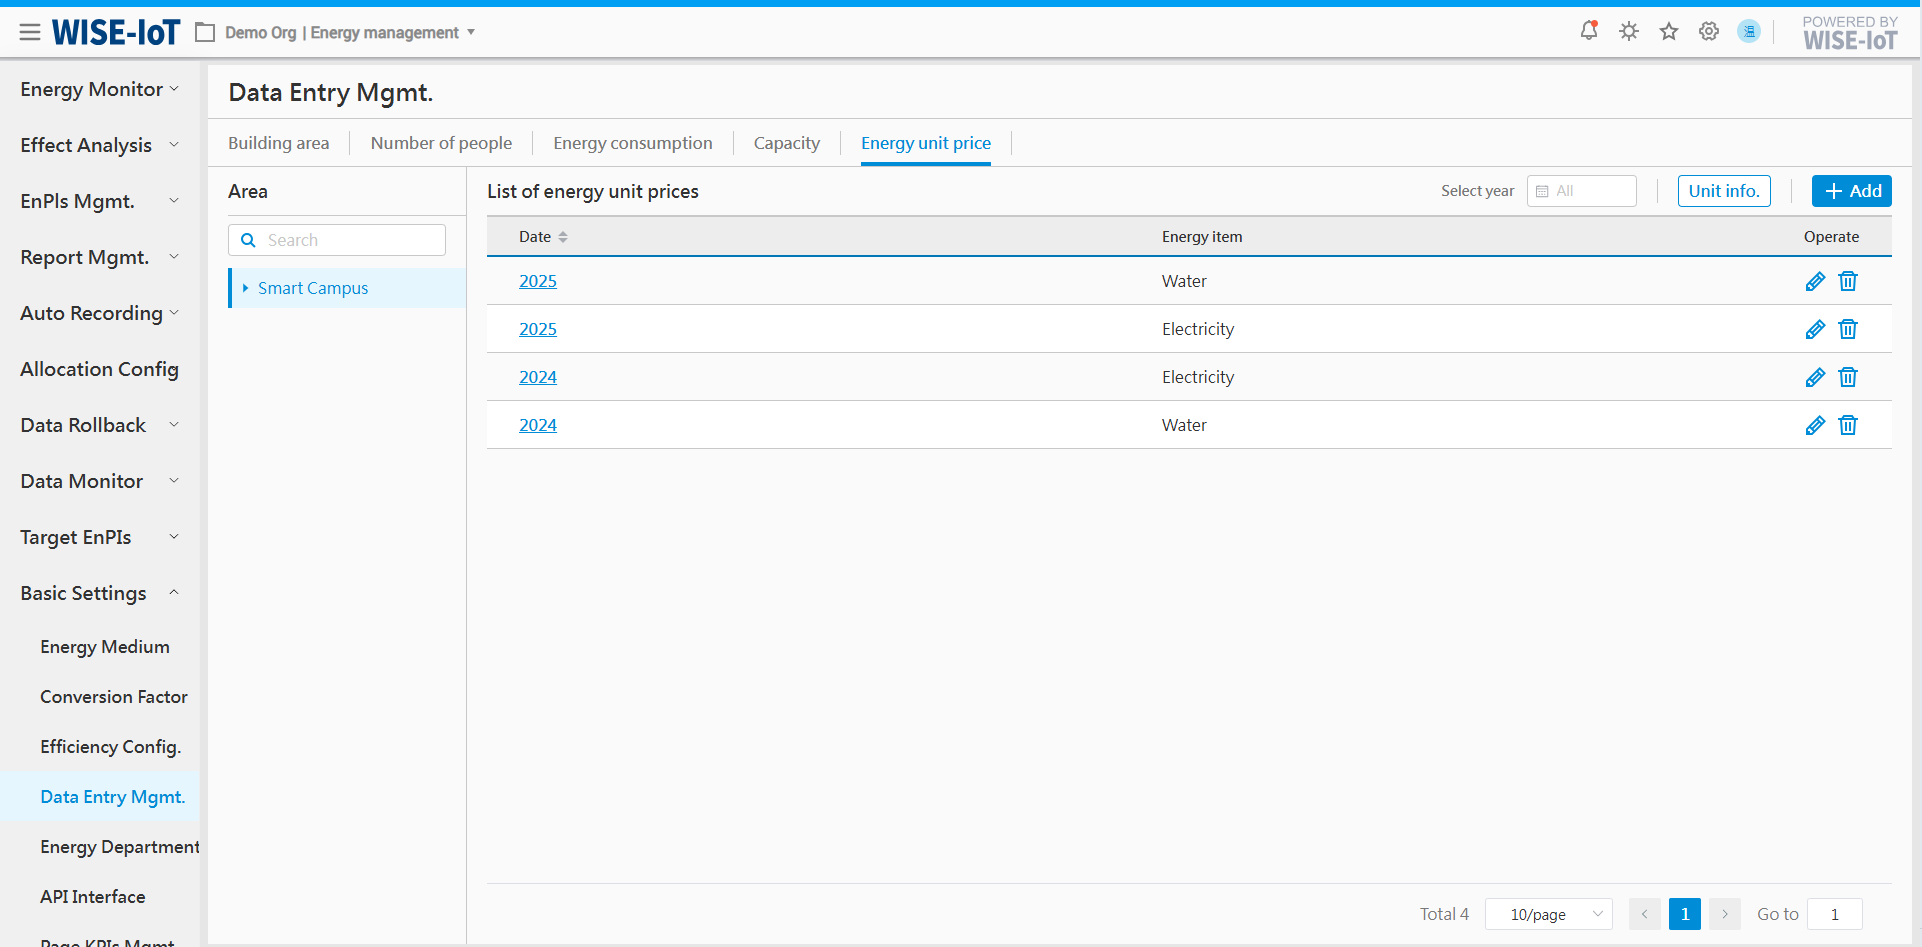
Add Energy Unit Price
1. On the Energy Unit Price List page, click [Add] to add energy unit prices.
Note: The data entered here corresponds to the area selected on the right of the interface.
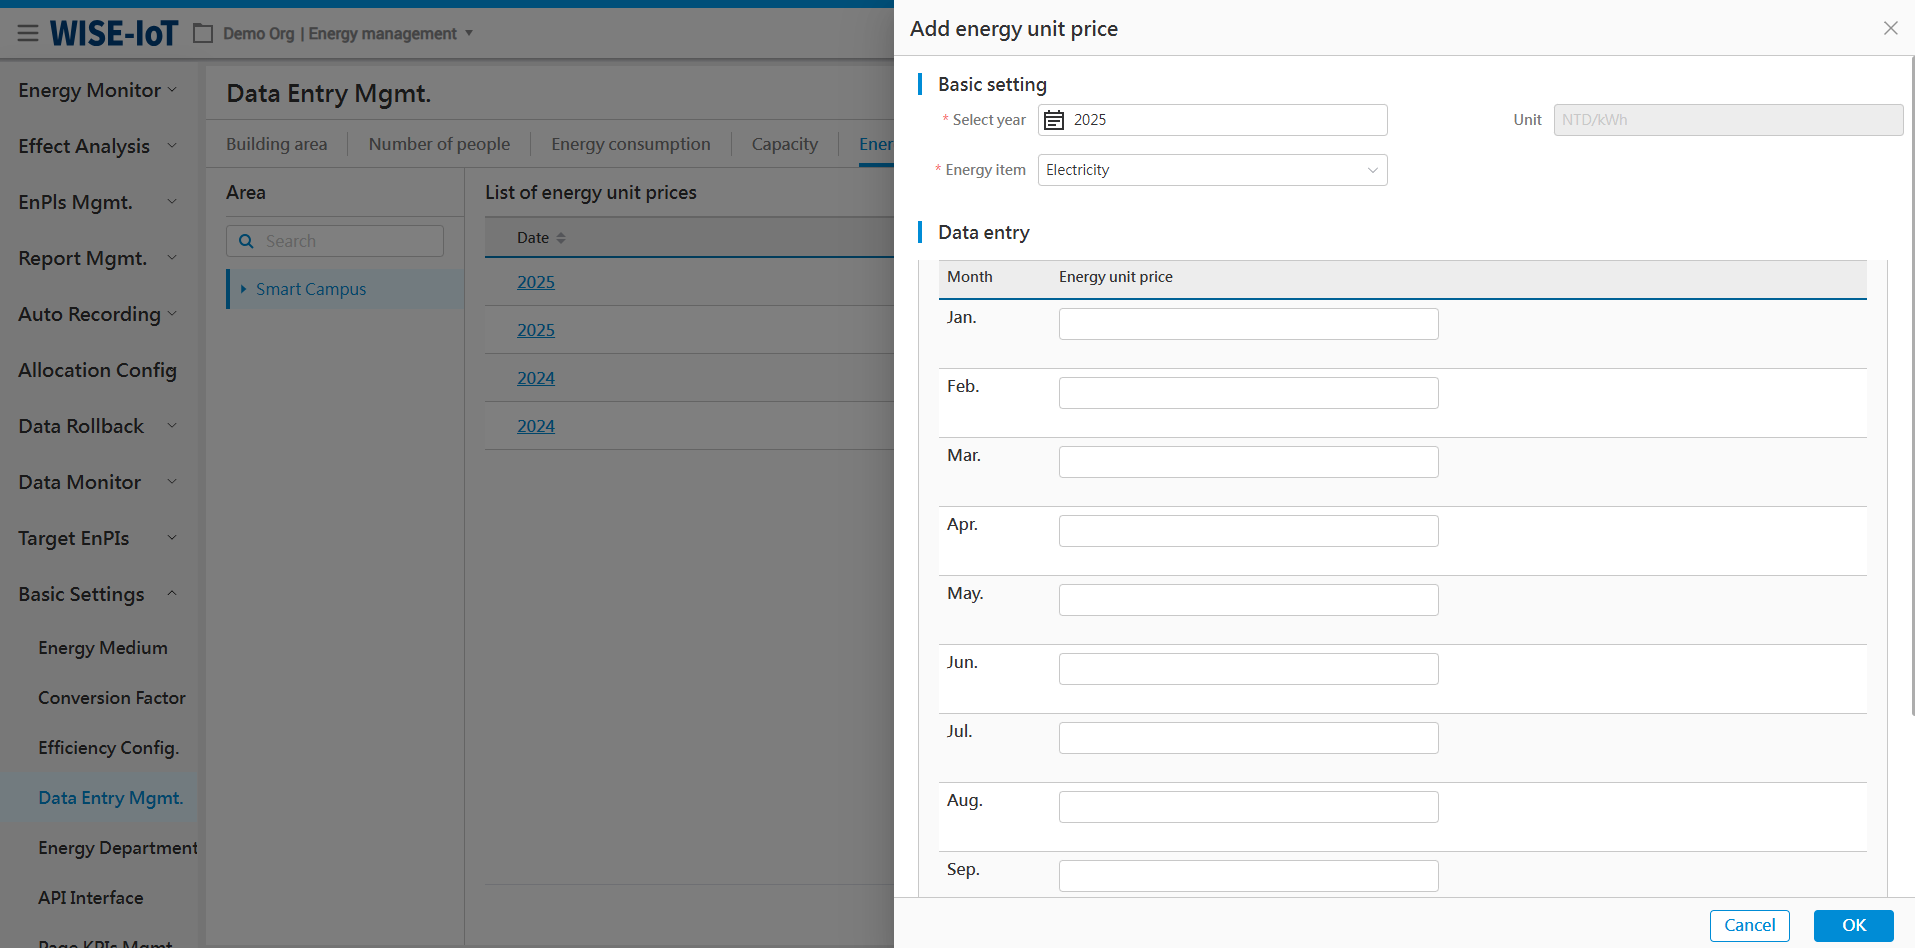
2. Select the year for unit prices and its associated energy types;
3. Enter the unit prices of each month in Data Entry field.
After entering the above information, click [Ok] to save it.
Note: Only one unit price can be saved for the same year and energy type.
Edit Energy Unit Prices
Select year in the corresponding list and click [![]() ] to modify the energy unit price for a specific area.
] to modify the energy unit price for a specific area.
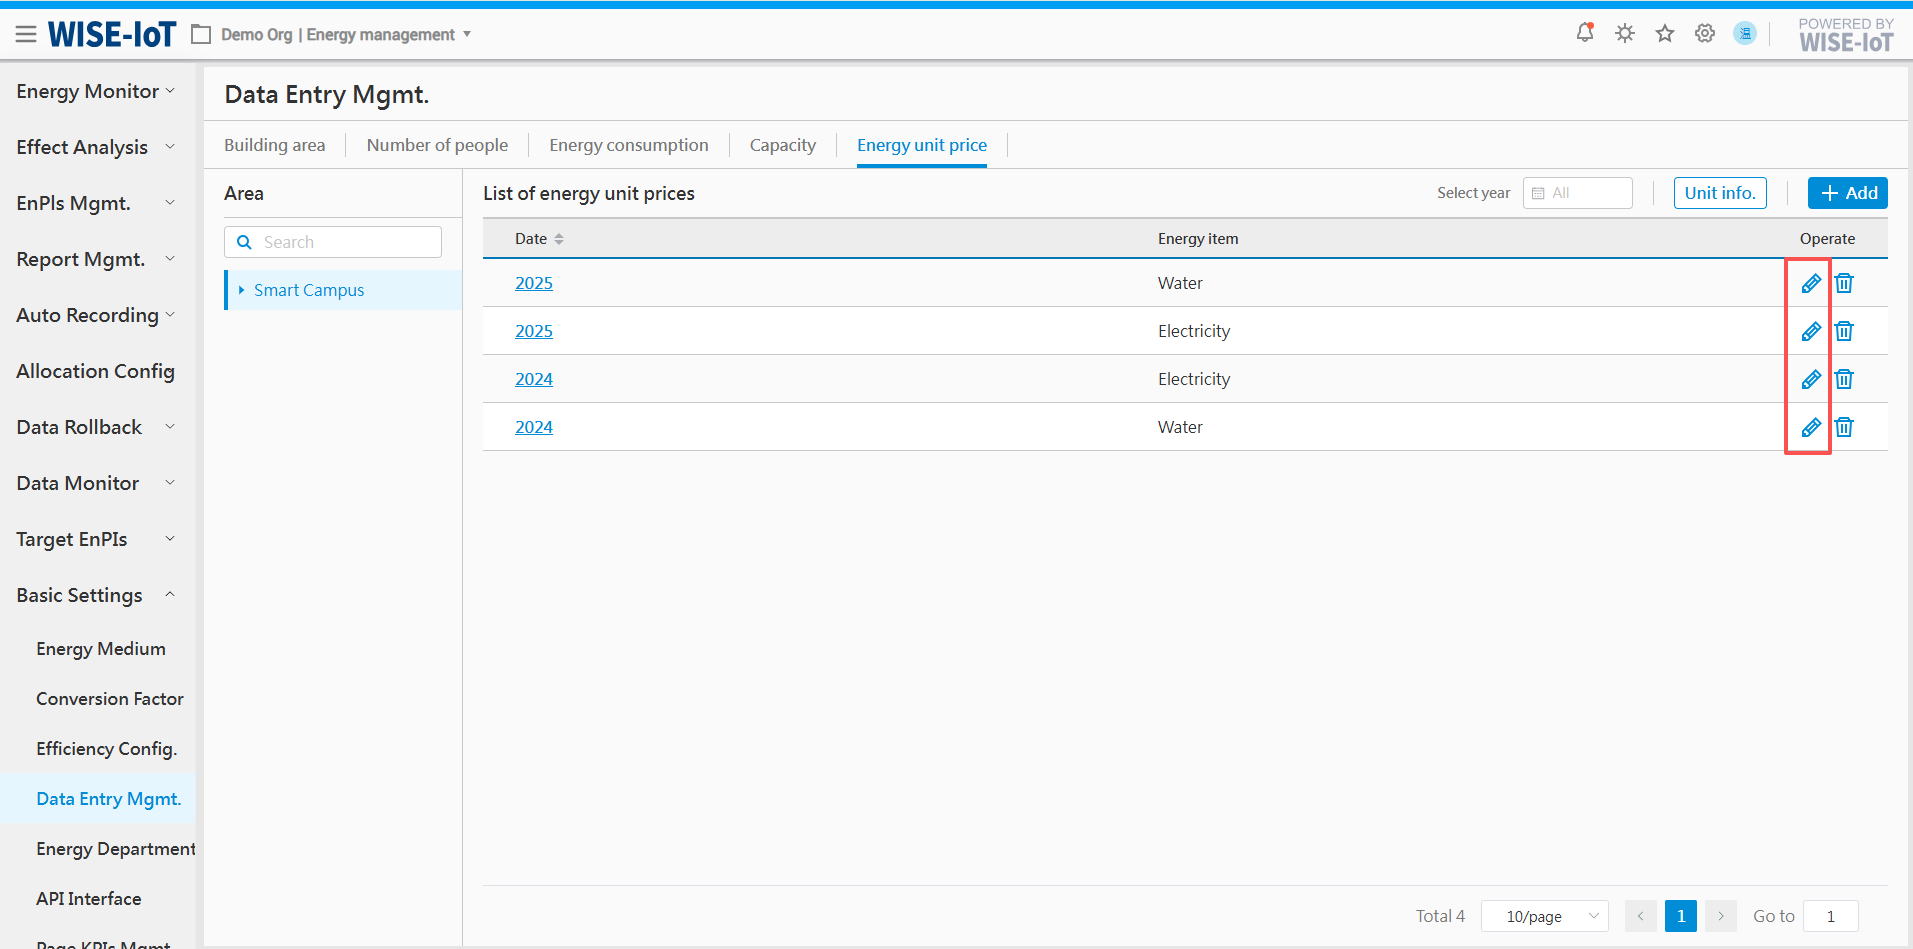
Delete Energy Unit Price
Click[![]() ]in the Energy Unit Price list to delete the energy unit prices of an area, and all related data will be deleted as well.
]in the Energy Unit Price list to delete the energy unit prices of an area, and all related data will be deleted as well.
Maintain Energy Price Unit
All displays of cost data originate from the Unit Information Maintenance interface under Data Entry Mgmt. > Energy Unit Price. The procedure is as follows:
-
Click Data Entry Mgmt. > Energy Unit Price > Unit Info.
-
Multiple currency options are available, including CNY, NTD, USD, KRW, JPY, EUR, CAD, HKD, etc. If the desired currency is not listed, input it in the text box, click Enter and THEN save the settings.
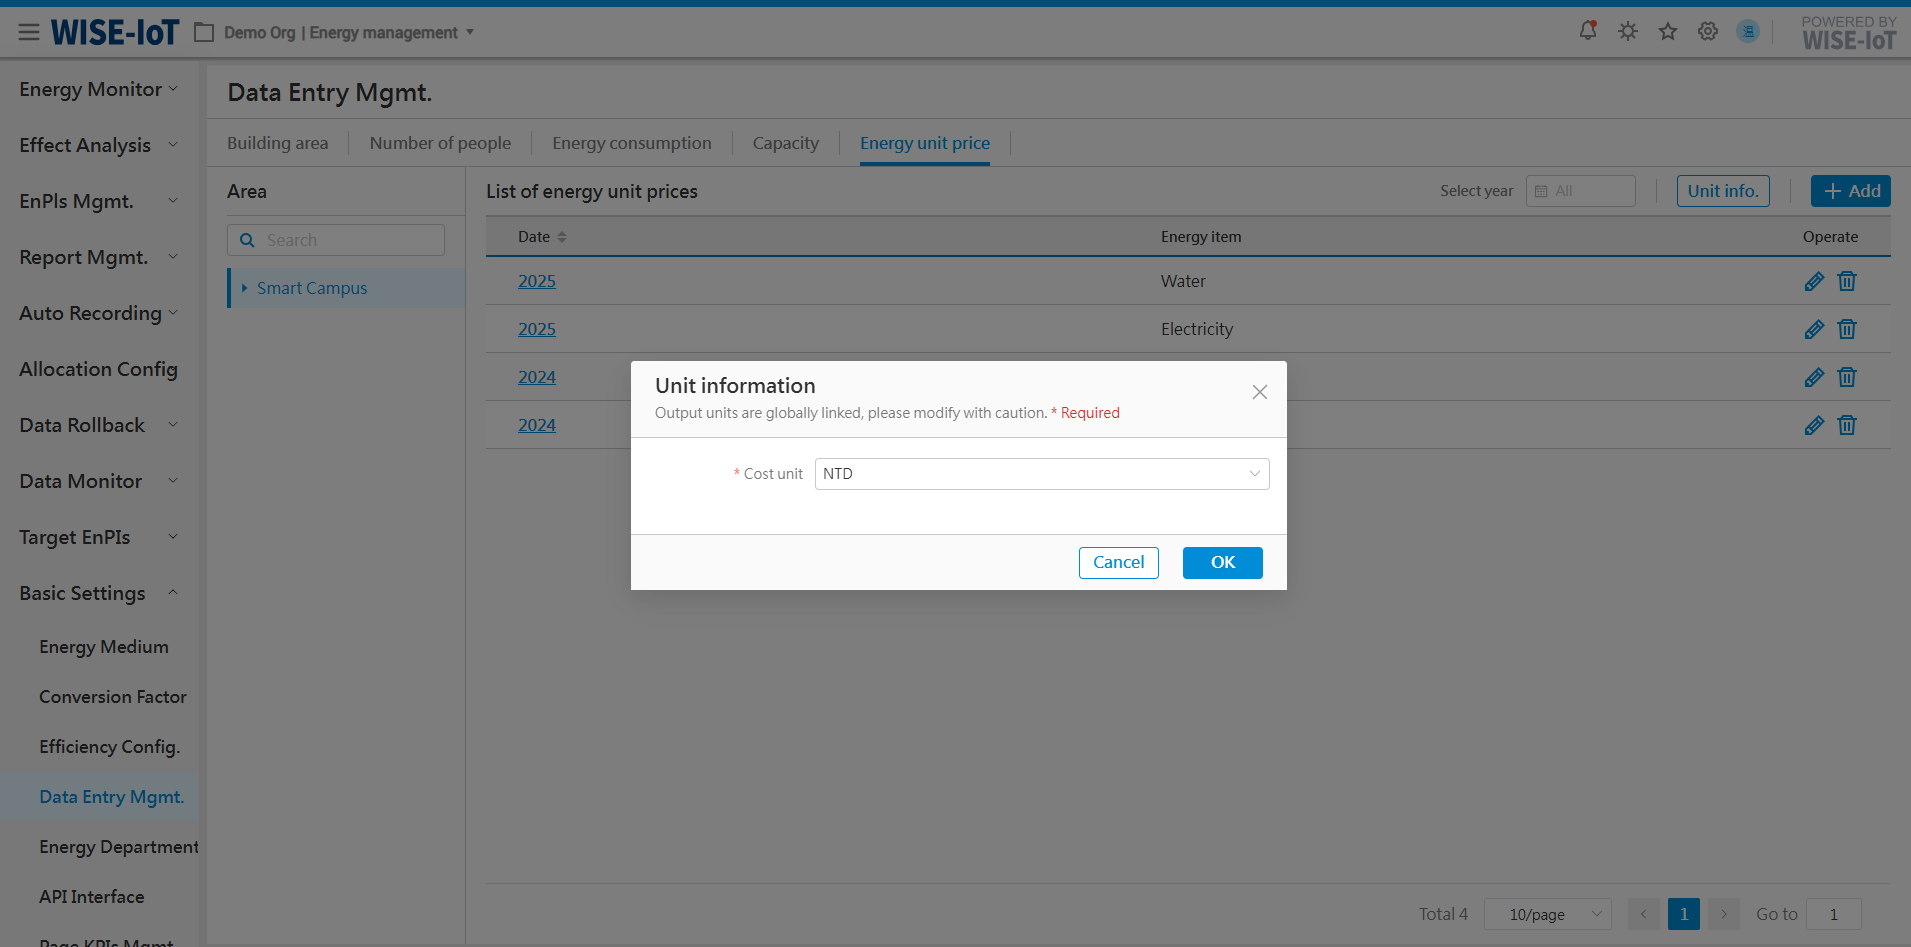
Third-party Interface for Output Value/Output
API Interface
For scenarios where ECOWatch utilizes third-party's output value/output data, the system provides standard RESTful API. Real-time data can be obtained via the third-party interface.
Before accessing a third-party interface, the following information needs to be provided:
1. The data type captured is output value and output.
2. The unique key or code of the data. Associate third-party data with ECOWatch topology nodes via code;
3. Description of API access methods and parameter specifications.
After preparing the required materials, configure the integration in ECOWatch Basic Settings > API Interface.
Add Interface
Click Basic Settings > API Interface to navigate to the Interface List interface:
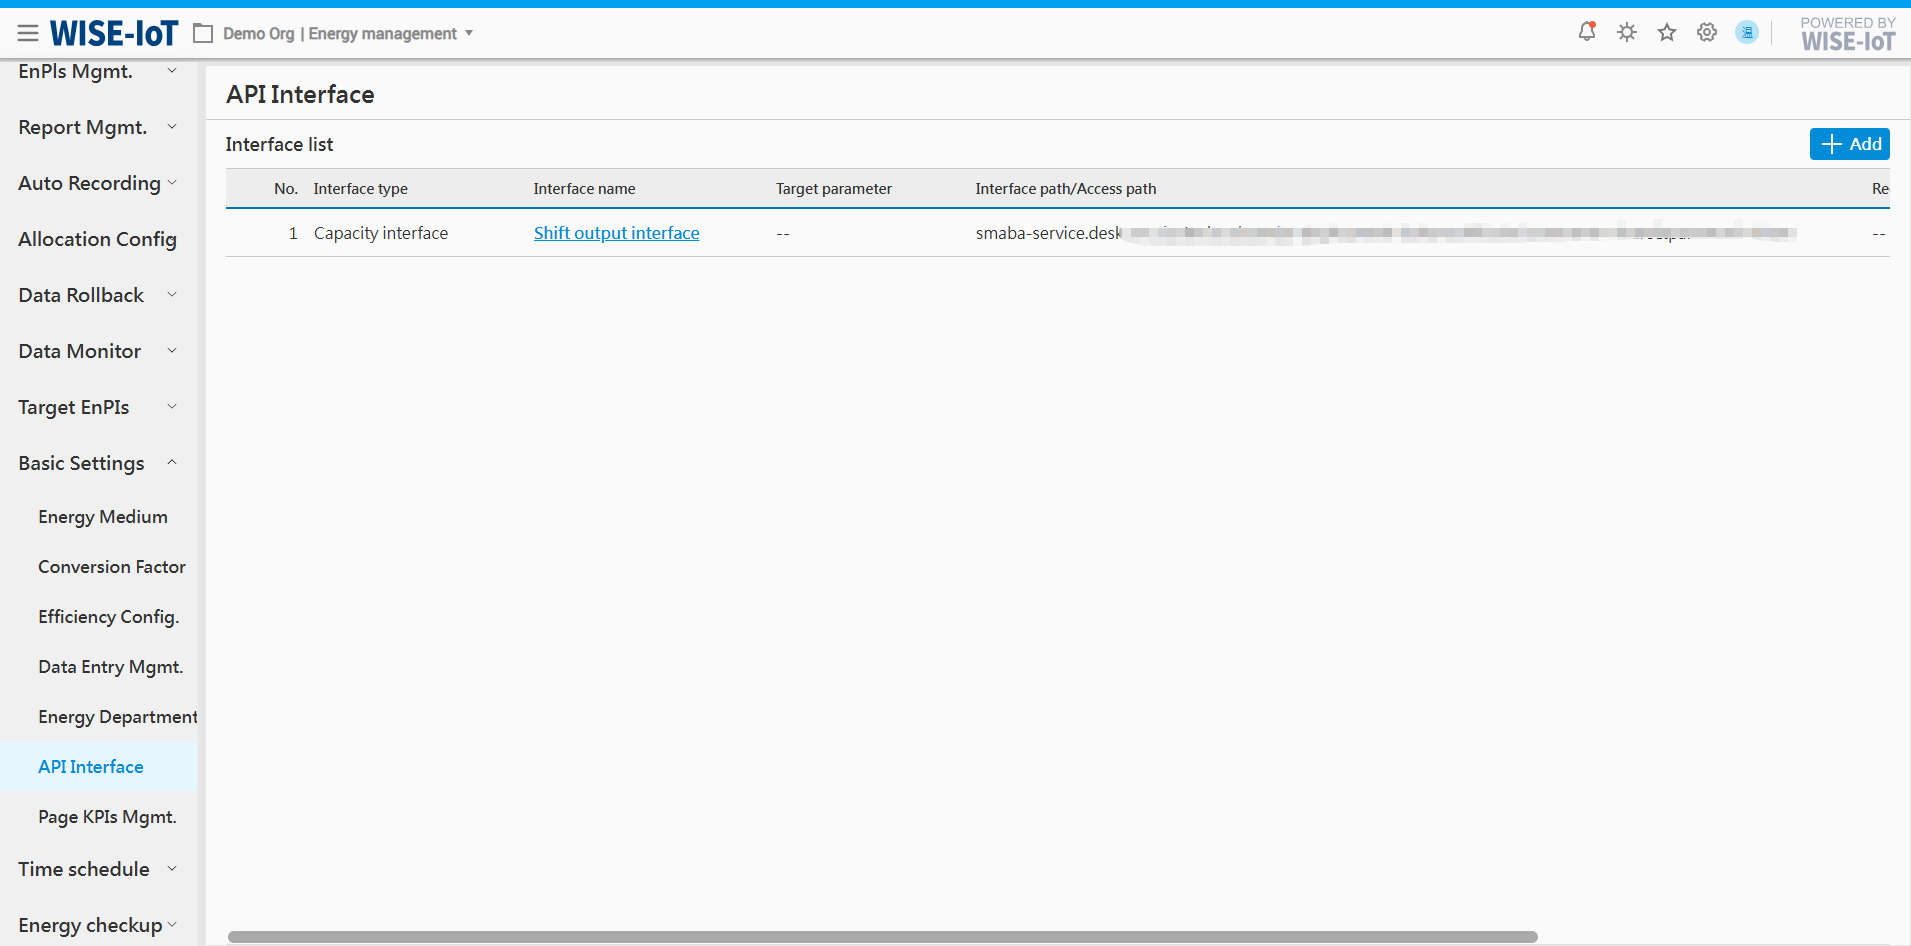
Click [Add Interface] to access the Third-party Interface Creation page:
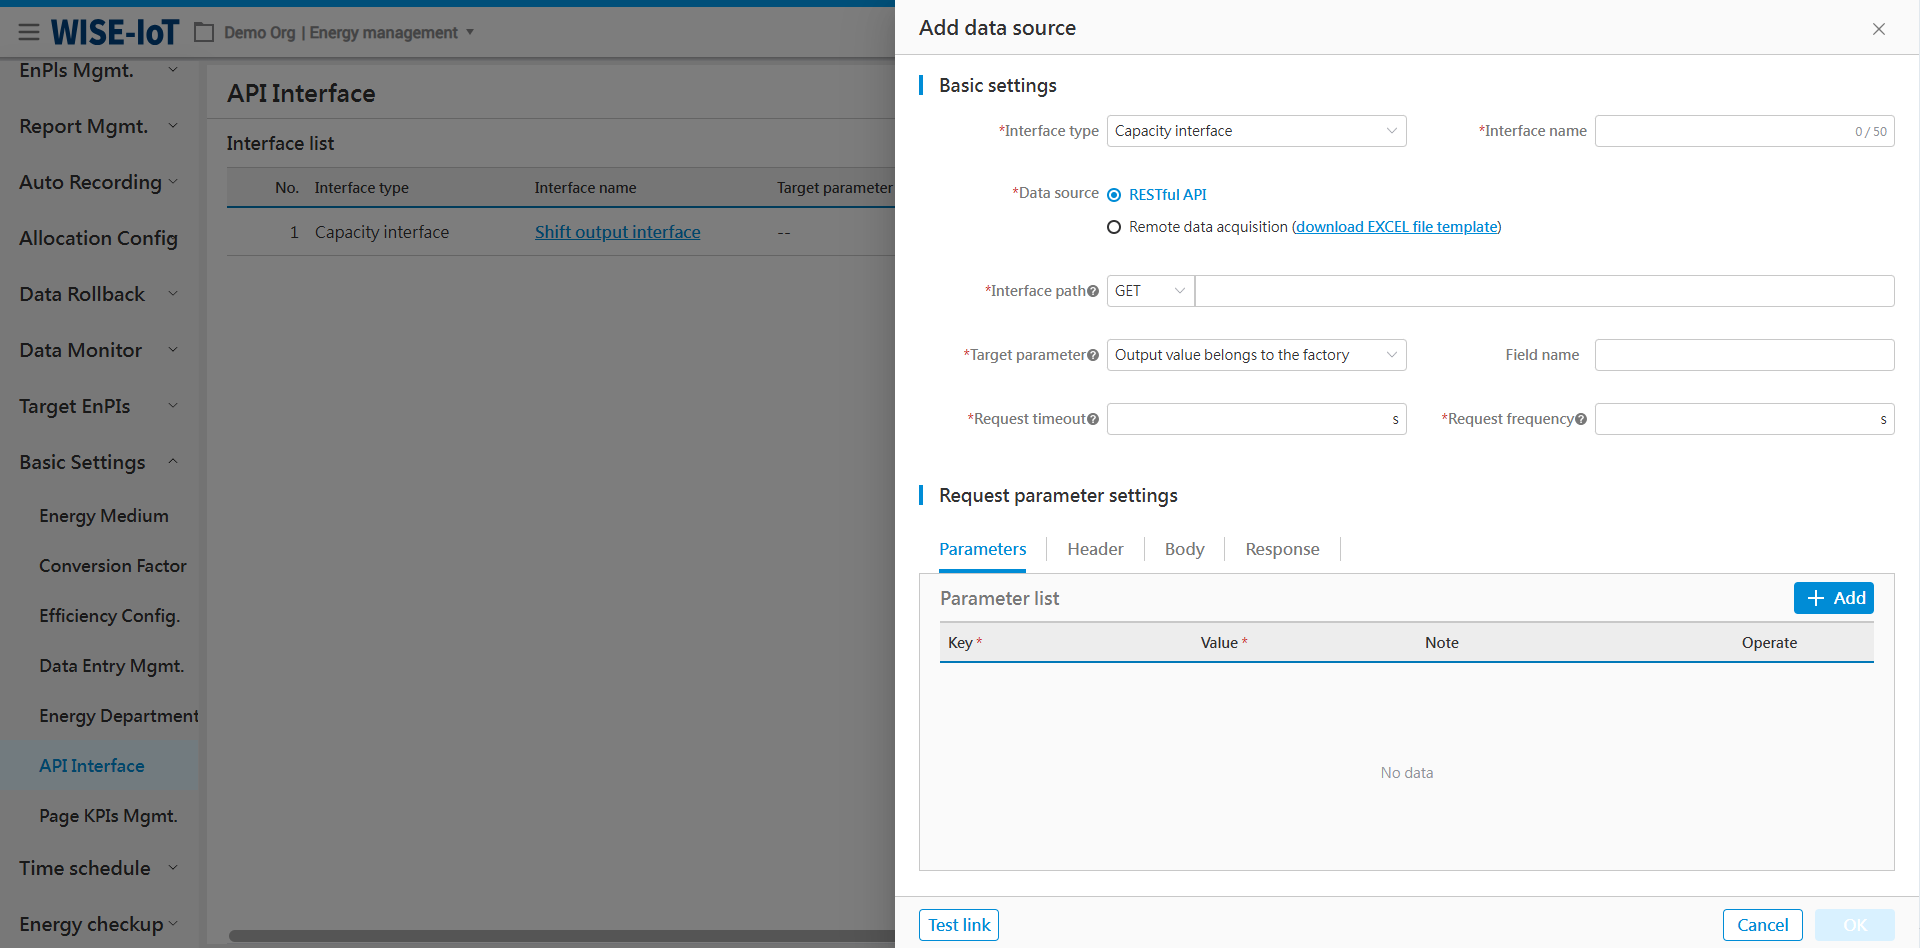
Take the output value and output interface as an example. Enter the following information:
-
Interface type: output value/output interface
-
Interface name: Customizable based on user preference;
-
Data source: Select RESTful API;
-
Interface path: Provided by the user;
-
Target parameters: ECOWatch currently uses output value and output. Select according to the user interface's actual needs;
-
Request timeout: 15 seconds (shall not be too long);
-
Interface request frequency: When set to 0, only one request is made. When greater than 0, data is requested according to the actual configuration.
-
Following parameters are required.
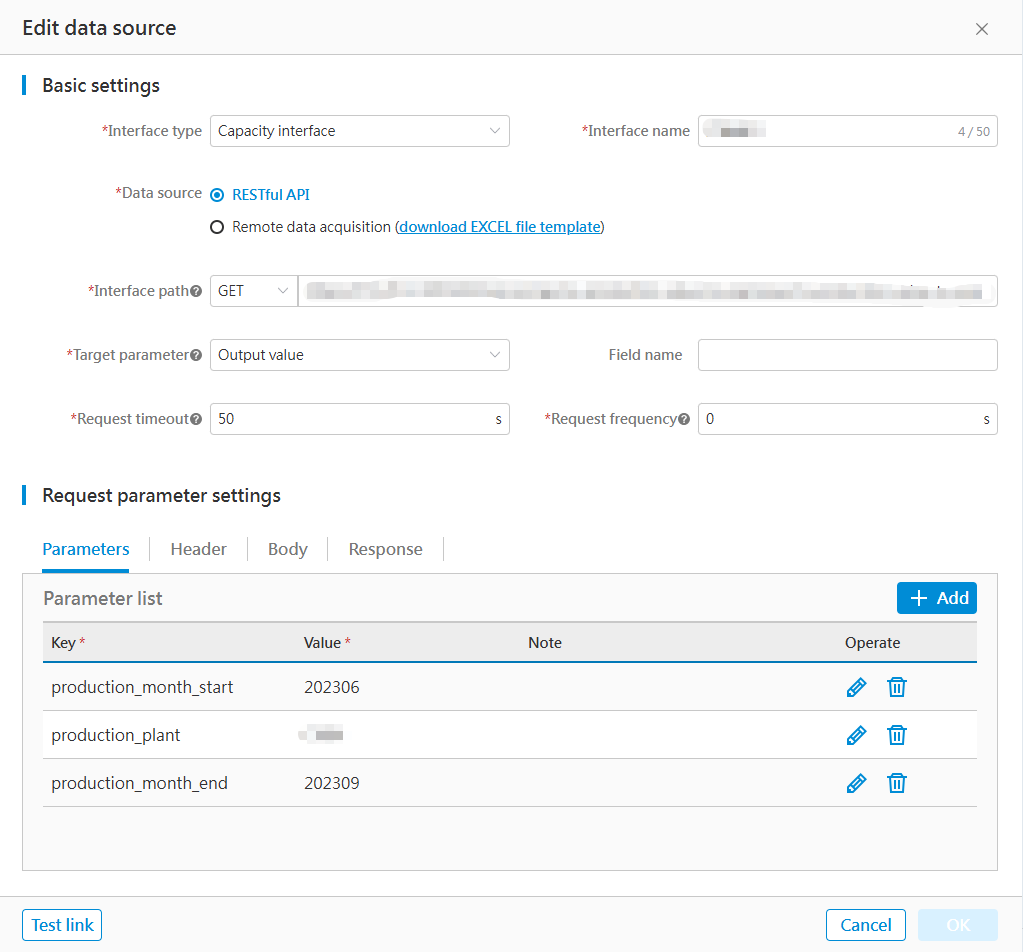
1) Click [Add] to add parameter information;
2) Click [
] to modify parameters and click [
]to save the changes;
3) Click [
]to delete parameter information.
8. The header varies depending on the interface acquisition method. Below are some examples:
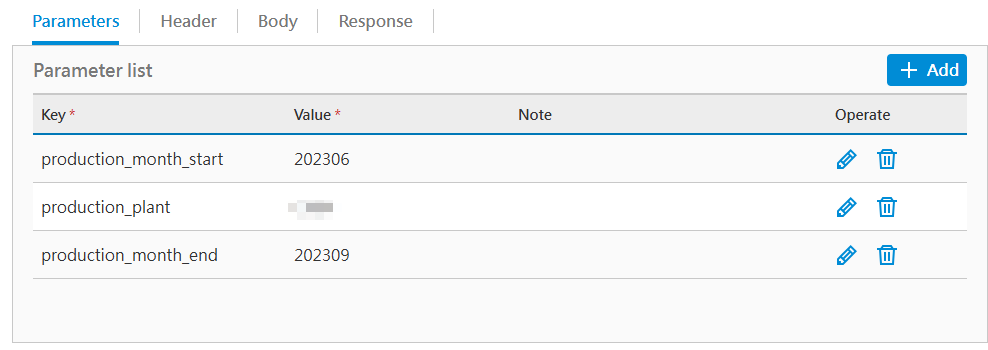
The operation logic for [Add], [Edit], and [Delete] is consistent with that of the Parameters and thus will not be repeated here.
9. After completing all configurations and verifying their accuracy, click[Test link] in the lower-left corner, the system will display either a Connection Success or Connection Failure message in the[Response]module.
10. Upon successful connection, click [Ok] to save the configuration.
A third-party interface is added.
The following is a reference for the output value/output interface of Kunshan Factory:
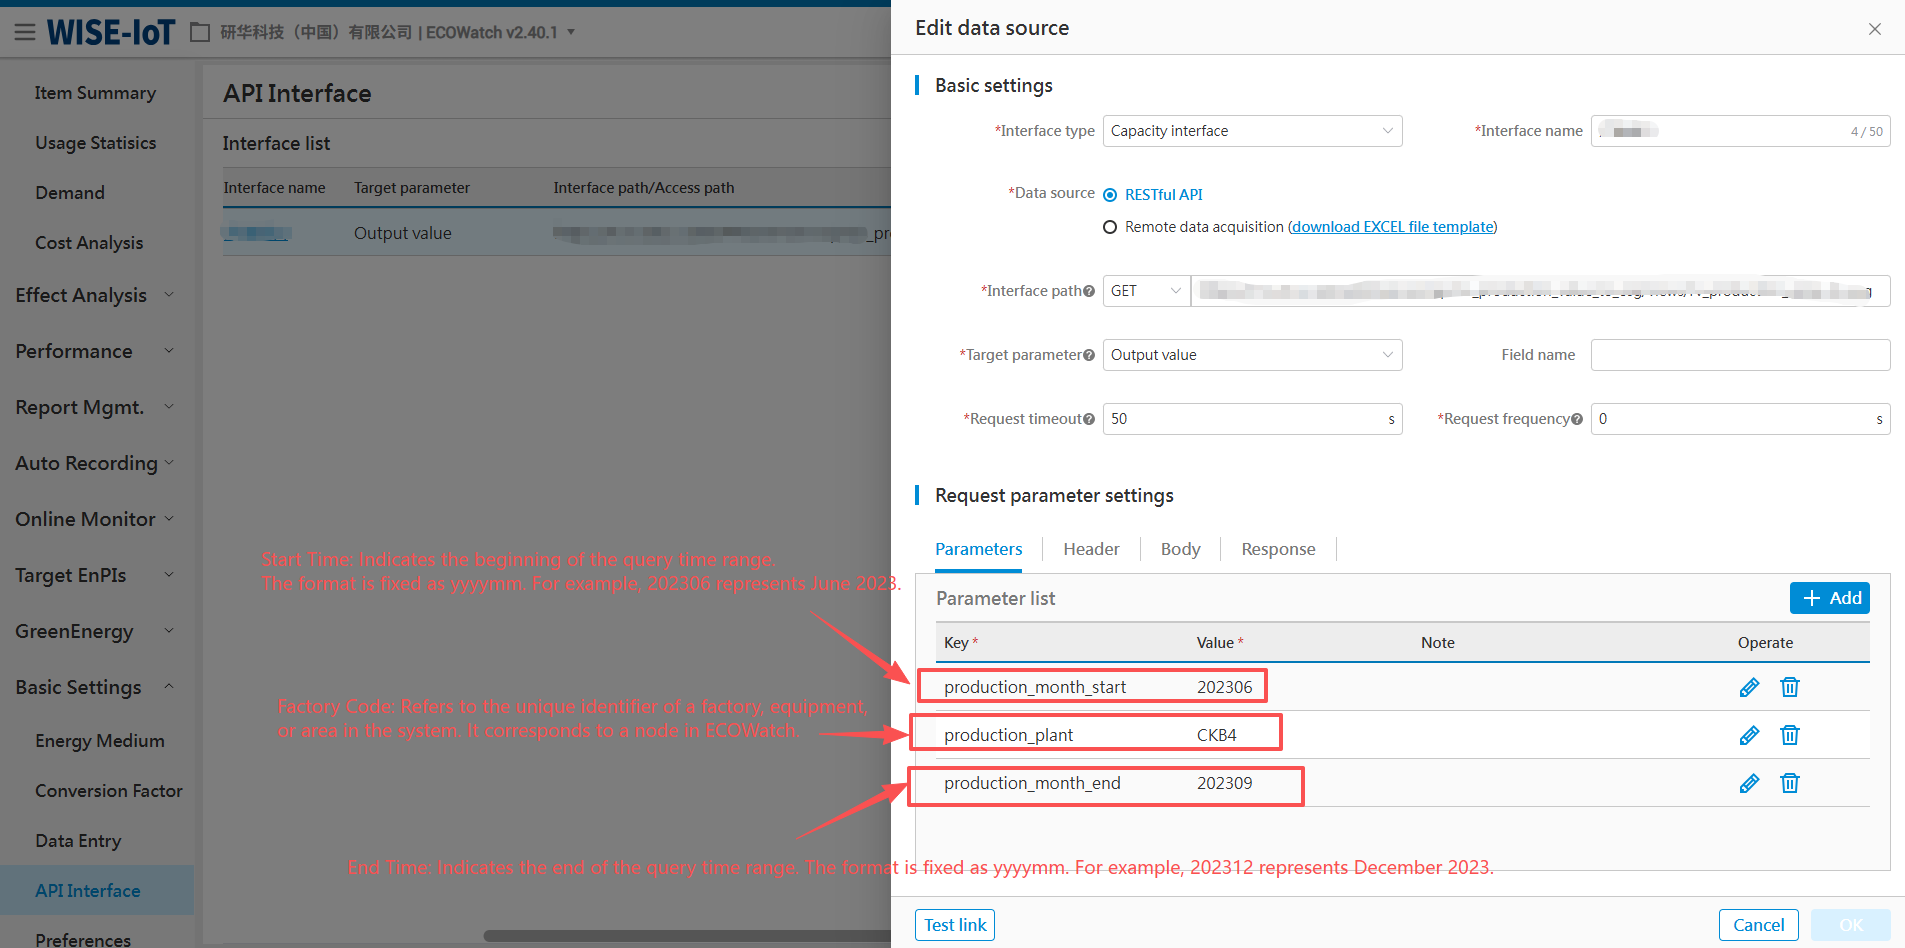
Return parameter details:
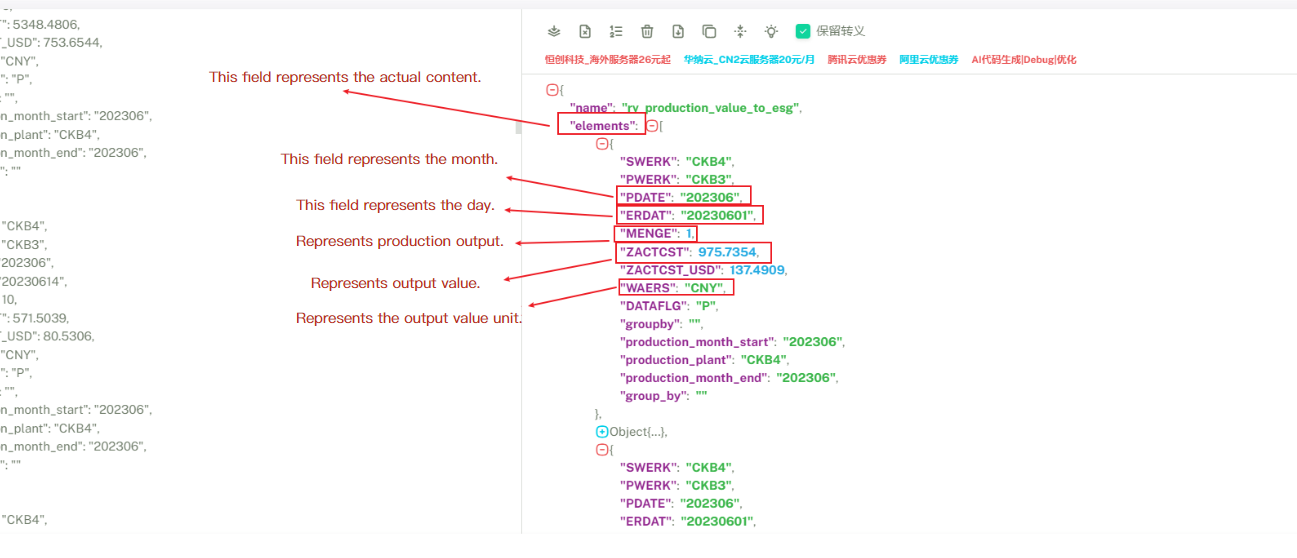
Obtain Remote Data
If clients cannot provide a standard RESTful API interface, output value/output data may be obtained via remote file.
The following materials must be prepared for remote data acquisition:
-
Users fill in the files using ECOWatch-provided Excel templates.
-
Provide the Excel file path accessible via smb credentials authentication
After preparing the above materials, users can perform operations in the ECOWatch Basic Settings - Third-Party Data Sources.
Add Interfaces
In the interface list, click [Add Interface] to enter the Third-Party Interface Creation page. Select "Remote Data Retrieval" from the Data Source dropdown menu:
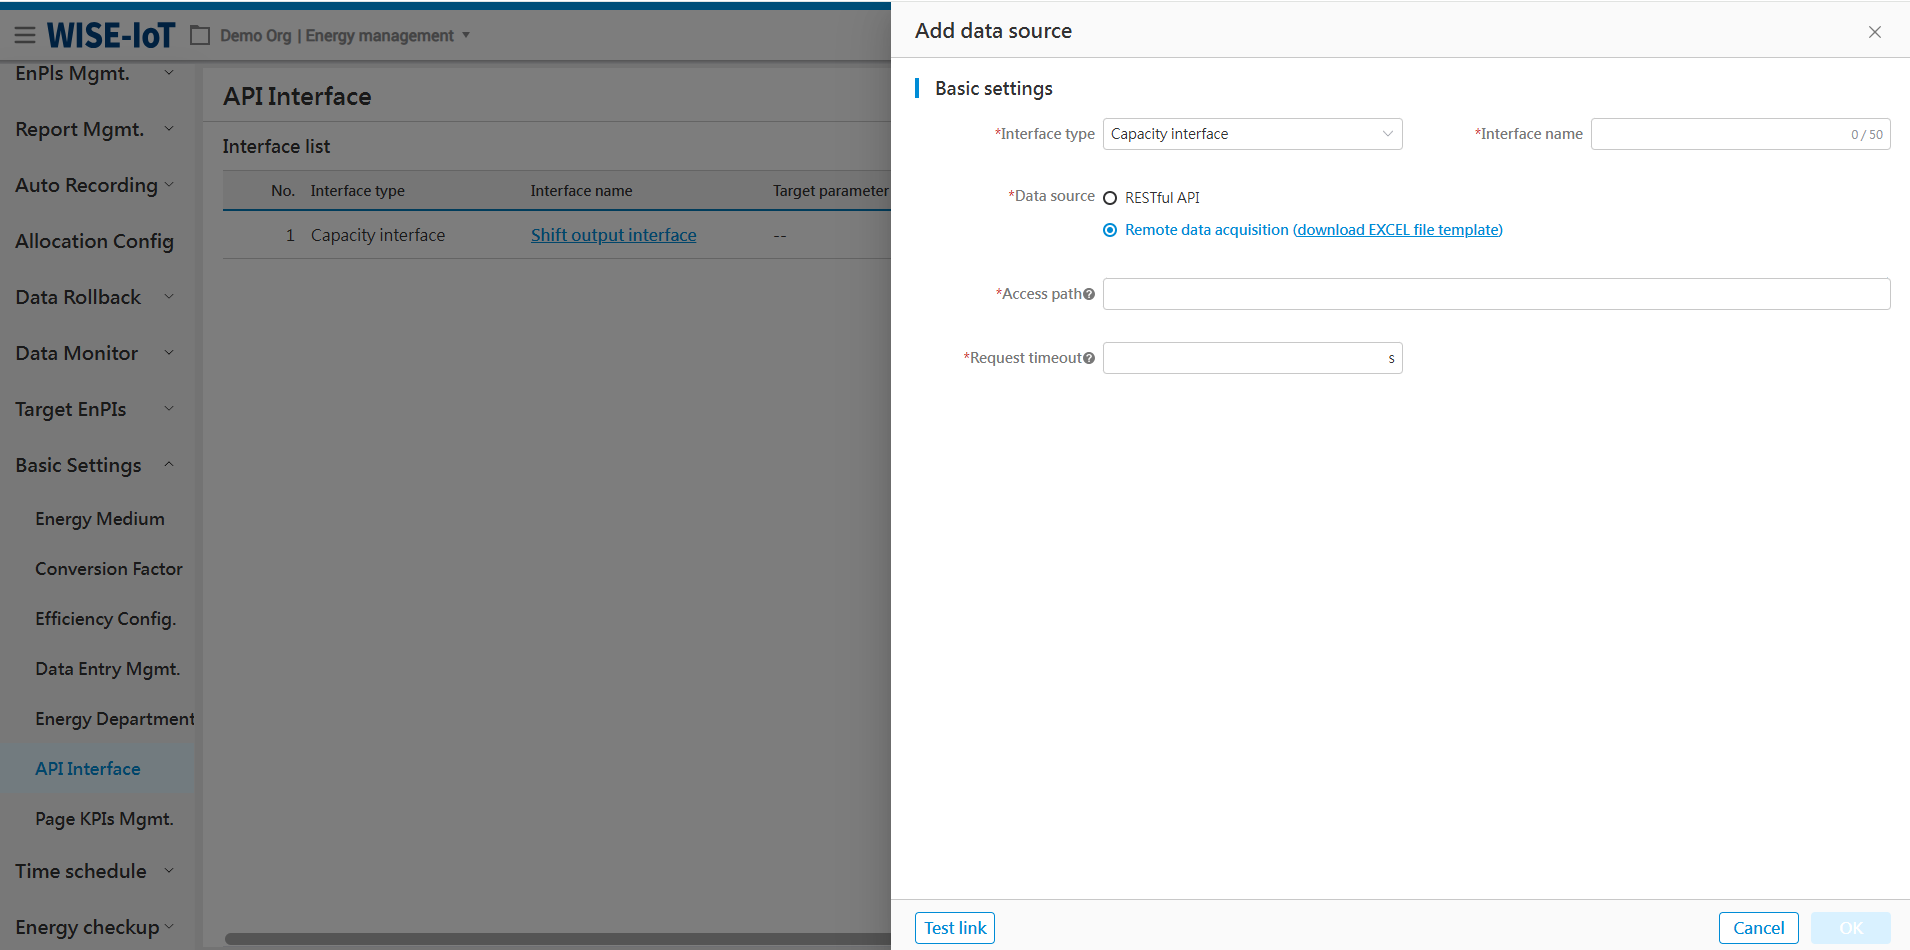
Text Data acquisition instructions:
-
Click "Download Excel file template" to obtain the text data filling template
-
When configuring the smb credential access method for text files, the access path should follow the specified format: IP: Device Name: Shared Folder Directory: Text File Name? username=****&password=******
(1) IP: The IP address of the computer where files are stored.
(2) Device name: The name of the device where files are stored.
(3) Shared folder directory name: The name of the folder directory where files are stored.
(4) File name: The name of the Excel file entered.
(5) Username: Authorized account for smb access path.
(6) Password: Authorized password for smb access path.
- After filling in all fields in the interface, click "Test link" in the lower-left corner until the system prompts "Connection successful", then save the configuration by clicking [Ok].
Edit interfaces
Click [![]() ] to modify an output value/output interface.
] to modify an output value/output interface.
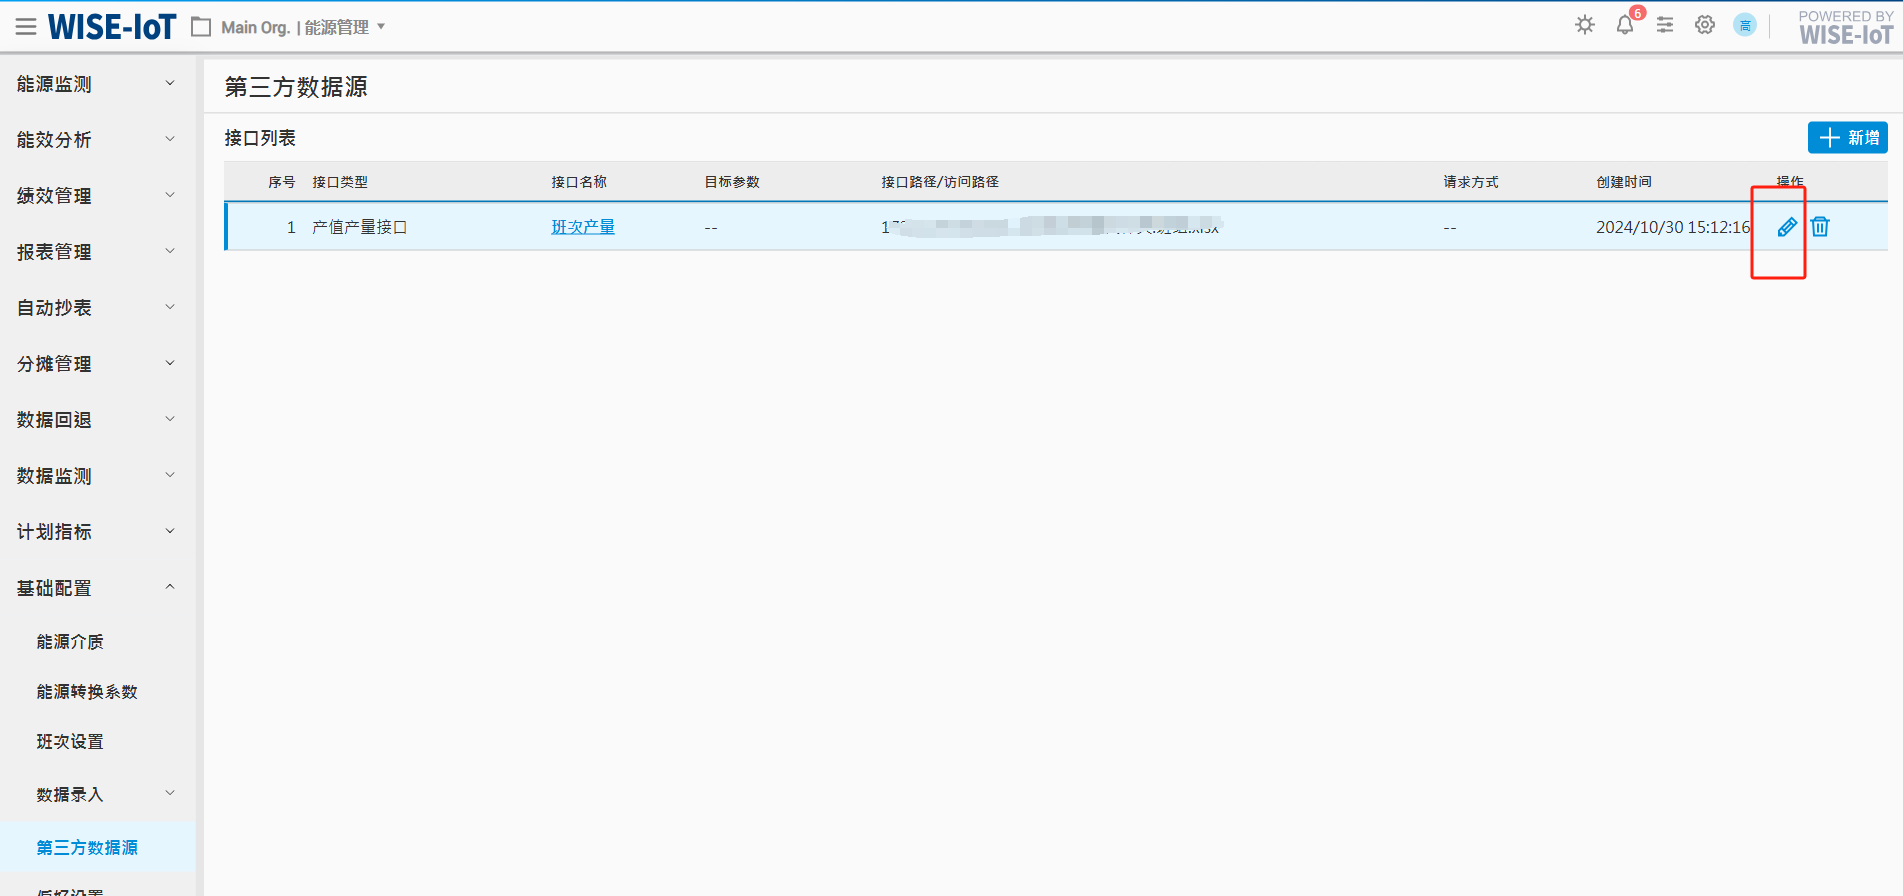
The operation logic for the Edit interface is consistent with that of the [Add] interface, thus will not be repeated here.
Delete Interfaces
Click[![]() ] in the interface list to delete an interface.
] in the interface list to delete an interface.
Page KPIs Mgmt.
This module supports personalized display on certain pages of ECOWatch, such as whether a panel is shown or hidden, and setting default initial conditions when the interface is loaded.

Global Settings
Click "Global Settings" tab to configure performance indicators globally, which is applied to all data displays in performance indicator-related filters, charts, and tables.
Performance indicators fall into two types:
- Energy usage indicators include energy usage, usage-to-output ratio, usage-to-output value ratio, usage per unit area, usage per capita. Among these, energy usage is displayed by default and cannot be hidden.
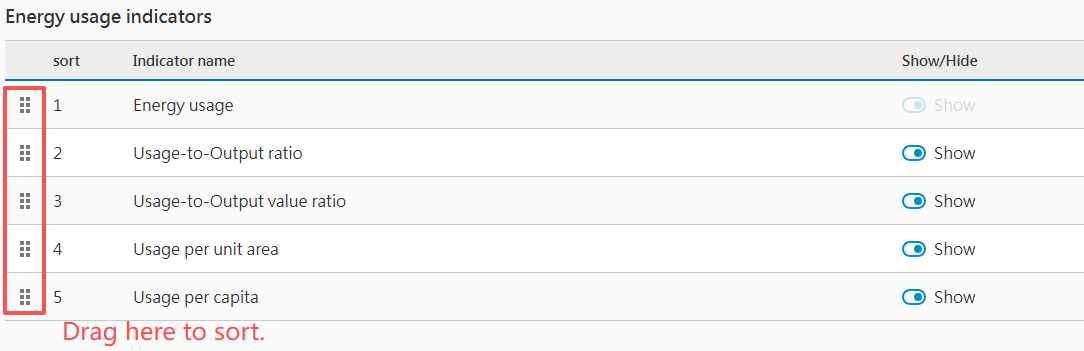
- The energy cost indicators include energy cost, unit price, cost per unit output, cost per unit output value, cost per unit area, and cost per capita. Among these, energy cost is displayed by default and cannot be hidden.
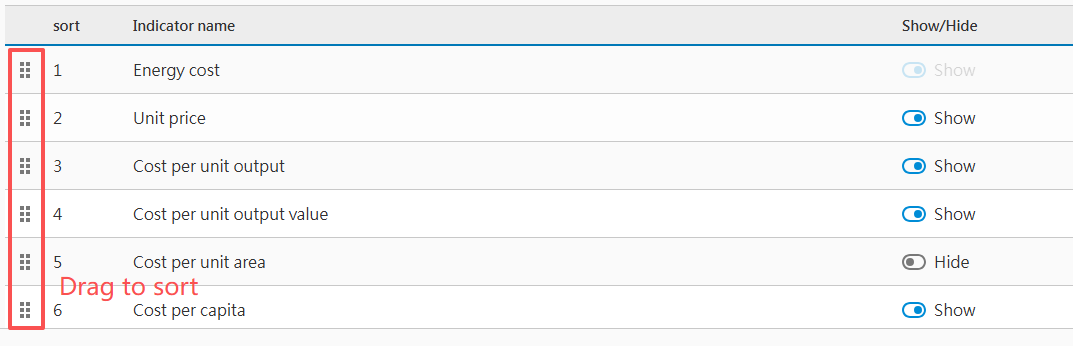
Single Page Configuration
Item Summary Configuration
Select "Item Summary" in the page on the right to initialize the page settings.
Choose an energy type such as "Electricity" in the dropdown menu to configure the followings:
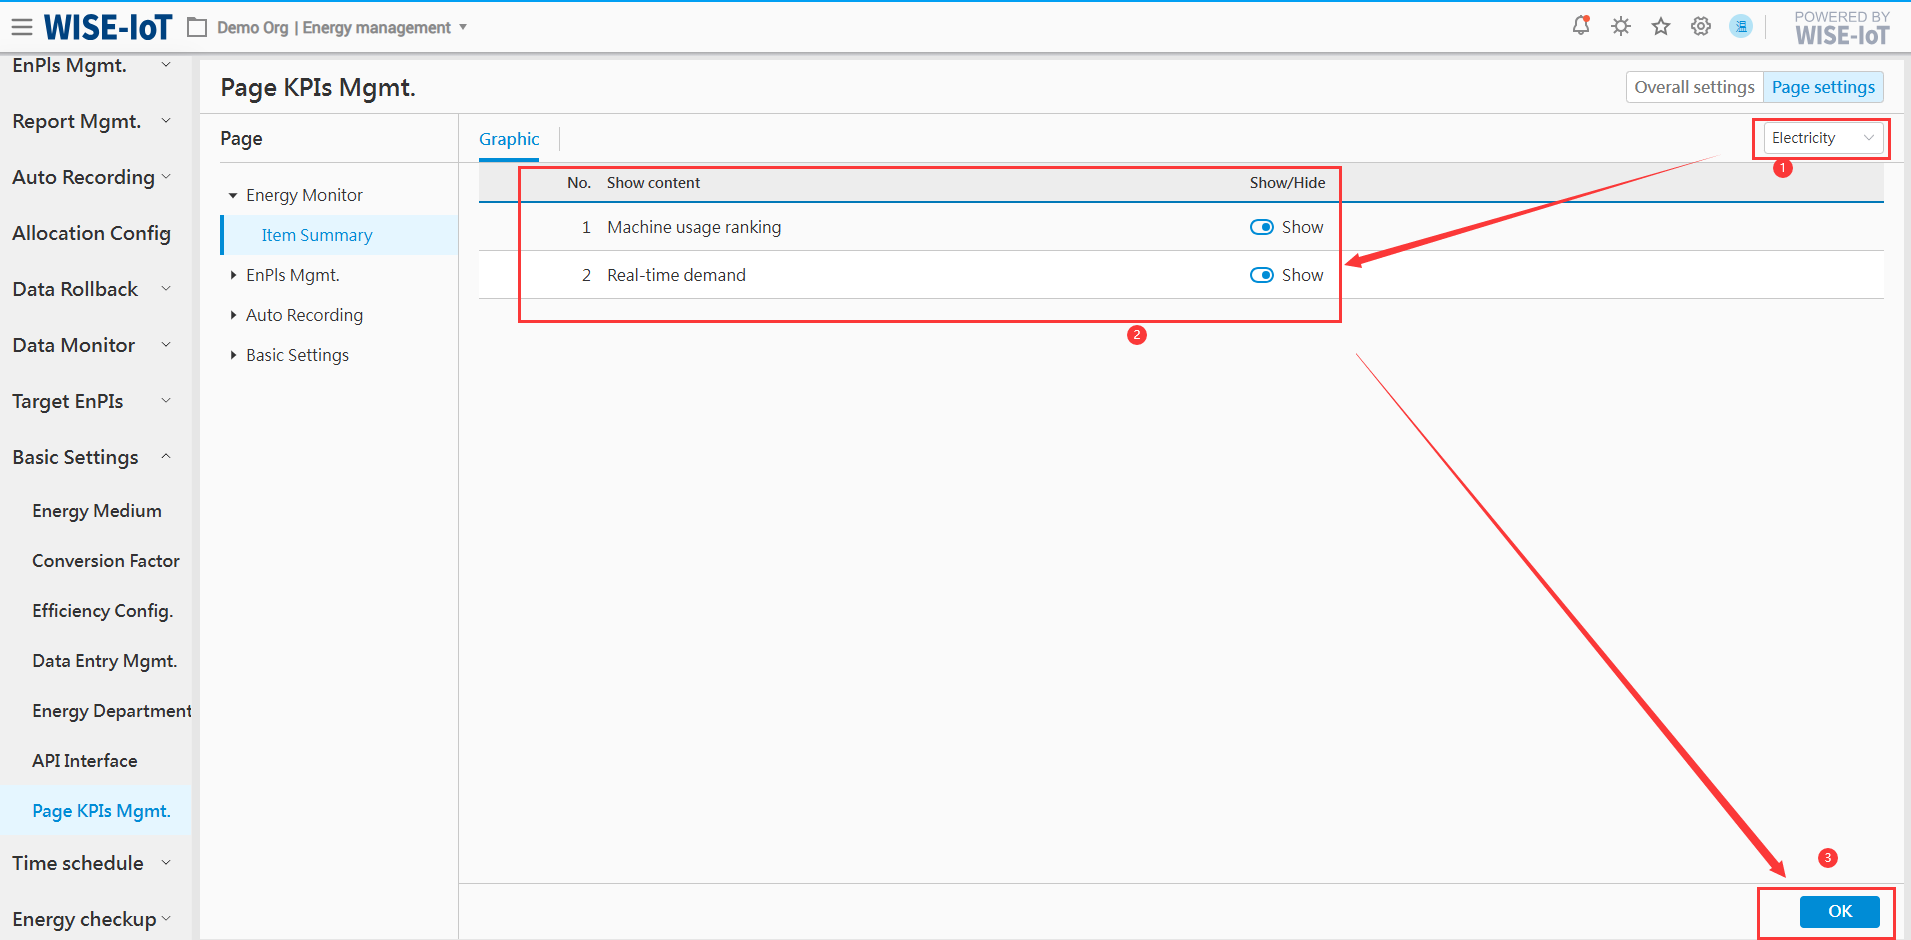
EnPIs Benchmark Configuration
Select "EnPIs Mgmt. > EnPIs Benchmark" on the right to initialize benchmarking content.
This section primarily handles display configurations for the table at the bottom of the [EnPIs Benchmark]page, which has two parts:
-
Performance indicators include energy usage, usage-to-output ratio, usage-to-output value ratio, usage per unit area, usage per capita. These indicators are sourced from the Global Settings > Energy Usage Indicators module.
-
Other indicators include output, output value, area, headcount, etc., which are configured on the page :
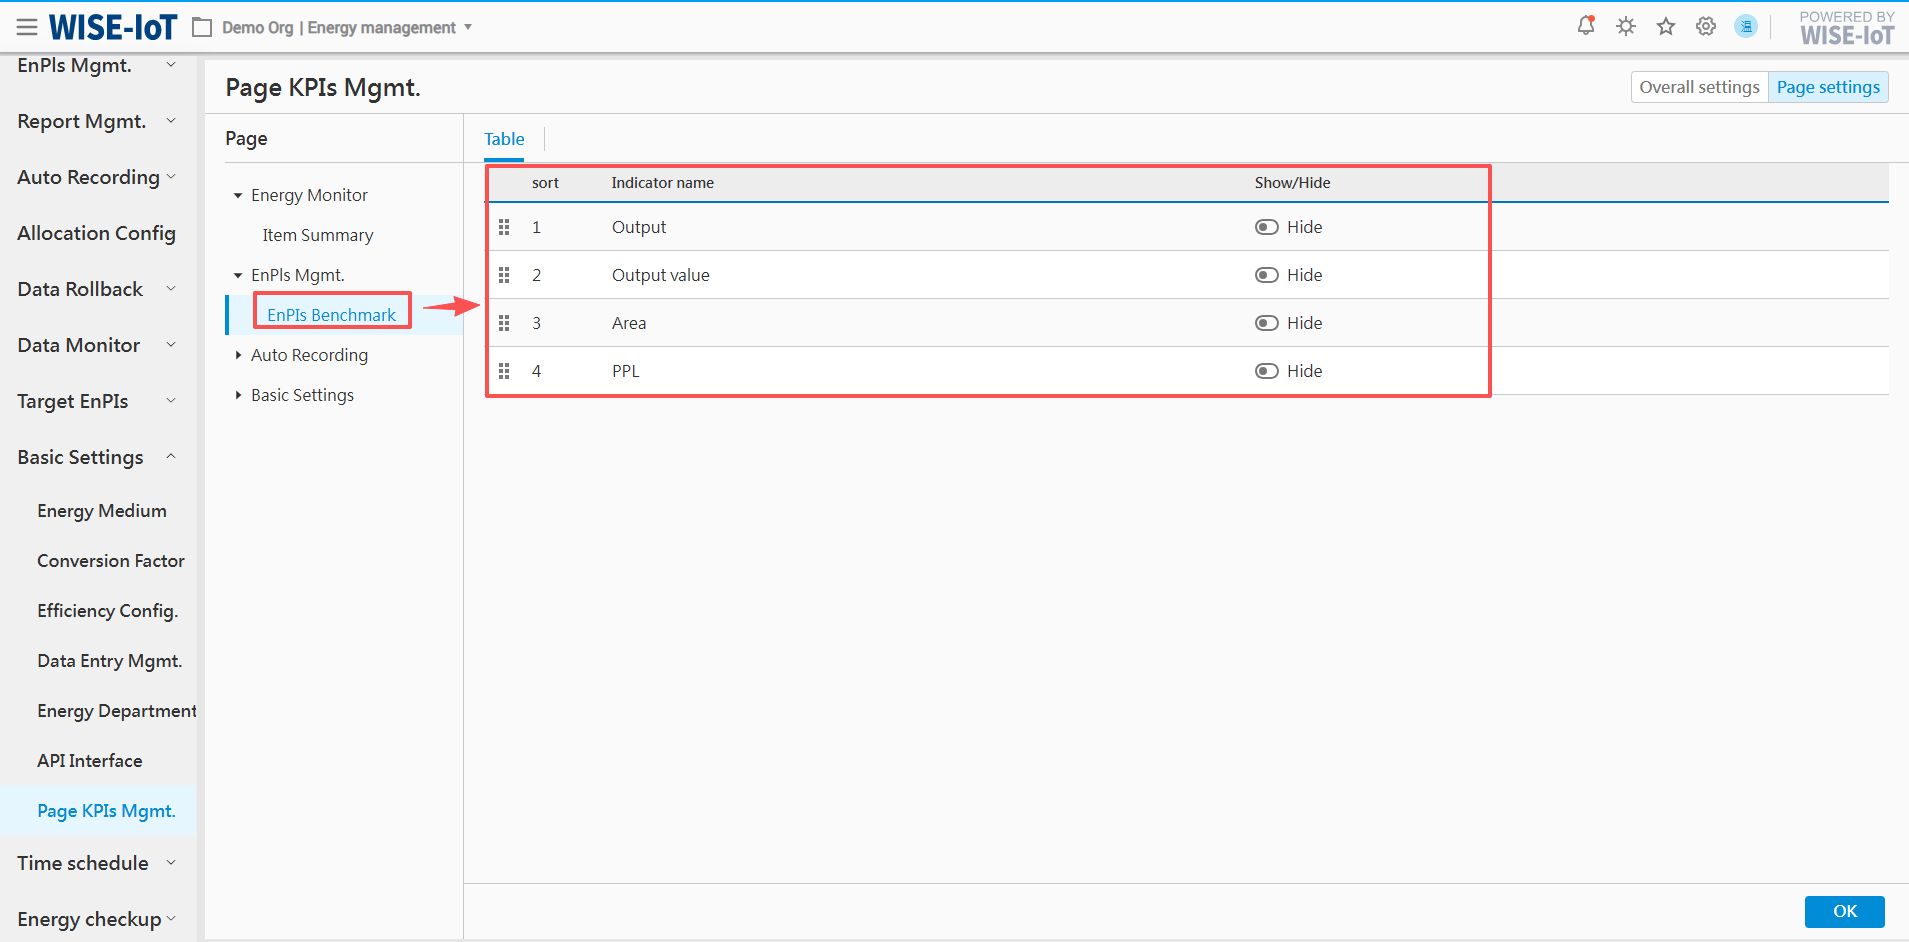
Meter Usage Configuration
Select Automatic Reading > Metere Usage on the right of the page to initialize the Metered Usage page.
This section configures the Report Type under filter conditions. Select an option in the "Default Option" column on the right, then save the settings:
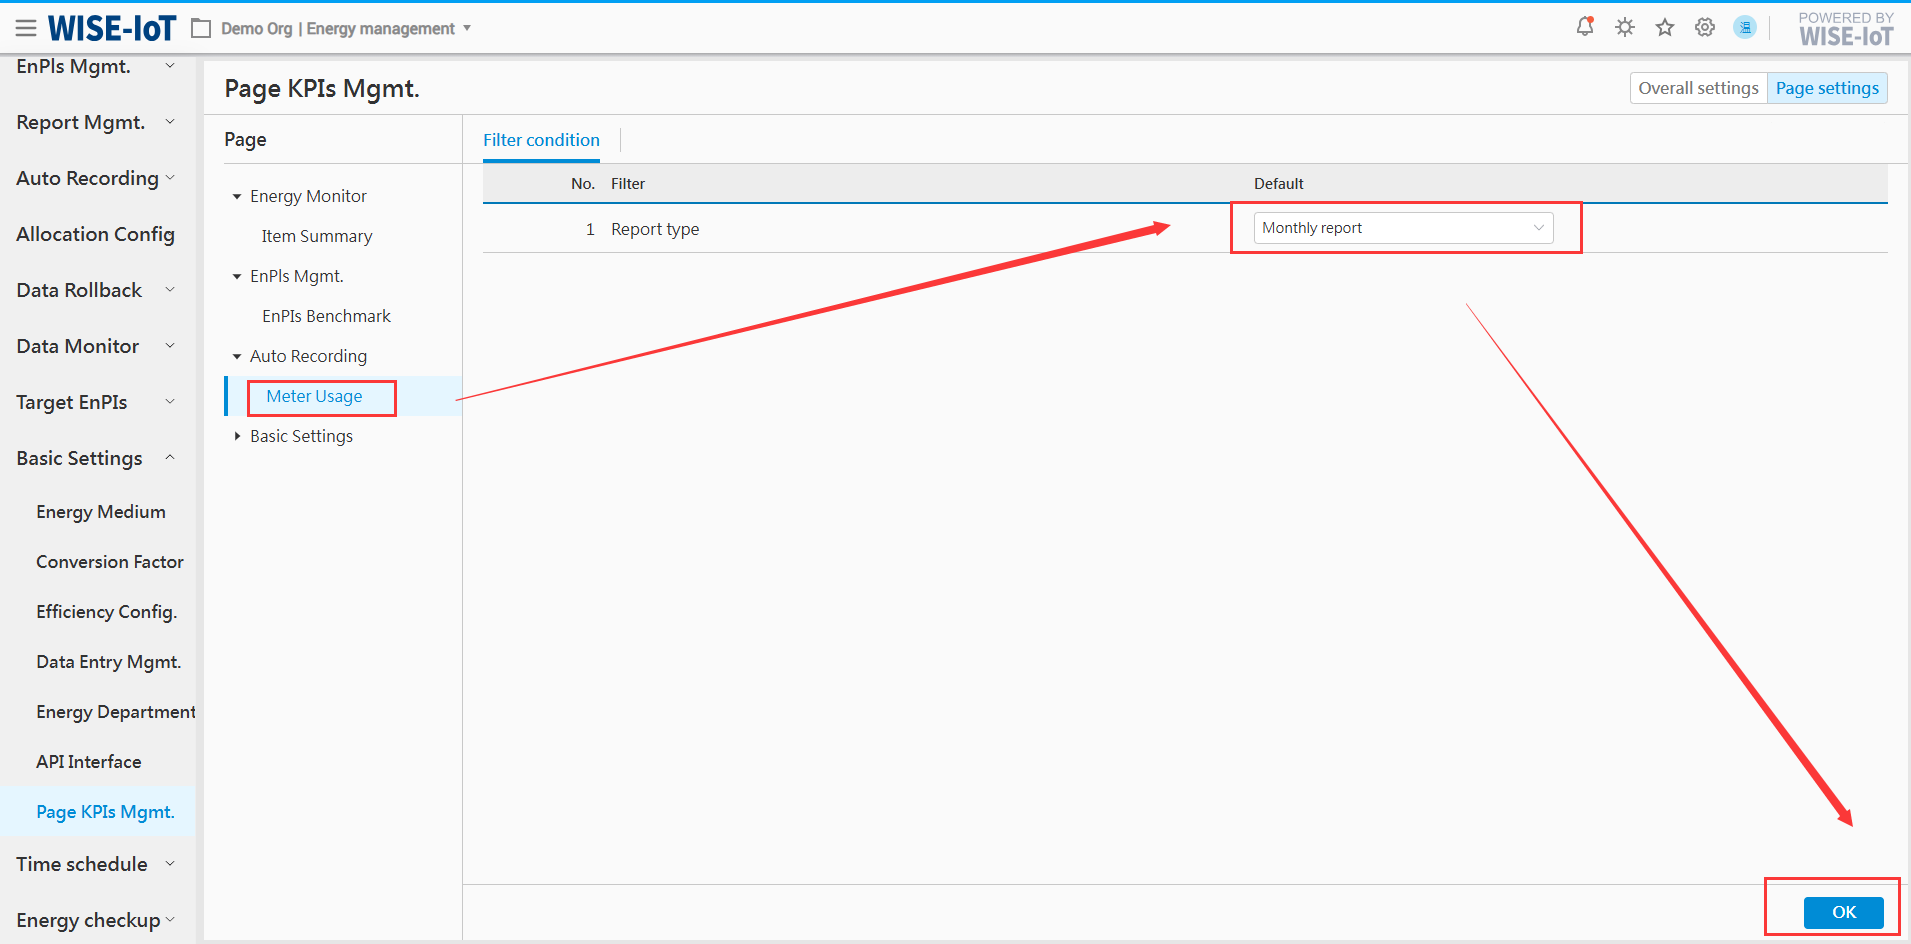
Data Entry Configuration
On the right-side page, select Basic Settings > Data Entry Management to initialize the settings for the data entry page.
This section allows configuration of tab display in the page, supporting the option to show or hide different tabs. Once configured, save the settings as shown in the figure below.
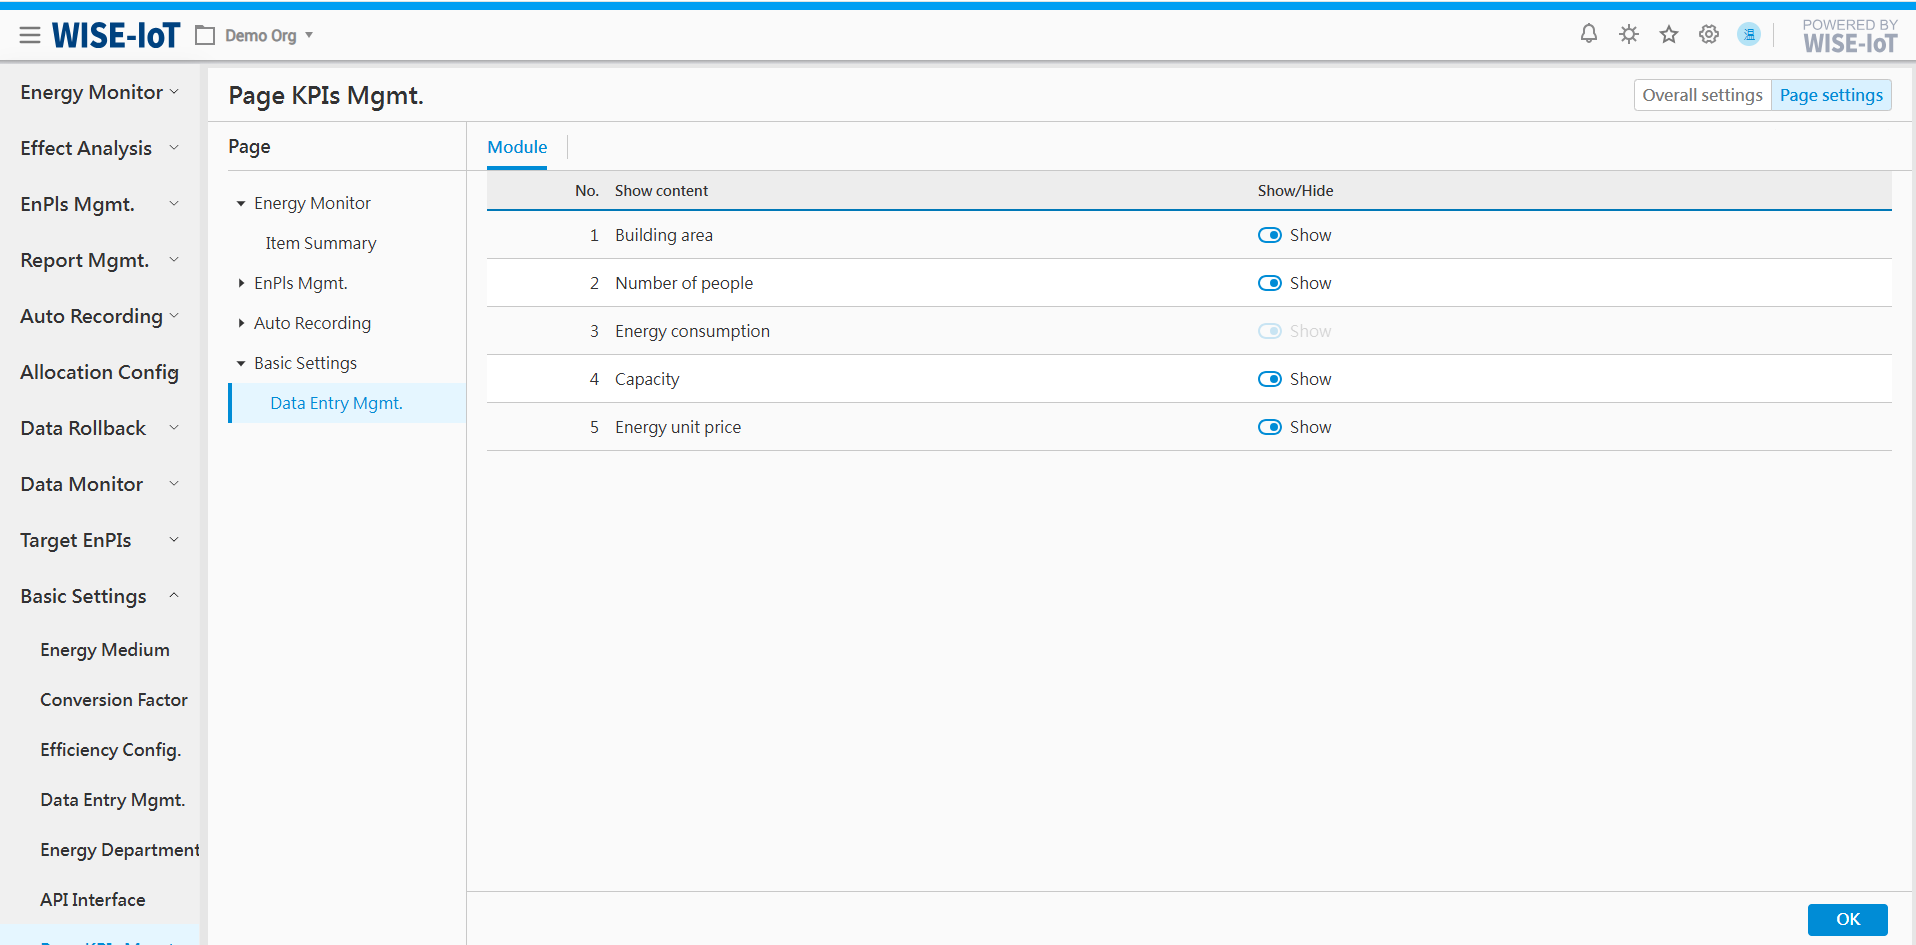
Unique Key Value Convention between ECOWatch and Third-Party Interfaces
When obtaining production value and output data through third-party interfaces, ECOWatch itself cannot directly identify the corresponding production objects or the regional nodes to which these data belong within the system. Therefore, it is necessary to rely on unique identifiers such as code to establish mapping relationships in order to accurately retrieve and associate the relevant production value/output data.
Below are the configuration methods for unique keys based on different data sources:
Mapping Configuration Method for Data from ECOWatch's API Interface Module
Here, you need to enter the mutually agreed-upon code in the Region_code field under InsightAPM Static Attributes, which will serve as the key for data retrieval.
1. After obtaining the data unit's code, navigate to APM Portal > Asset Group Management. Select and click a business asset group.
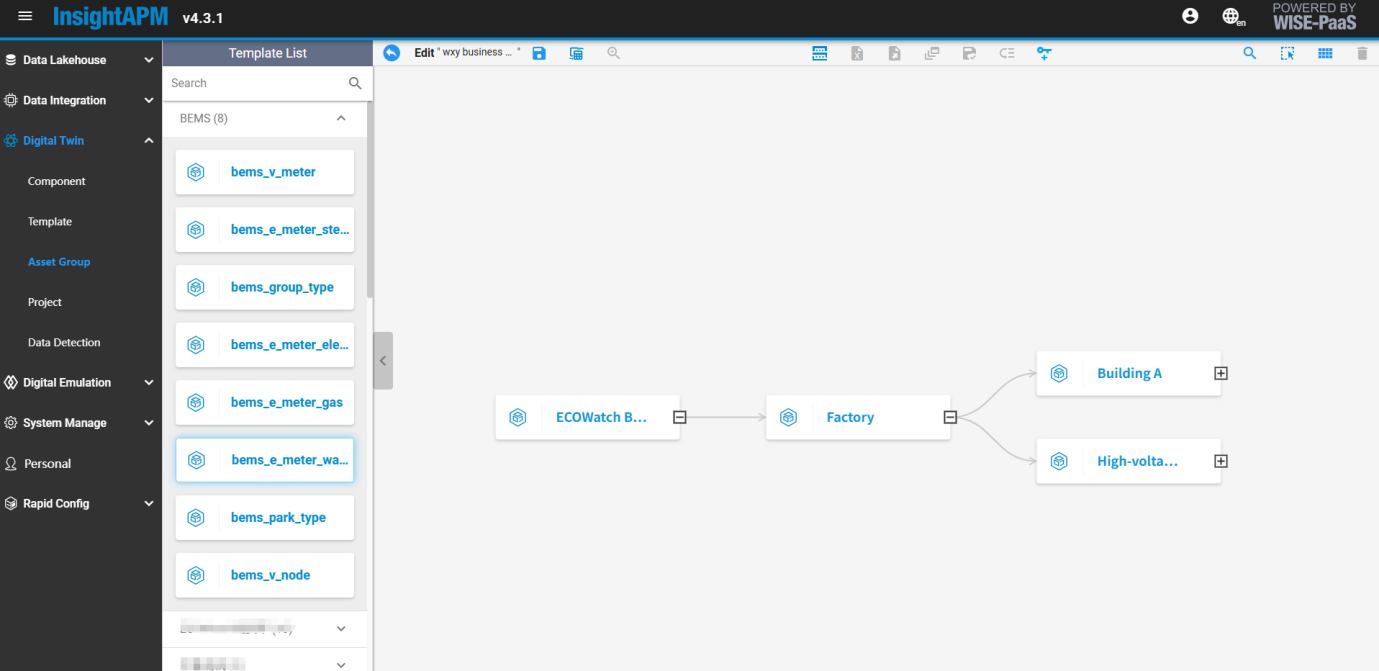
2. Select a node such as[Factory]), click[![]() ]above to access the Factory Component page.
]above to access the Factory Component page.
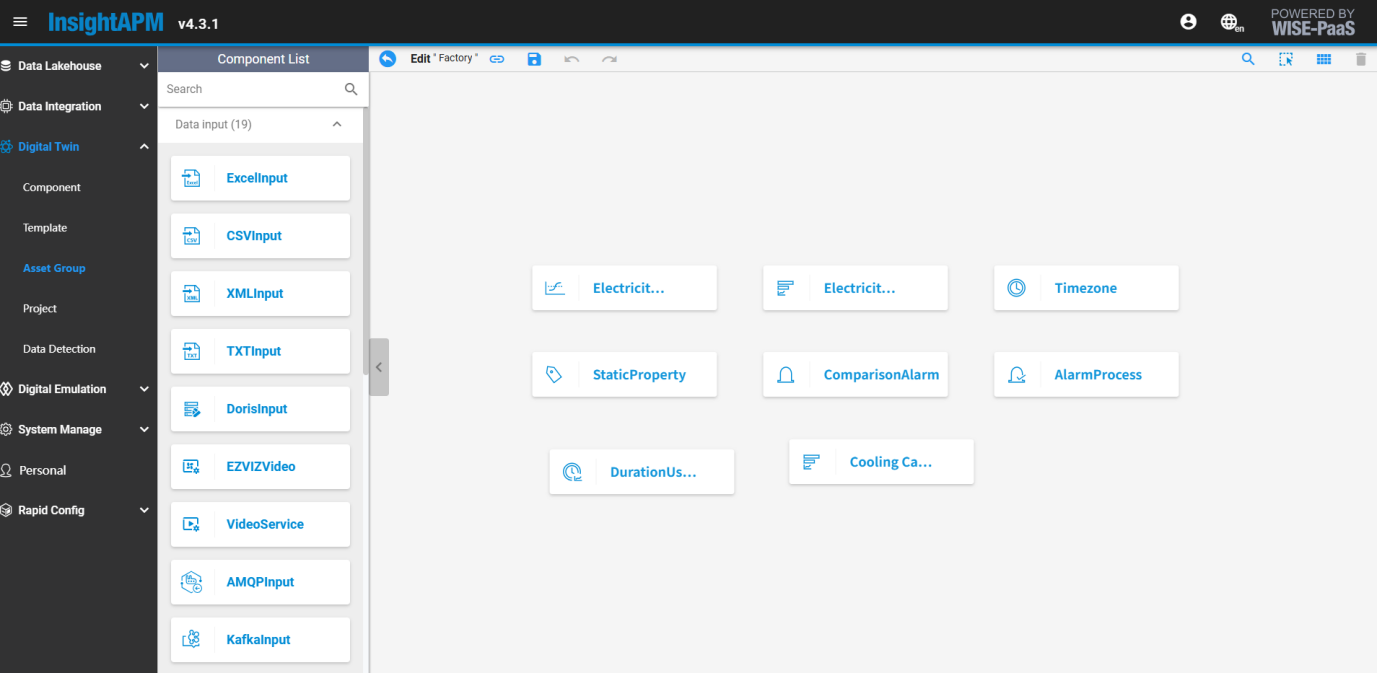
3. Double-click[StaticProperty]component, enter the unique key code of the third-party interface in the region_code field and click Save.
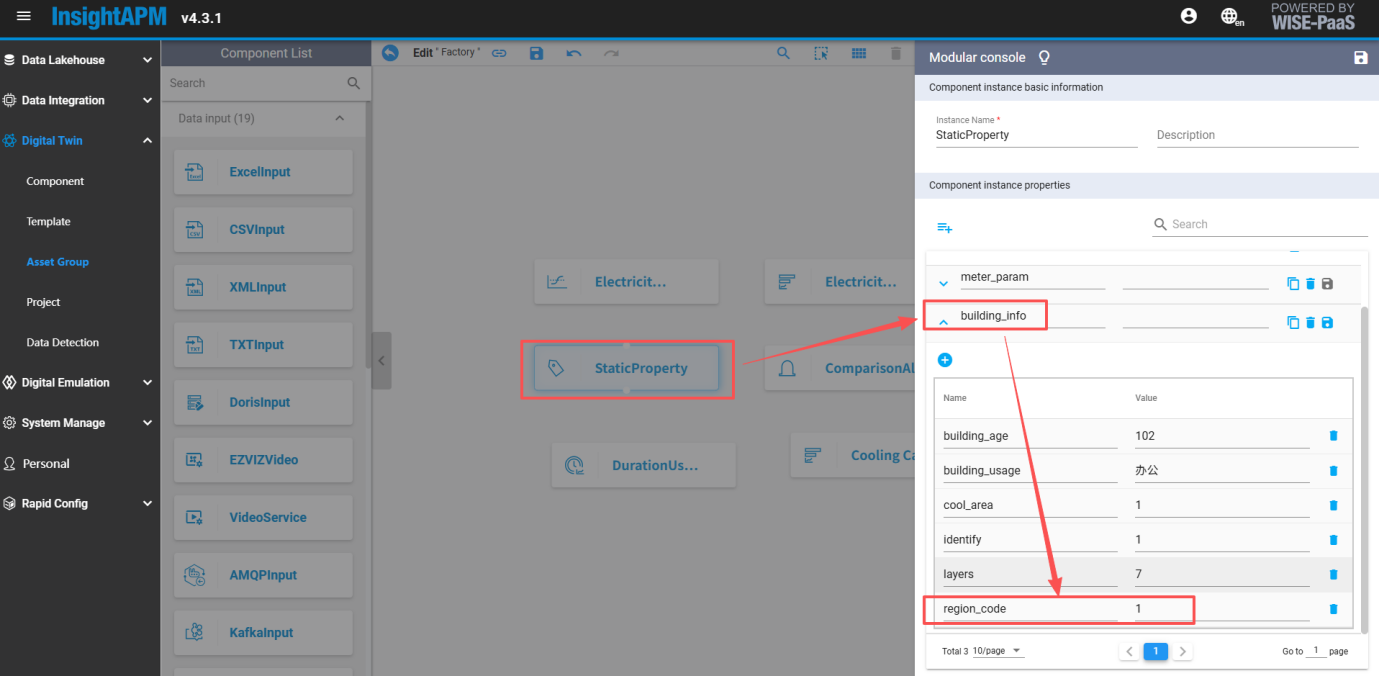
Notes:
-
If the current node lacks output value and output data, the region_code field should not be configured. However, if this field already exists in StaticProperty, the value on the right shall be left blank, and arbitrary values are prohibited.
-
If the current node needs output value/output but the "region_code" field is absent from StaticProperty, click "
 " to add the field and enter the correct code in it.
After completing the above configurations, users can view all data in the ECOWatch interface.
Mapping Configuration Method for Data from InsightAPM Doris
The configuration must be completed in the ECOWatch module: Basic Configuration >> Energy Department Management.
The energy department corresponds to the production object mentioned above. This module primarily handles the mapping between third-party production objects and ECOWatch regional nodes.
Navigate to Basic Settings >> Energy Department and select the "Yield" tab (the output value function is still under development).
You can add entries by clicking the "Add" button or import them via the "Import" button.
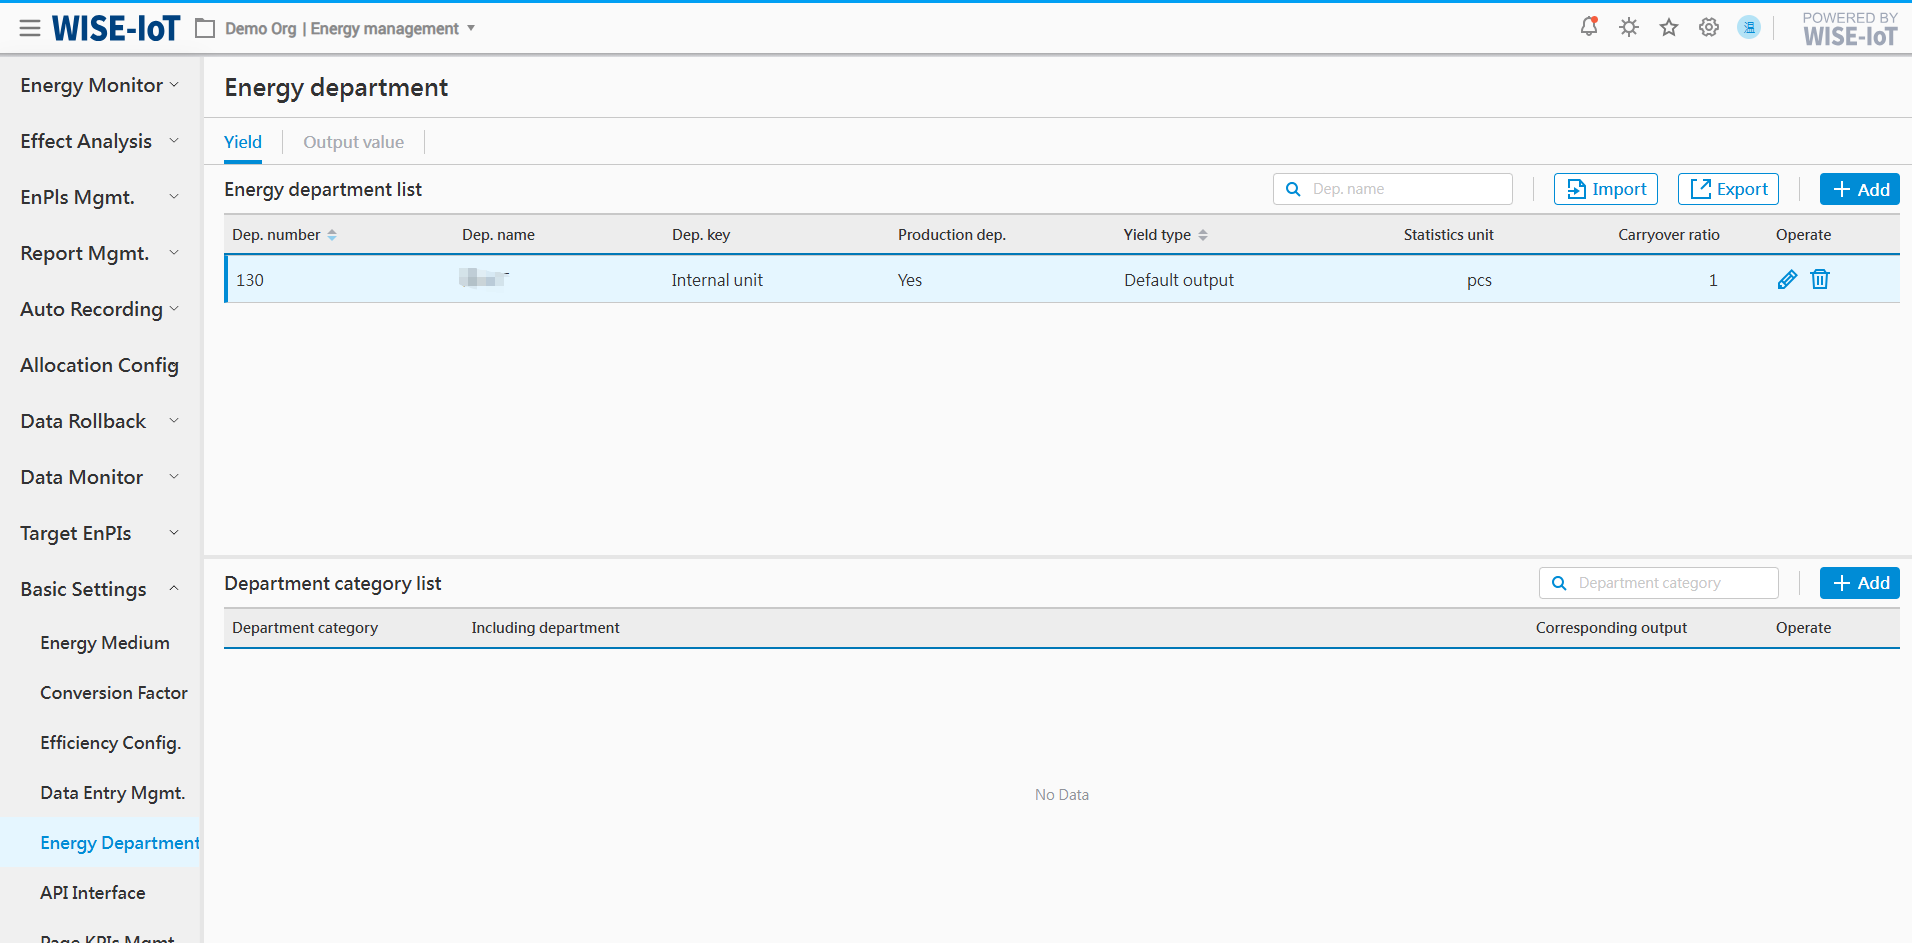
Import Energy Department (Production Objects)
Step 1: Click the [Template.xlsx] button to download the energy department import template.
Step 2: After filling in the template according to the format requirements, drag the file into the import area. The system will determine whether the import is successful based on the content. If the import fails, detailed error information will be provided for reference.
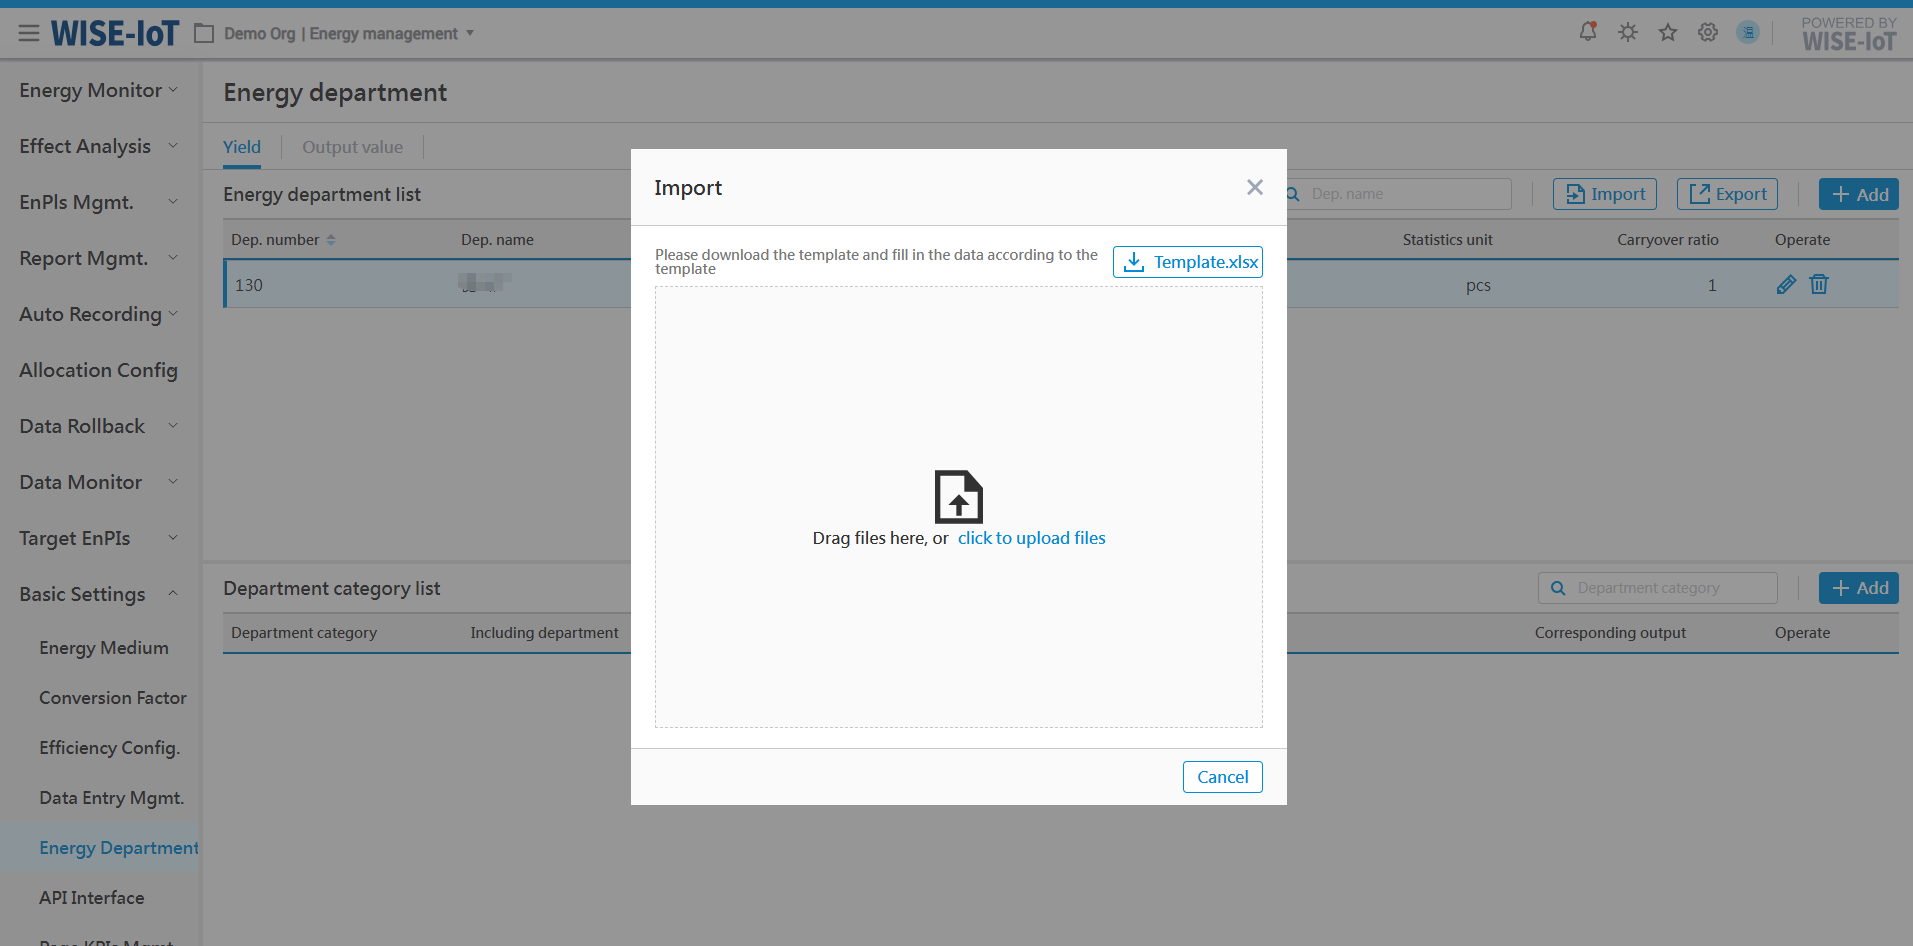
Energy Department Add
Click the "Add" button in the list to enter the energy department creation page, as shown in the figure below:
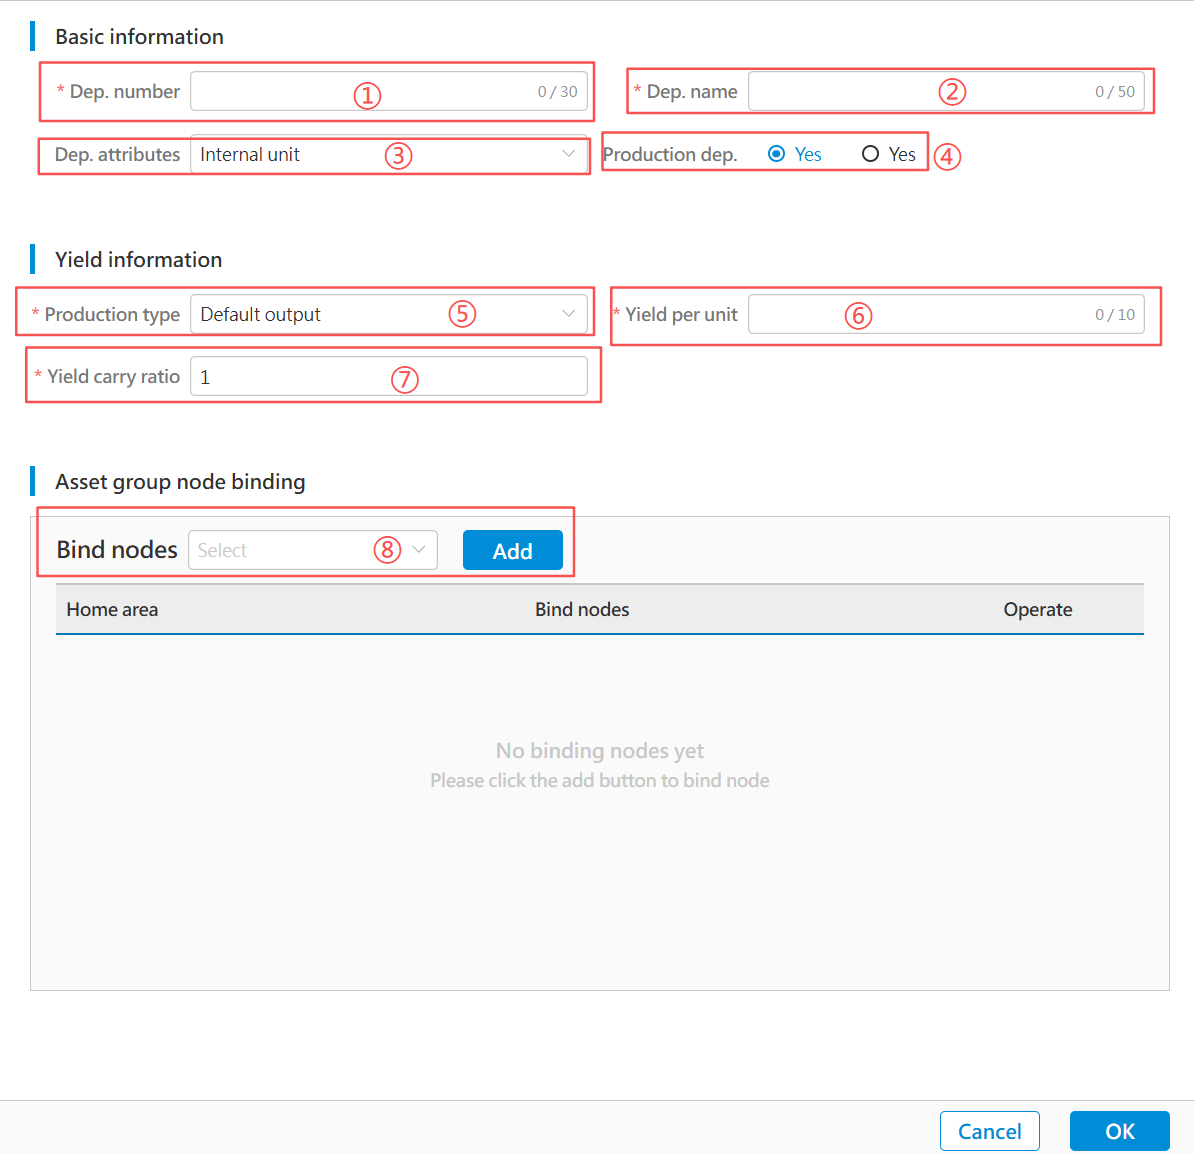
-
Department number: Enter according to the actual production object situation of the enterprise.
-
Department Name: Enter according to the actual production object situation of the enterprise.
-
Department Attribute: Default is "Internal Unit"; if not, select "External Unit".
-
Production Department: Enter based on the actual production object situation; default is "Yes".
-
Production Type: If the enterprise does not distinguish between production measurement by quantity or weight, select "Default Production".
-
Output Unit: Enter the actual unit used for production measurement.
-
Output carry ratio: Default is 1. If conversion is required between the actual unit in the third-party interface and the "Production Unit" in the system, enter the conversion ratio here.
-
Bound Nodes: Select the regional node(s) in the ECOWatch topology (multiple selections allowed).
For example, if the production object is a process "A" corresponding to node "A1" in ECOWatch, but during production calculation, the output of A1 also belongs to production line "L1" and factory "Factory", then bind nodes "A1", "L1", and "Factory" simultaneously here.
After completing the above information, click the "Confirm" button to save.
Once saved successfully, the system will automatically calculate production information based on the configured binding relationships.
Department Category List
The department category function is currently only used for auxiliary reporting tools and is not yet displayed in the ECOWatch interface. This section will not be explained in detail.
Public module
ECOWatch Dark Mode Switching
After entering ECOWatch, click "![]() " on the top of the interface, then select the skin to be displayed:
" on the top of the interface, then select the skin to be displayed:

The system automatically adjusts display colors based on the selected skin:
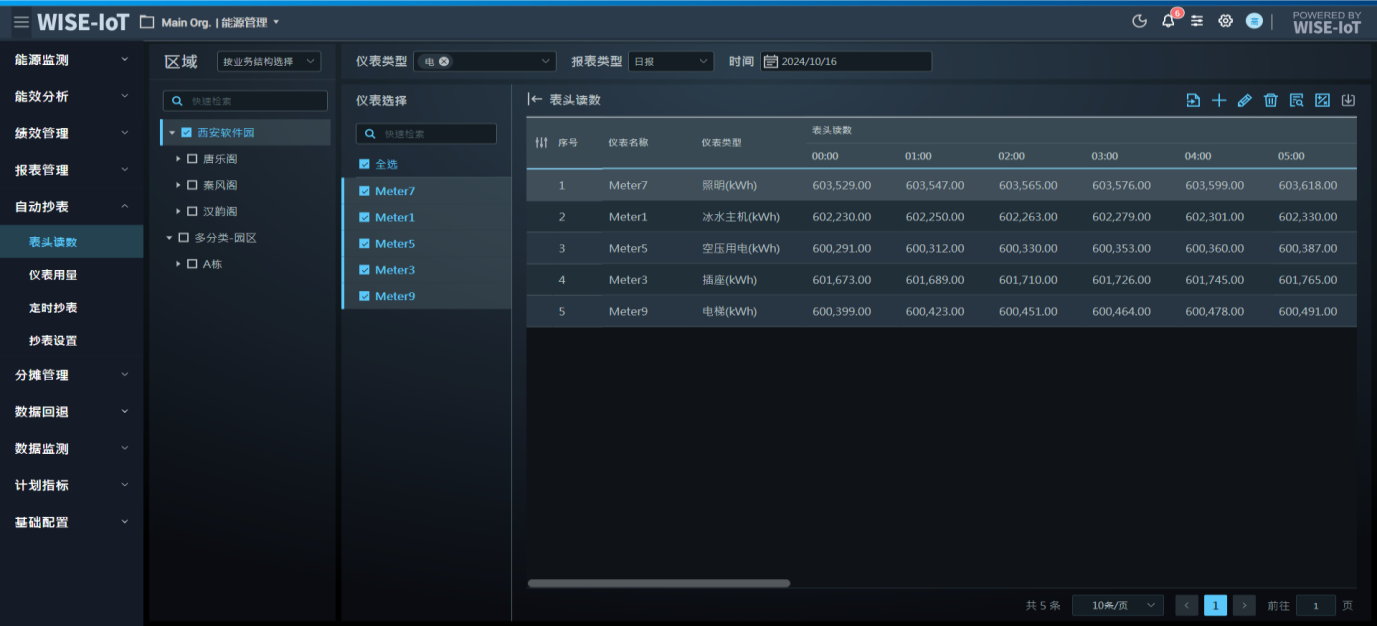
Desk-Related Functions
Log Out
To log out of the system, users can click "Account Icon" in the upper-right corner of the page and select "Log Out", and the system will automatically redirect to the Desk's login page.
Personalization Settings & Permission Management Settings
The above describes ECOWatch's user-related functional modules. Beyond ECOWatch functionality, information such as logged-in users and permission management also relies on relevant Desk configurations.
Click "![]() " in the upper-right corner to enter the Desk System Settings page.
" in the upper-right corner to enter the Desk System Settings page.
For details about the Desk system settings function, please refer to the Desk Operation Manual.
APM Data Warehouse Interface and Node Component Configuration
Configuration related to production data lakehouse tables and interface input components
If you need to interface with the customer's MES system to obtain production information, please follow the steps below sequentially.
Confirm the output interface parameters of the energy department
| No. | Field Name | Data Type | Description | Sample Data & Notes | Remarks |
|---|---|---|---|---|---|
| 1 | branchCode | String | Organization code | Advantech | 這些欄位應根據實際情況填寫,但不能留空 |
| 2 | branchName | String | Organization Name | Advantech | 同上 |
| 3 | factoryCode | String | Factory Number | 72001 | 同上 |
| 4 | factoryName | String | Factory Name | AKMC | 同上 |
| 5 | shopCode | String | Shop Code | CKWR5 | 同上 |
| 6 | shopName | String | Workshop Name | Board factory | 同上 |
| 7 | lineCode | String | Production line number | 73000000 | 同上 |
| 8 | lineName | String | Production Line Name | SMT L | 同上 |
| 9 | processCode | String | Process Number | 930002 | 同上 |
| 10 | processName | String | Process Name | Dust Removal | 同上 |
| 11 | shiftCode | String | Service number | C0 | 同上 |
| 12 | shiftName | String | Shift Name | Day Shift | 同上 |
| 13 | groupCode | String | Team Number | A0 | 同上 |
| 14 | groupName | String | Team Name | A | 同上 |
| 15 | orderNumber | String | Batch number | 720073010000202206020001 | 同上 |
| 16 | productCode | String | Product Number | TP150D | 同上 |
| 17 | productName | String | Product Name | 24CxMo48VMb | 若需查看批次能耗資訊,此欄位為必填 |
| 18 | specification | String | Specifications | 168.28*19.05 | - |
| 19 | output | Number | Output | 1500 | 必填 ⚠️ |
| 20 | outputUnit | String | Production unit | - | - |
| 21 | weight | Number | Product weight | 150000 | - |
| 22 | weightUnit | String | Product weight unit | - | - |
| 23 | productAmount | Number | Output (measure) | 1500 | - |
| 24 | productUnit | String | Output measurement unit | - | - |
| 25 | productTypeName | String | Product type | Finished Products / Semi-Finished Products | - |
| 26 | outputTime | Timestamp | Production date | 2025/2/26 | 必填 ⚠️ |
| 27 | createTime | Timestamp | Creation Time | 2025/2/26 13:22:38 | - |
| 28 | updateTime | Timestamp | Update Time | 2025/2/26 13:22:38 | - |
| 29 | departmentCode | String | Energy Department Number | 127 | - |
| 30 | departmentName | String | Energy sector name | Board factory | - |
Build output data lakehouse table in APM
-
Enter the data warehouse modeling of the Data Lakehouse, click the '+' icon to pop up the configuration table screen.
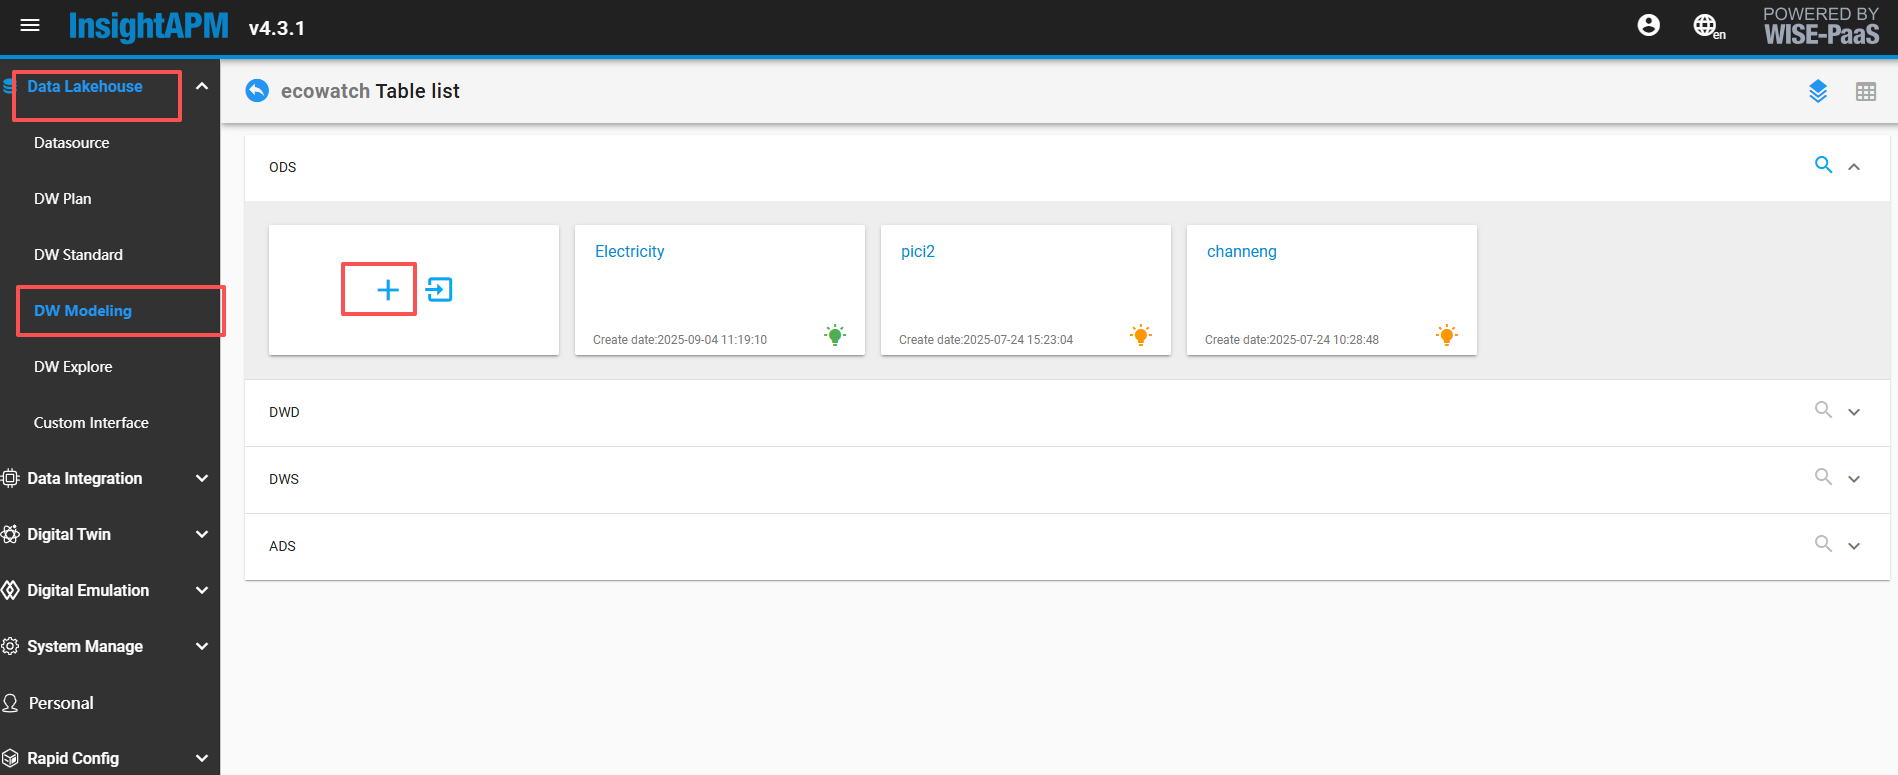
-
Refer to the image below for filling in basic information.
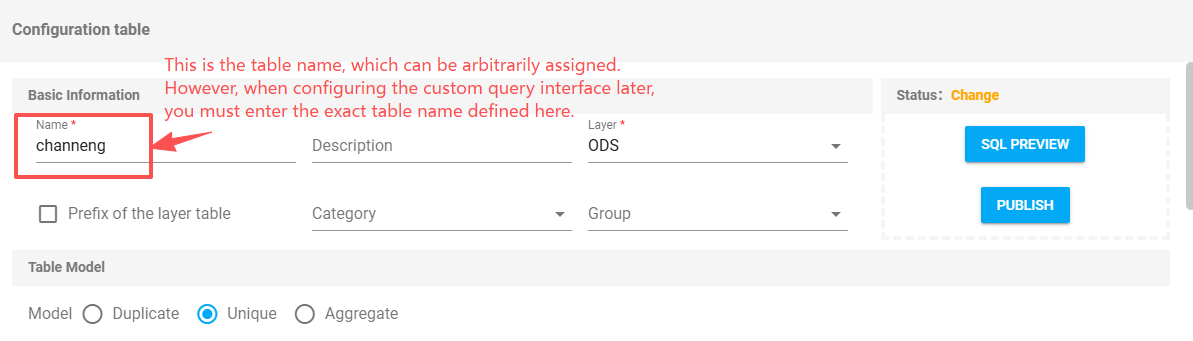
-
Refer to the figure below for table model creation.(Note: If shift output is used, the mode Key configuration needs to be modified.)
Attachment content can be imported into data warehouse modeling, ODS model.
-
After filling it out and clicking 'Save Data', this data warehouse table will be successfully created.
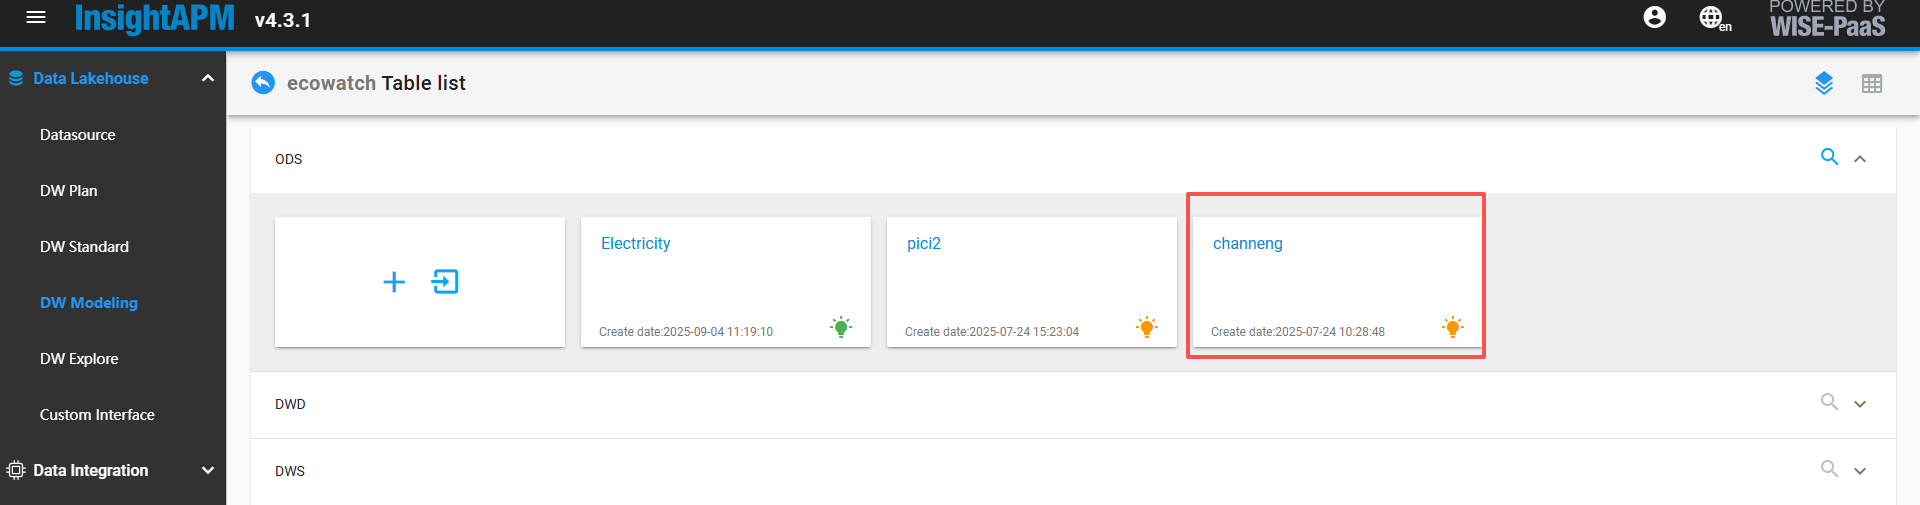
Configure the capacity interface input component to retrieve data from the third-party production output interface.
In APM asset group management, select an asset group root node, and after entering, drag an [Interface Input] component from the component list on the left. Double-click the [Interface Input] component to enter.
-
Please refer to the image below for filling in basic information.
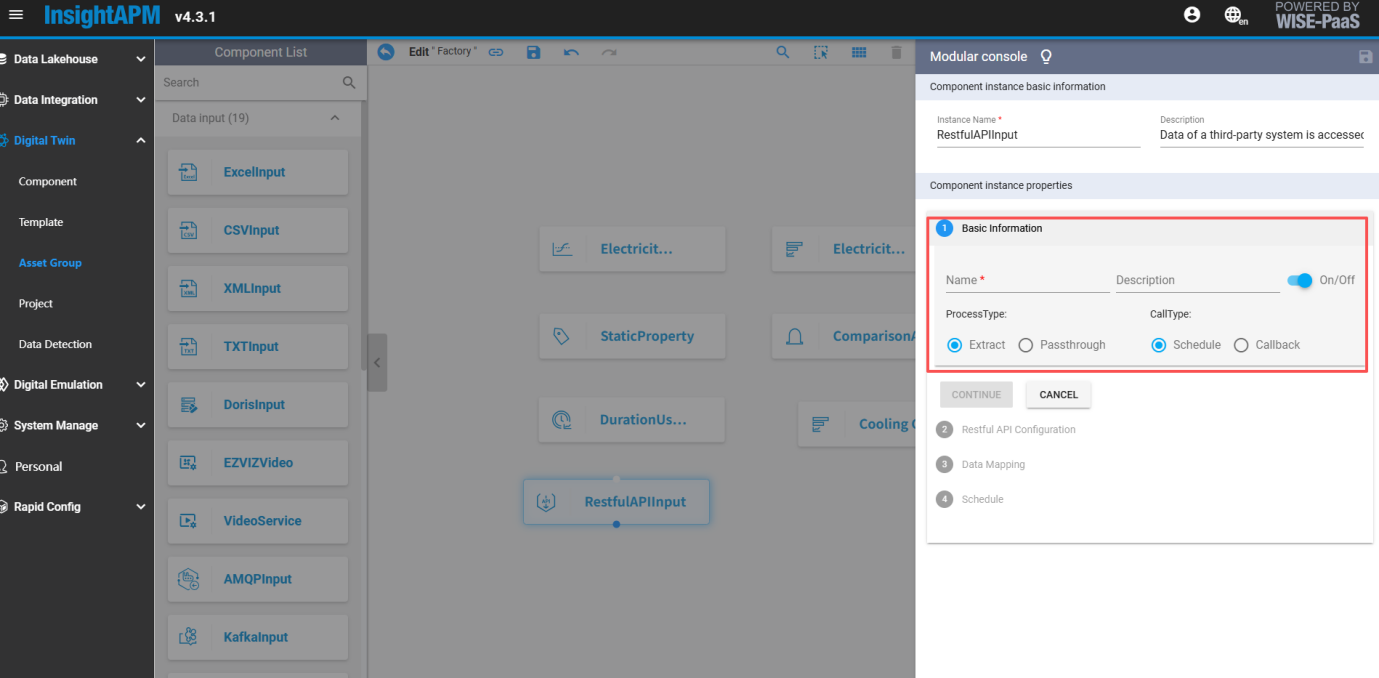
-
Callback interface pre-filled by default, click Next
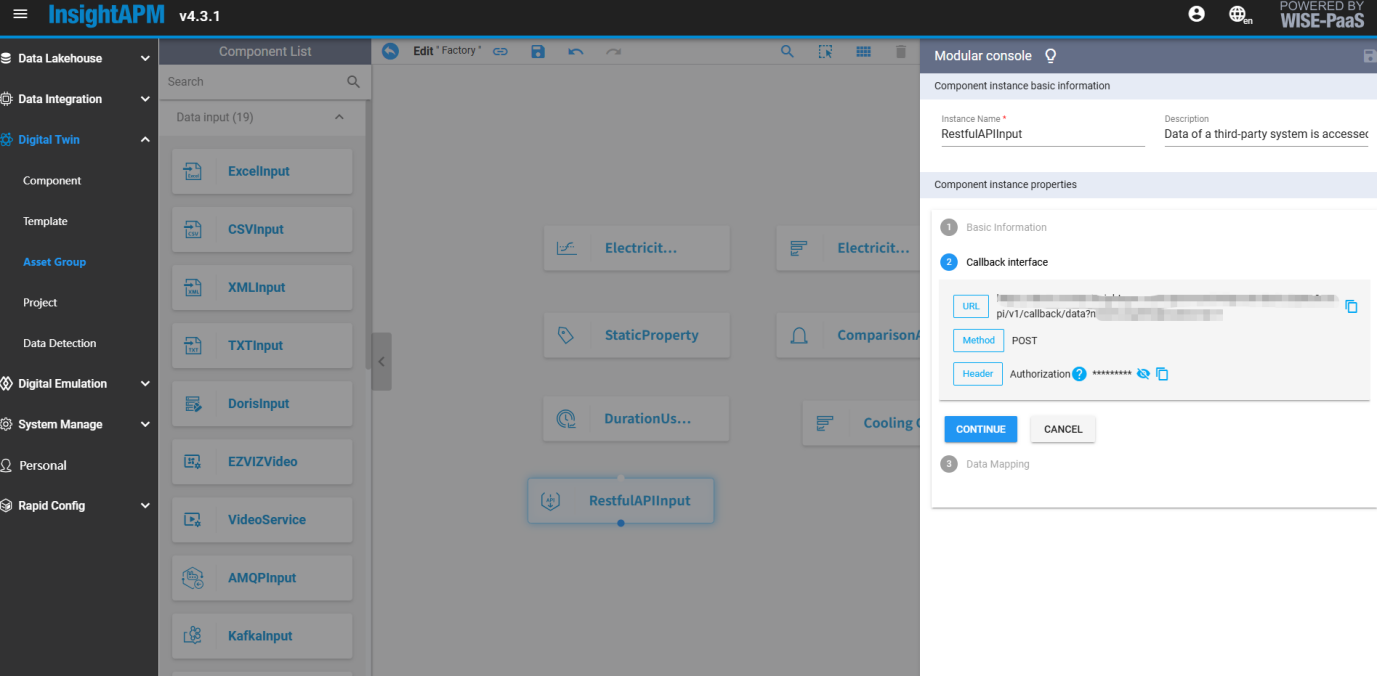
-
Data mapping
-
JSON source data: Fields are consistent with data warehouse table fields.
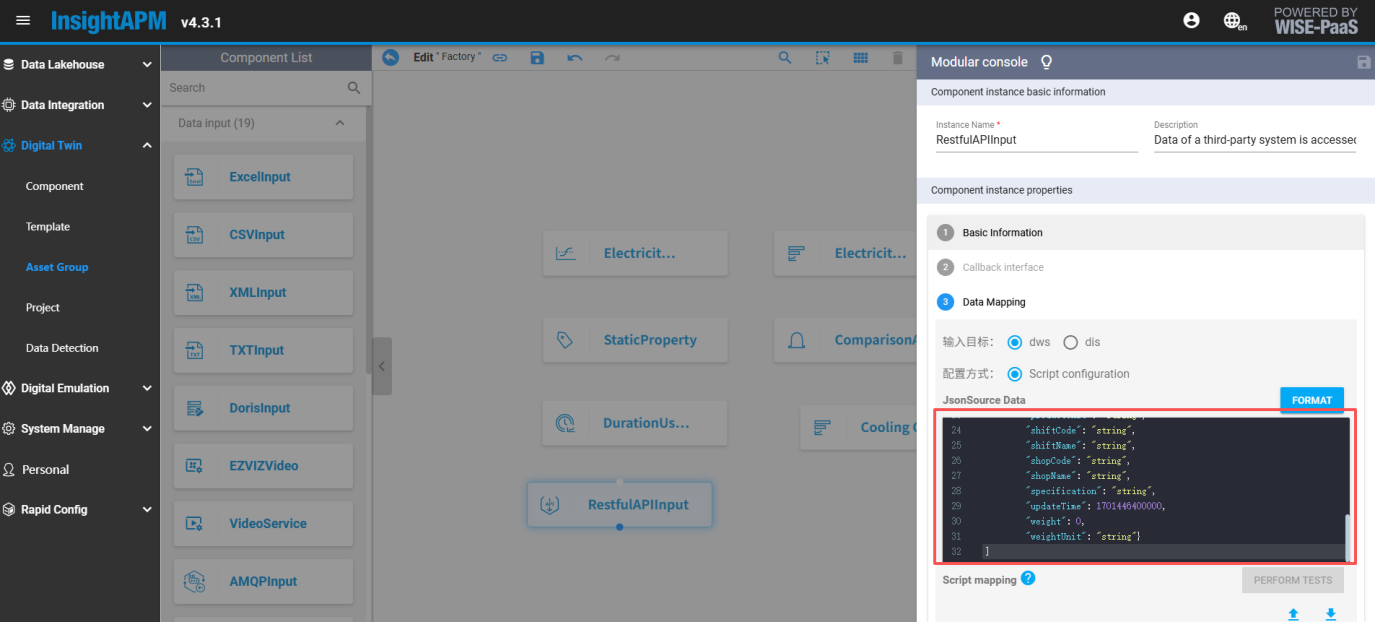
[
  {
    "branchCode": "string",
    "branchName": "string",
    "createTime": 0,
    "departmentCode": "string",
    "departmentName": "string",
    "factoryCode": "string",
    "factoryName": "string",
    "groupCode": "string",
    "groupName": "string",
    "lineCode": "string",
    "lineName": "string",
    "orderNumber": "string",
    "output": 0,
    "outputTime": 1701446400000,
    "outputUnit": "string",
    "processCode": "string",
    "processName": "string",
    "productAmount": 0,
    "productCode": "string",
    "productName": "string",
    "productTypeName": "string",
    "productUnit": "string",
    "shiftCode": "string",
    "shiftName": "string",
    "shopCode": "string",
    "shopName": "string",
    "specification": "string",
    "updateTime": 1701446400000,
    "weight": 0,
    "weightUnit": "string"
  }
]
- Script mapping: Fields and data warehouse table fields remain consistent
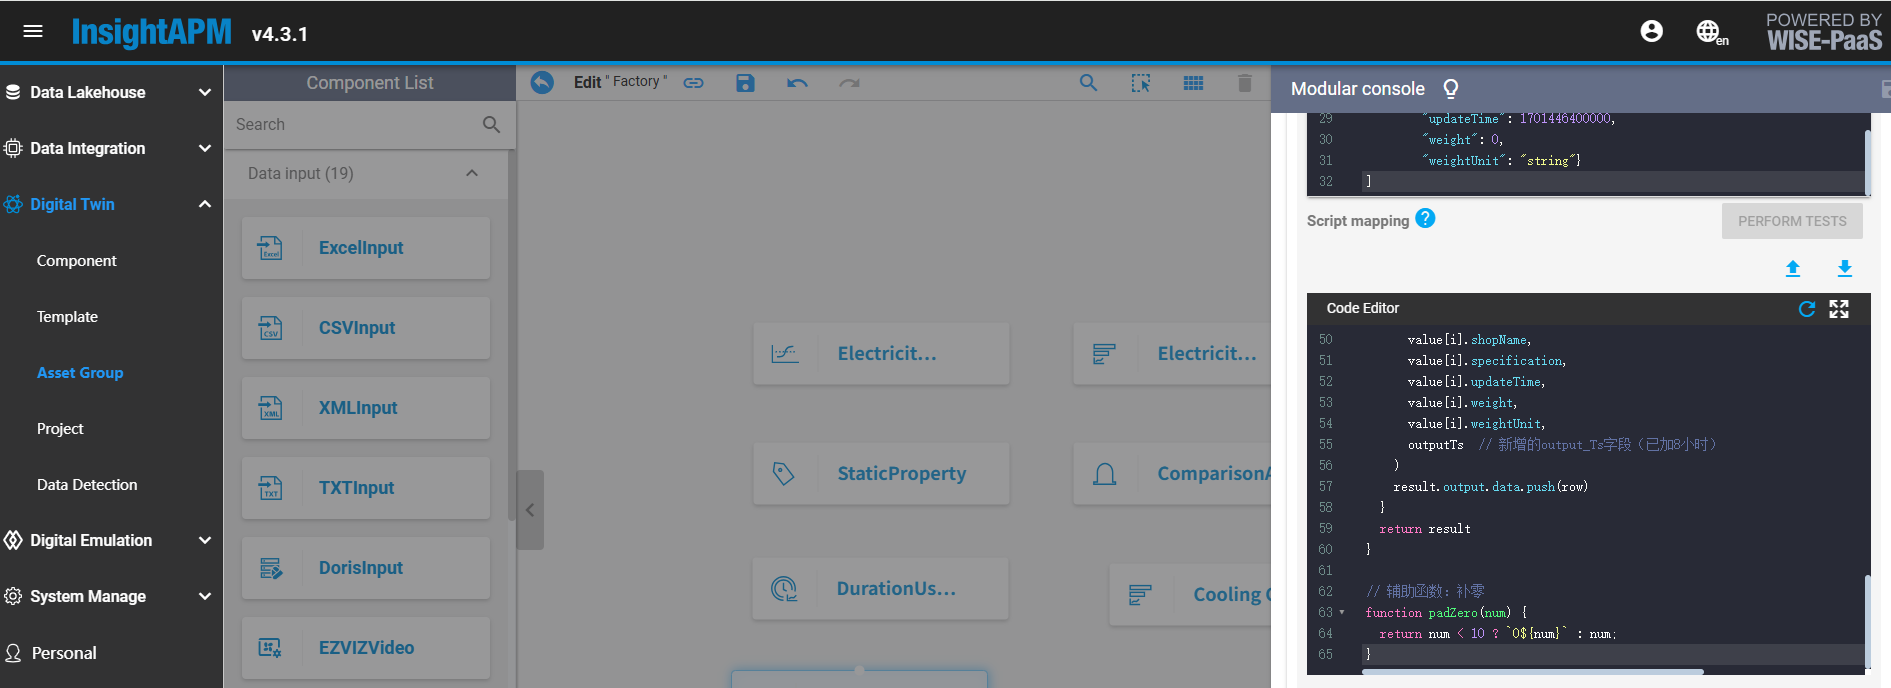
function run(value, context) {
  let result = {
    "output": {
      "meta": [
        "branchCode", "branchName", "createTime", "departmentCode", "departmentName",
        "factoryCode", "factoryName", "groupCode", "groupName", "lineCode",
        "lineName", "orderNumber", "output", "outputTime", "outputUnit",
        "processCode", "processName", "productAmount", "productCode", "productName",
        "productTypeName", "productUnit", "shiftCode", "shiftName", "shopCode",
        "shopName", "specification", "updateTime", "weight", "weightUnit", "output_Ts"
      ],
      "data": []
    }
  }

  for (let i = 0; i < value.length; i++) {
    // Convert timestamp to date string (add 8 hours)
    const outputTime = value[i].outputTime;
    const date = new Date(outputTime + 8 * 60 * 60 * 1000); // Add 8 hours
    const outputTs = `${date.getFullYear()}-${padZero(date.getMonth() + 1)}-${padZero(date.getDate())} ` +
      `${padZero(date.getHours())}:${padZero(date.getMinutes())}:${padZero(date.getSeconds())}`;

    let row = []
    row.push(
      value[i].branchCode,
      value[i].branchName,
      value[i].createTime,
      value[i].departmentCode,
      value[i].departmentName,
      value[i].factoryCode,
      value[i].factoryName,
      value[i].groupCode,
      value[i].groupName,
      value[i].lineCode,
      value[i].lineName,
      value[i].orderNumber,
      value[i].output,
      value[i].outputTime,
      value[i].outputUnit,
      value[i].processCode,
      value[i].processName,
      value[i].productAmount,
      value[i].productCode,
      value[i].productName,
      value[i].productTypeName,
      value[i].productUnit,
      value[i].shiftCode,
      value[i].shiftName,
      value[i].shopCode,
      value[i].shopName,
      value[i].specification,
      value[i].updateTime,
      value[i].weight,
      value[i].weightUnit,
      outputTs // Newly added output_Ts field (8 hours added)
    )
    result.output.data.push(row)
  }
  return result
}

// Helper function: pad with zeros
function padZero(num) {
  return num < 10 ? `0${num}` : num;
}
- Table Mapping: Select table name from data warehouse tables
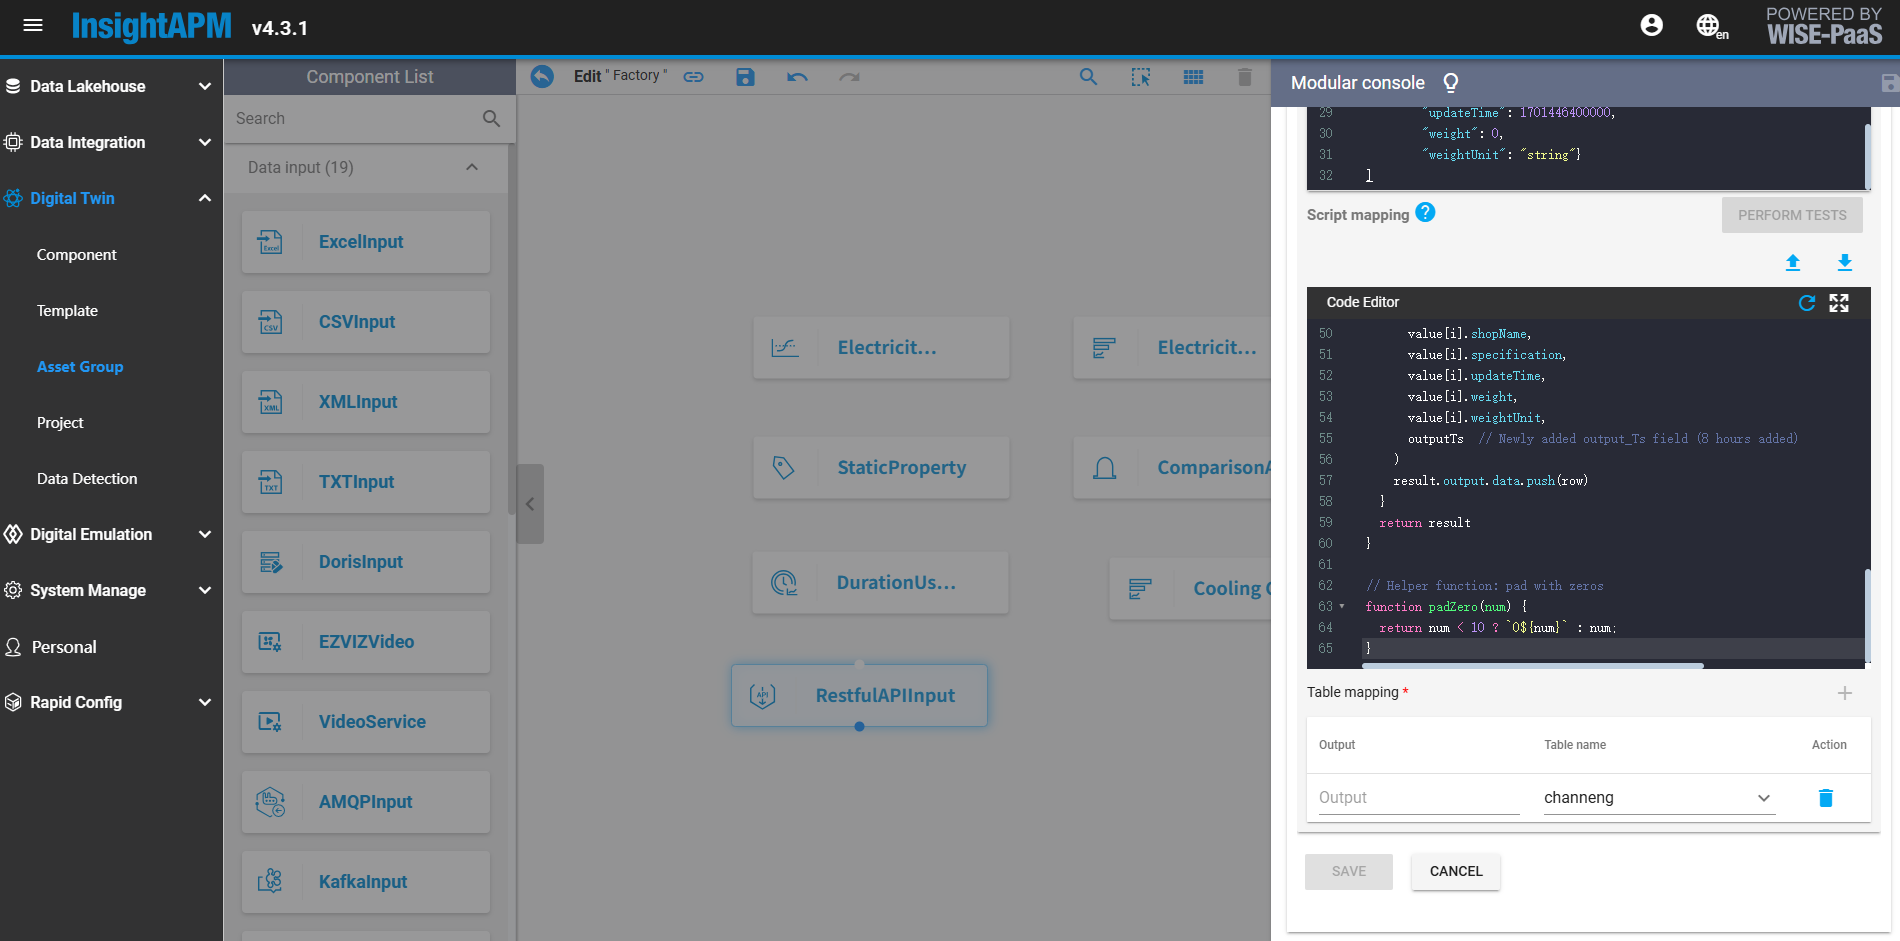
- Once the above steps have been configured, SE needs to provide the following information to the customer and have the customer input production data based on this information.
API 介接資訊說明
1. Access Address & Authorization
參考介面截圖:
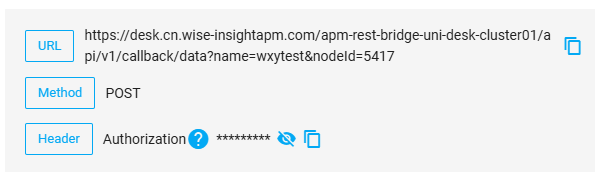
2. Token
在 Postman 中查找 Token 資訊:
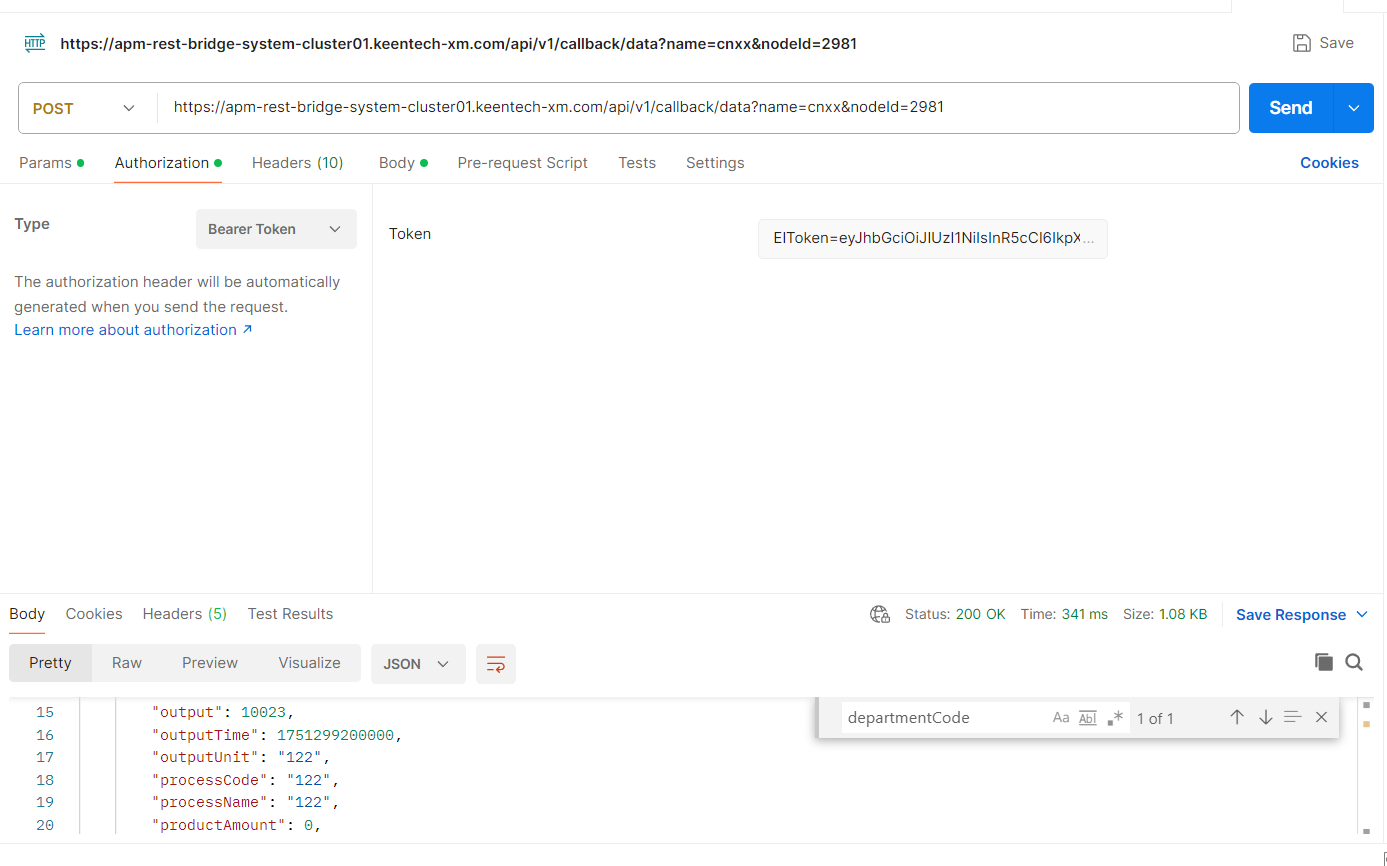
3. HEADERS
在 Postman 中查找 HEADERS 資訊:
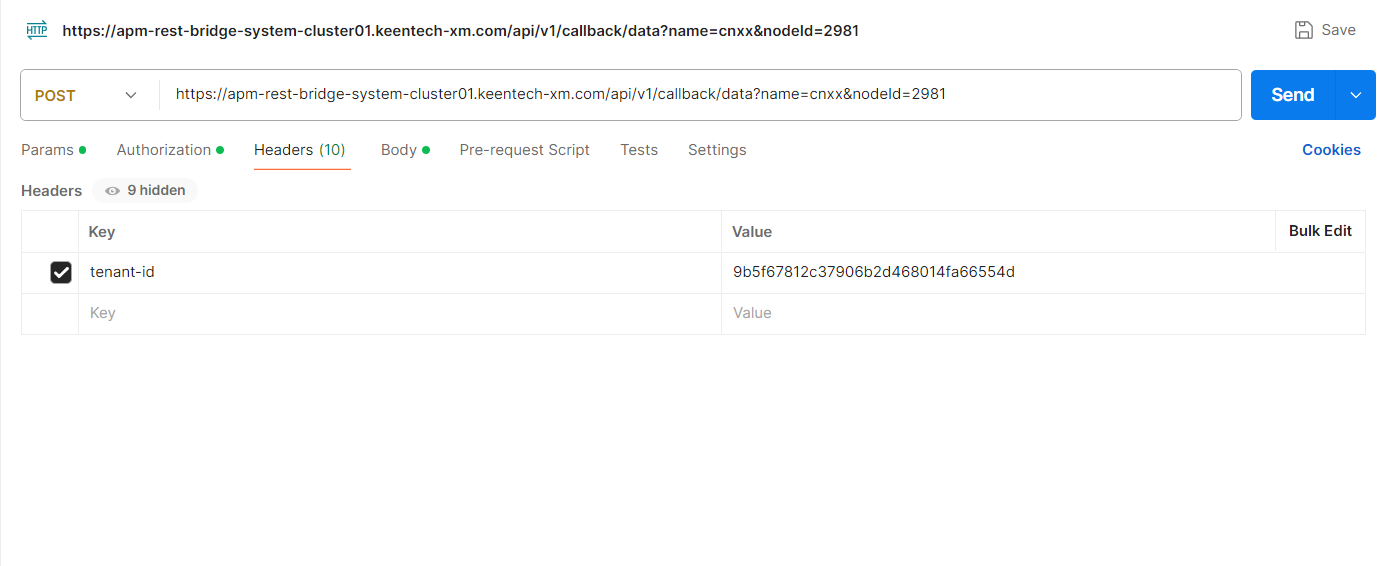
4. BODY
說明
所有輸入參數都必須提供。這些參數由使用者特定場景的實際參數欄位決定,並且必須與步驟 1 中的欄位一致。
範例格式
[
  {
    "branchCode": "122",
    "branchName": "122",
    "createTime": 0,
    "departmentCode": "683",
    "departmentName": "Safety Factory One",
    "factoryCode": "122",
    "factoryName": "122",
    "groupCode": "122",
    "groupName": "122",
    "lineCode": "122",
    "lineName": "122",
    "orderNumber": "122",
    "output": 10023,
    "outputTime": 1751299200000,
    "outputUnit": "122",
    "processCode": "122",
    "processName": "122",
    "productAmount": 0,
    "productCode": "122",
    "productName": "122",
    "productTypeName": "122",
    "productUnit": "122",
    "shiftCode": "122",
    "shiftName": "122",
    "shopCode": "122",
    "shopName": "122",
    "specification": "122",
    "updateTime": 1751299200000,
    "weight": 0,
    "weightUnit": "string"
  }
]
FormulateProduction query interface
Create interface "ecowatch" group
Click APM Data Lakehouse >> Custom Interface, click the "+" button to enter. For Name, fill in ecowatch. For path, fill in /ecowatch. For Basic Auth, click the refresh button to automatically generate the token. Click Save (If the interface group has been established, skip this step):
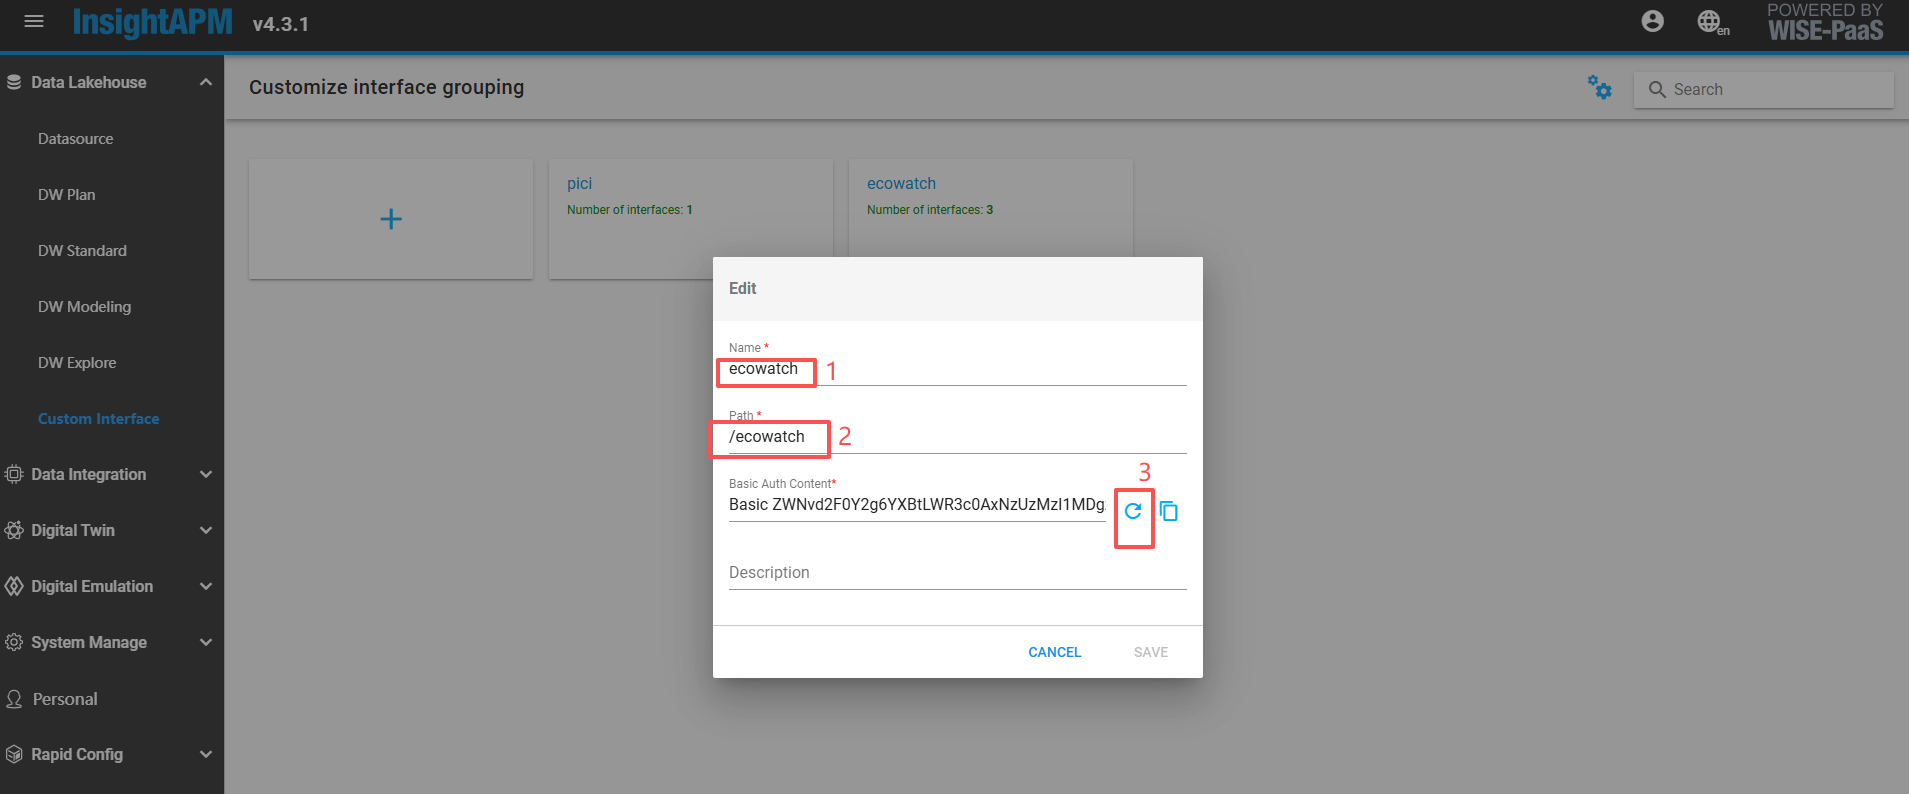
Create production output query interface (non-batch)
Click "ecowatch" created in the previous step to enter, go to the custom interface list screen, and click the Add button to configure the custom interface:
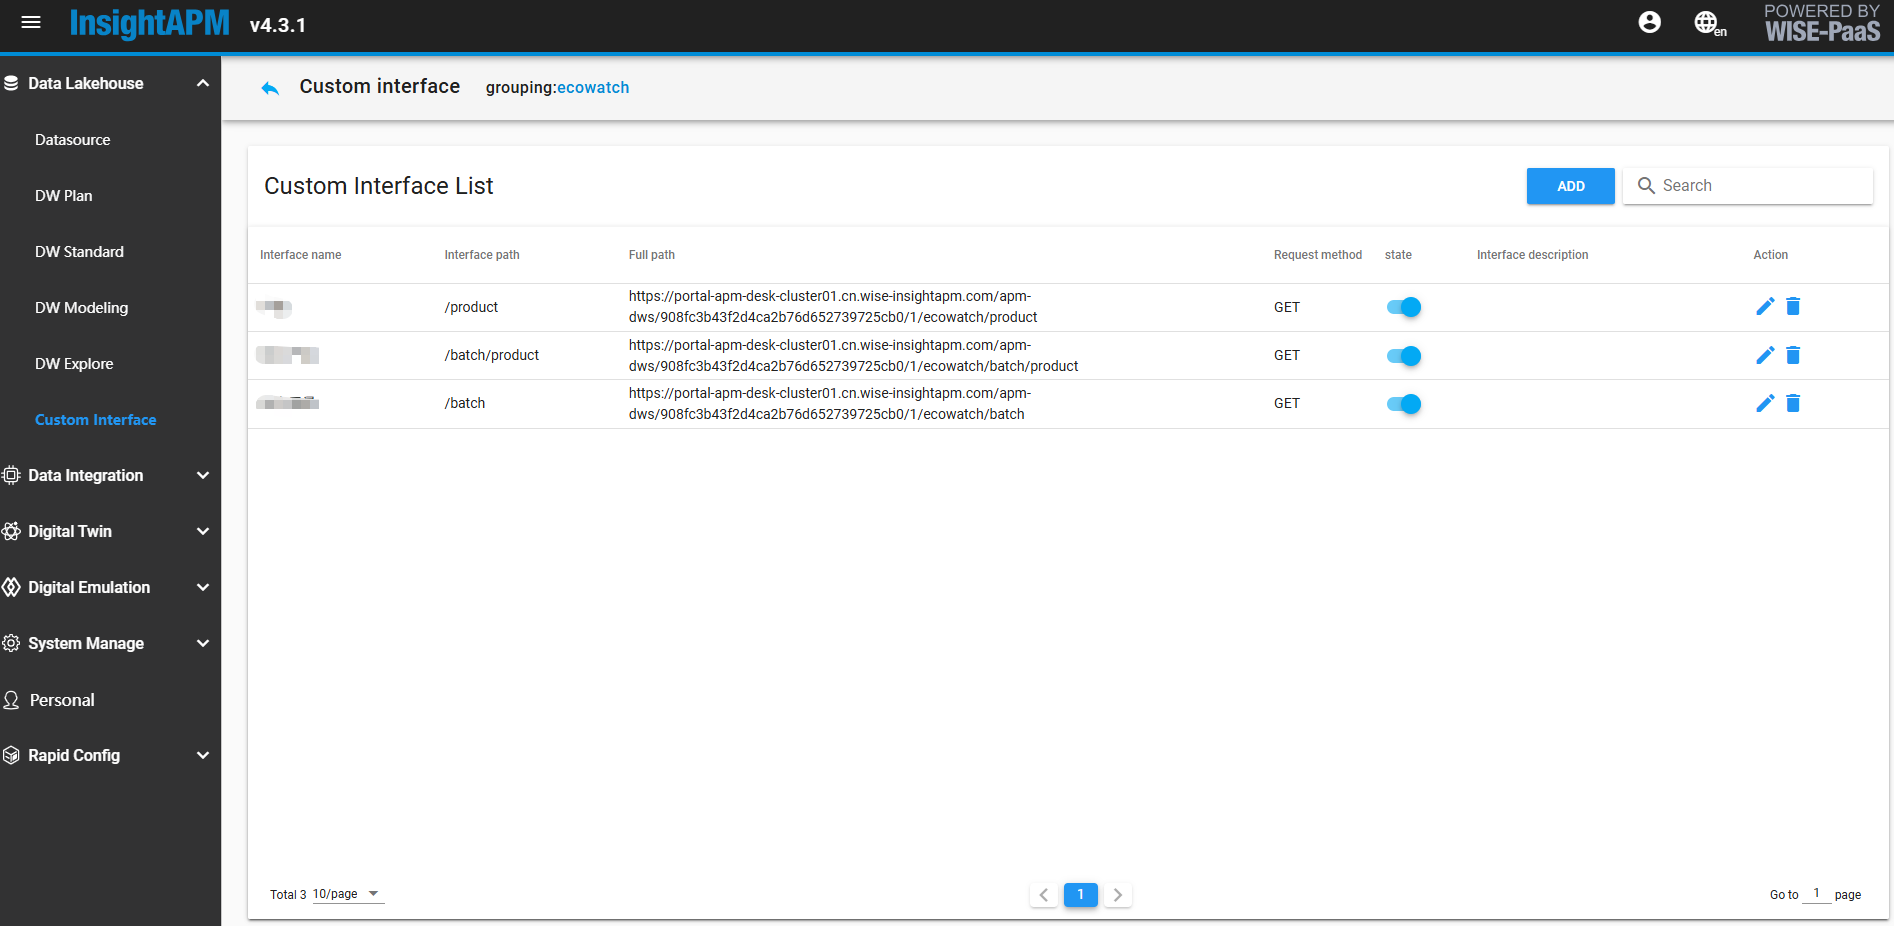
- Enter interface nameProduction capacity, select GET request, fixedly fill in /product as the request path for the data interface,Select authentication method BearerToken request path of the interface, select authentication method BearerToken
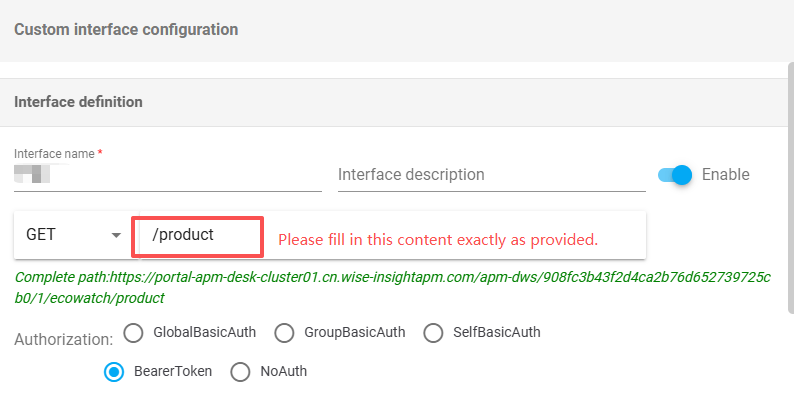
- PARAM configuration reference example diagram, If there are multiple values for department_codes, please fill them in, separated by commas. eg: Energy Department Code 1, Energy Department Code 2
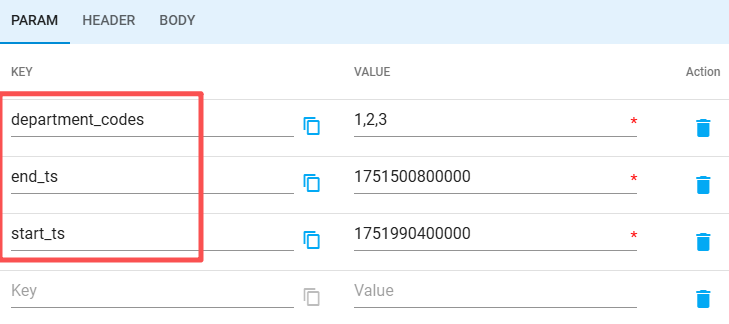
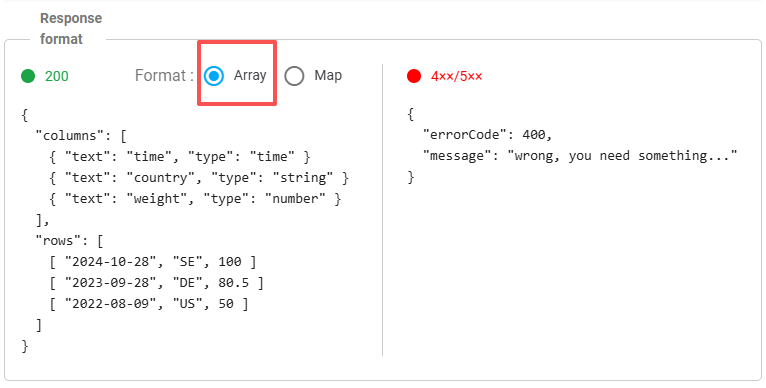
-
Query configuration interface data source selection default data source, fill in sql, SELECT * FROM channeng WHERE find_in_set(departmentCode, ?) AND outputTime >= ? AND outputTime < ?
Fill in the parameter list according to the schematic diagram:
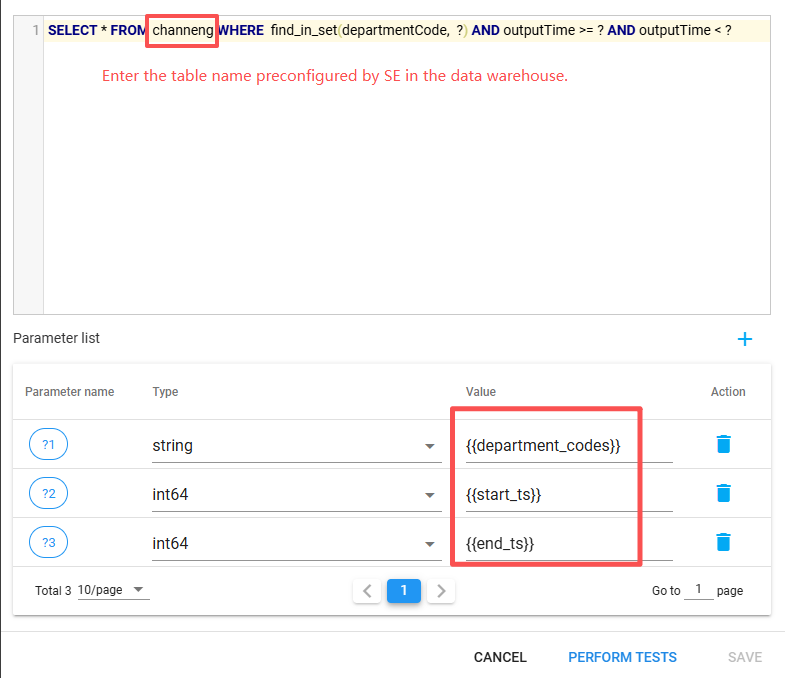
- Execute the test. After it succeeds, click Save, and you will see this API information generated on the custom API list interface.。
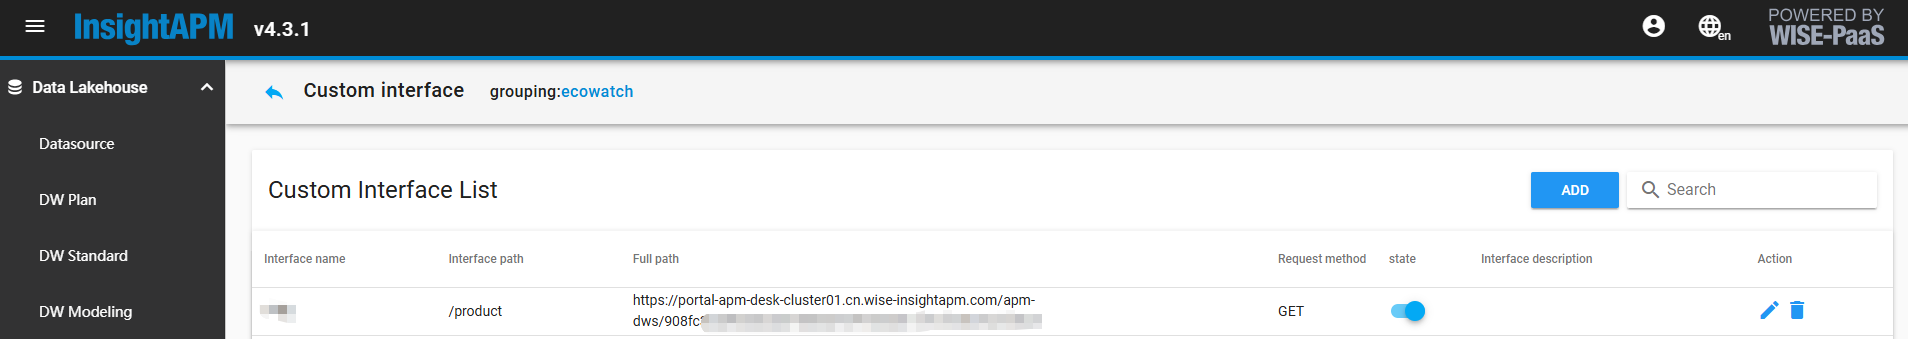
- Calling this interface to get data is consistent with calling a RESTful style interface method, the full path is the URL of this interface, GET is the type of request method, the request parameters are the PARAM in the third step.
Energy Department Configuration (ECOWatch Node and MES Production Binding)
After the production interface is configured, go to ECOWatch Basic Settings >> Energy Department Management, click to enter, as shown in the figure below:
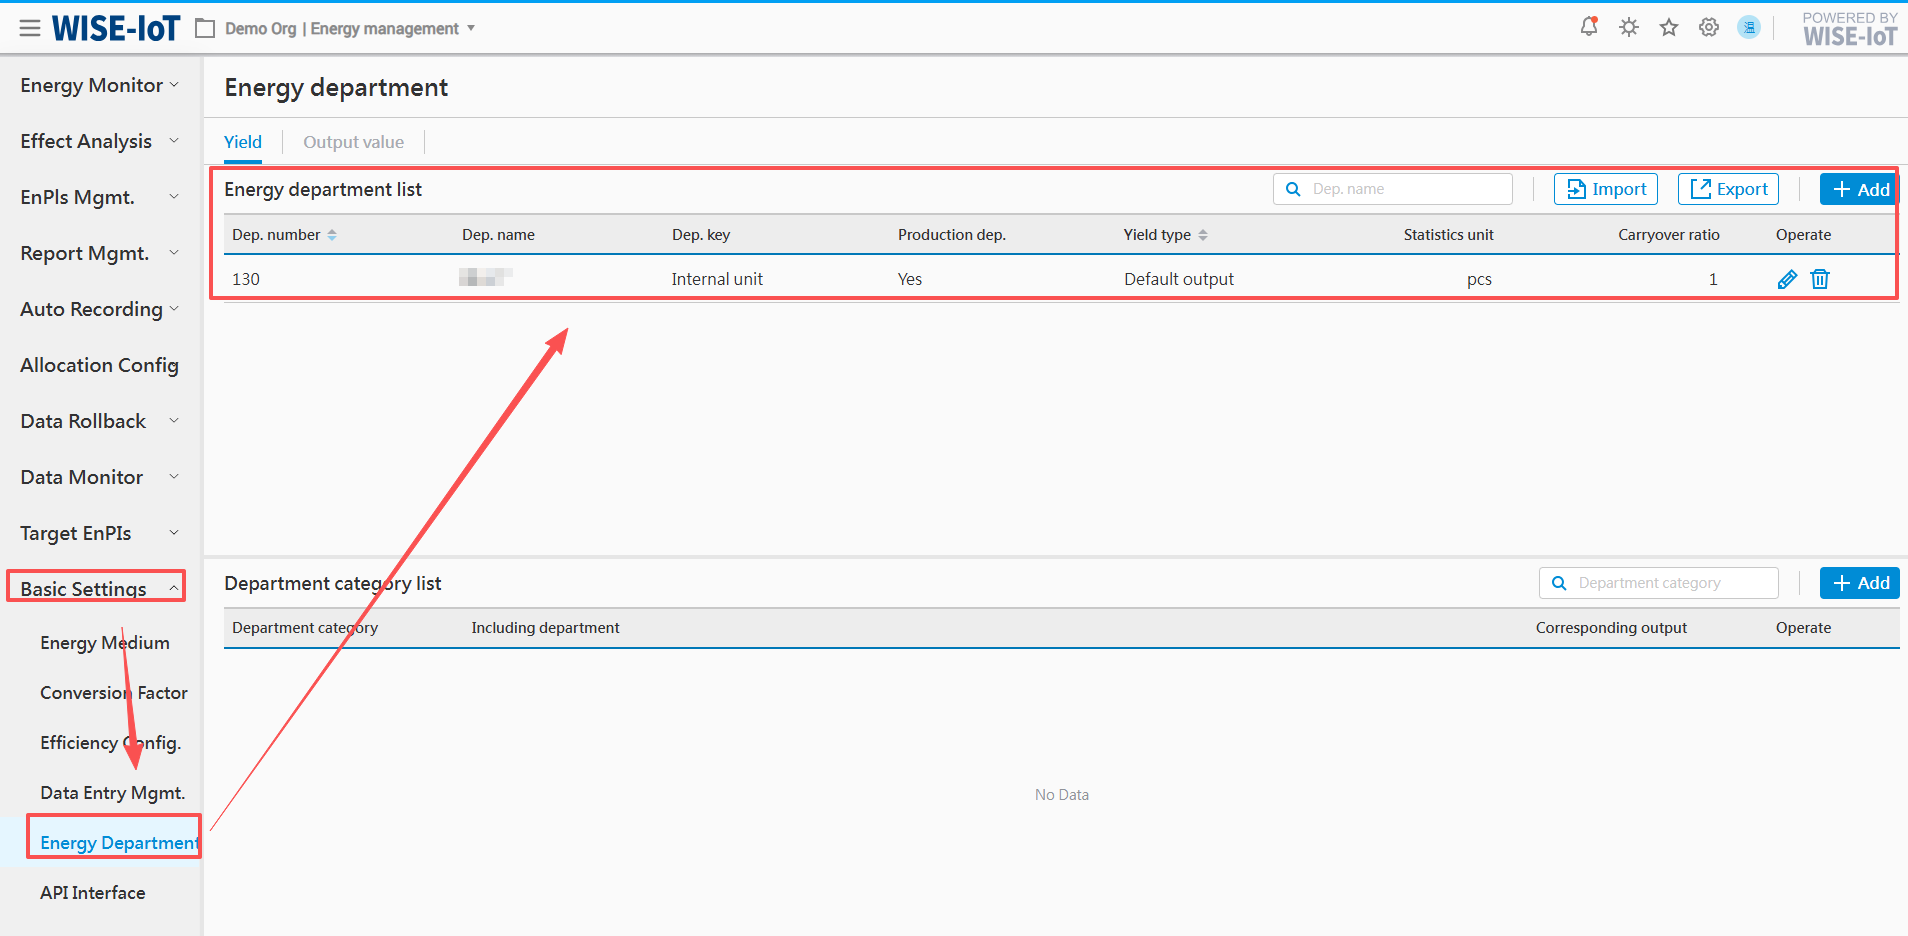
Click the "Add" button to enter the new department page:
- Department numuber/Department Name are the respective parameters in the interface.
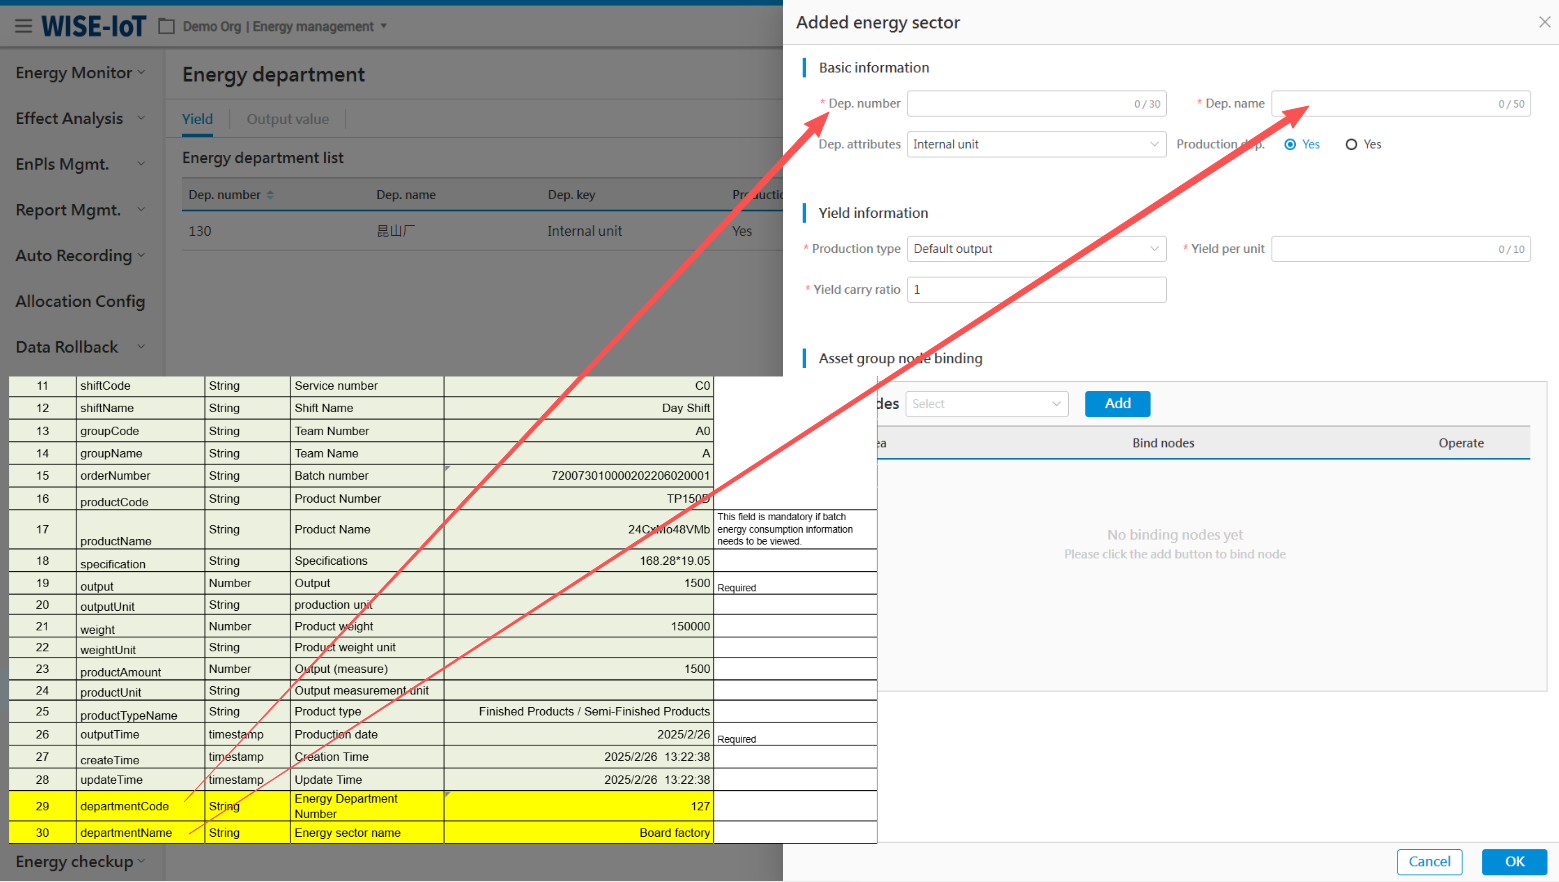
- Bind node to asset group.
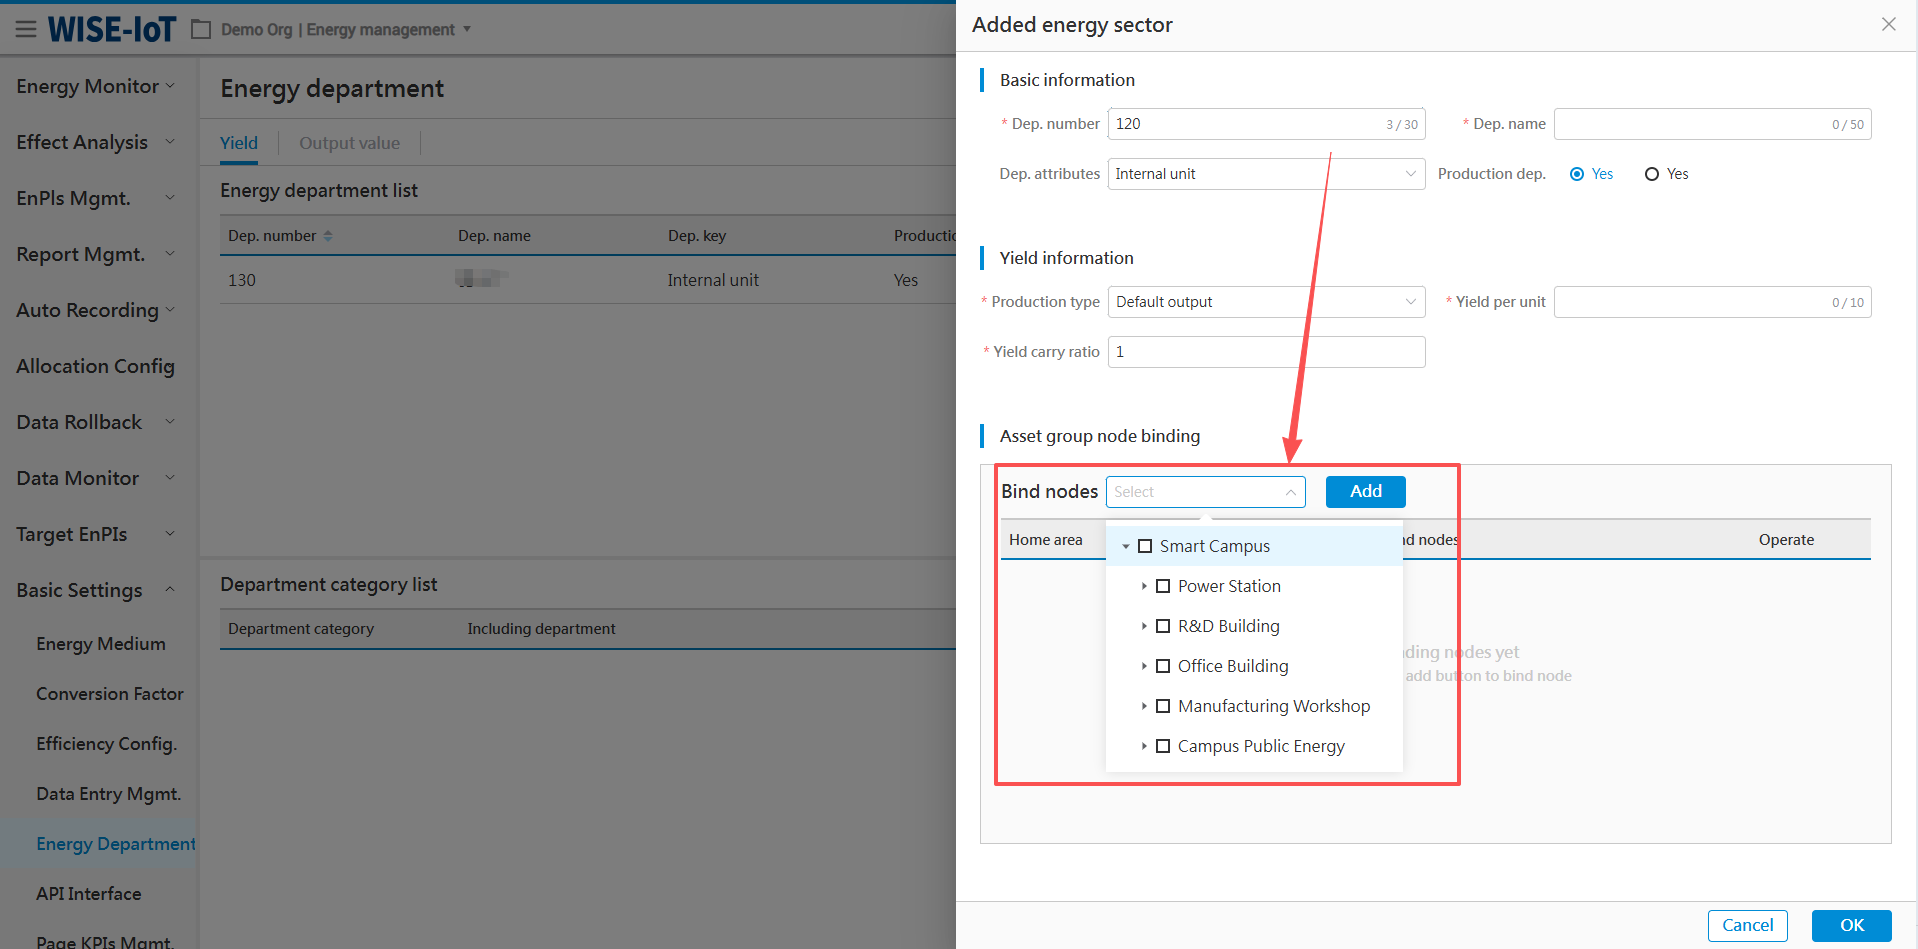
When binding asset group nodes, please first clarify the calculation logic for site output.
For example, Group A -> Cell Plant -> L1 Line -> Packing and Warehousing Process. Among these, the output is attributed to the Packing and Warehousing Process, and is also part of the output calculation formula for all its parent nodes.
So, when binding the nodes, you need to select: Group A, Battery Cell Plant, L1 Line, and Process Packing Storage. The system will then perform a cumulative calculation based on the output bound to the nodes.
Batch data lakehouse table and interface input component configuration
Confirm Batch Interface Parameters
Number Field Name Data type Description Sample Data & Notes
1 orderNumber String Batch number 720073010000202206020001 Required
2 lineCode String Production line number 7300000 Required
3 startTime timestamp Start time 2025/2/26 13:22:38 Required
4 endTime timestamp End time 2025/2/26 21:28:59 Required
5 createTime timestamp Creation time 2025/2/26 21:28:59
6 updateTime timestamp Update time 2025/2/26 21:28:59
Build batch table in APM
- Go to data warehouse modeling in the data lake, click the '+' sign to pop up the configuration table screen.
- Refer to the image below for filling in basic information.
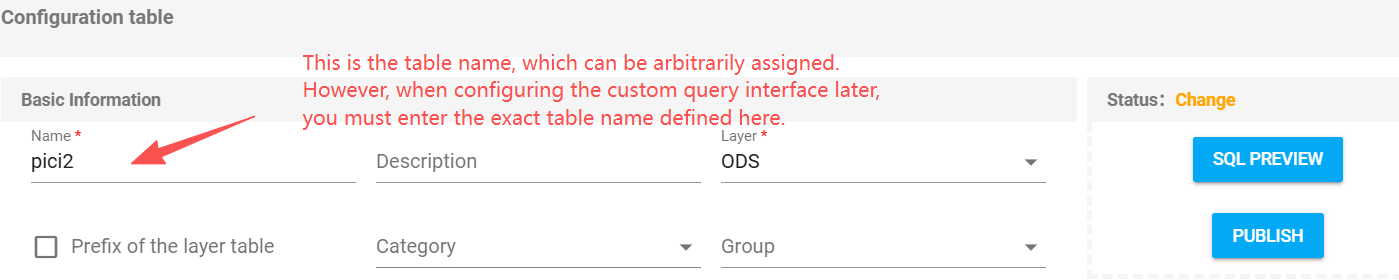
- Refer to the figure below for table model creation.
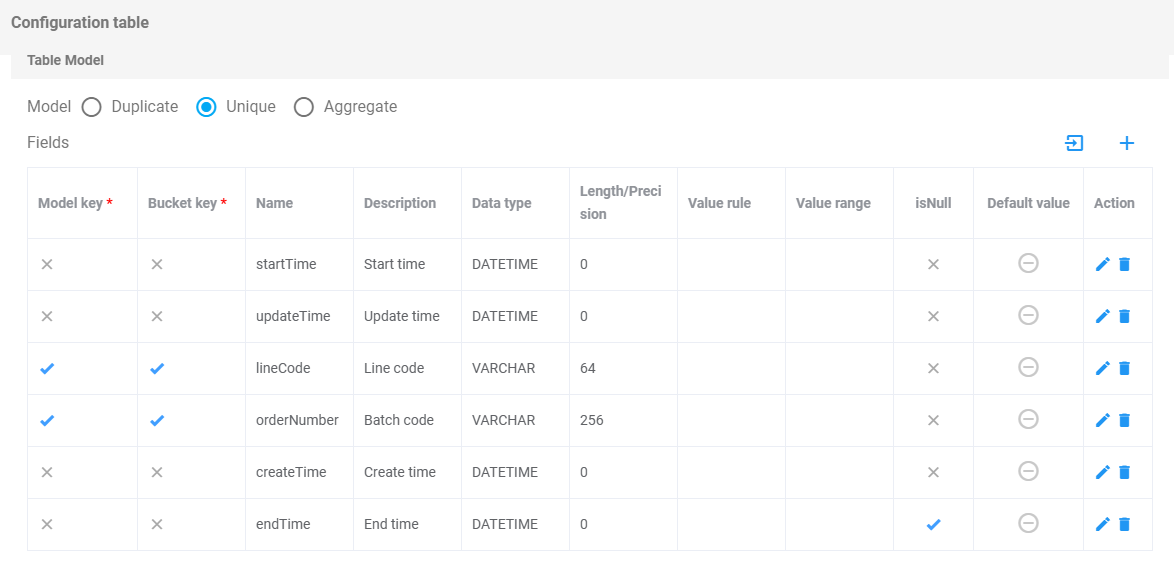
-
After filling out, click Save Data.And click the "PUBLISH" button in the upper right corner, and the batch table is successfully created.
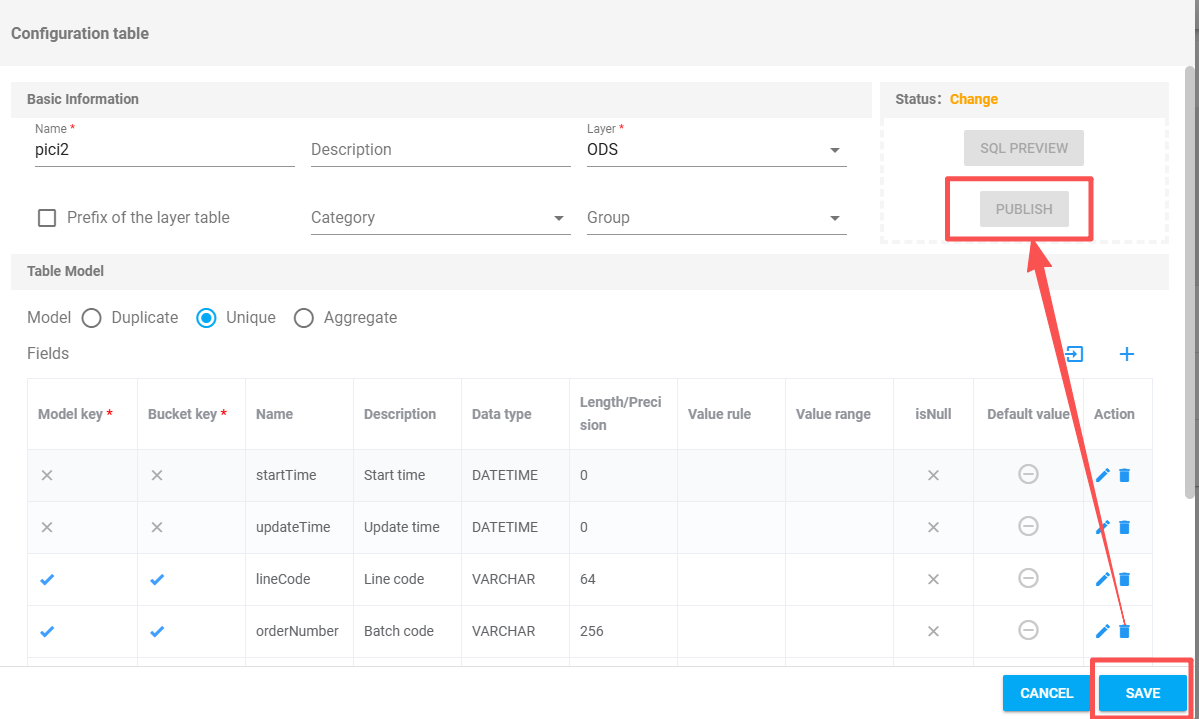
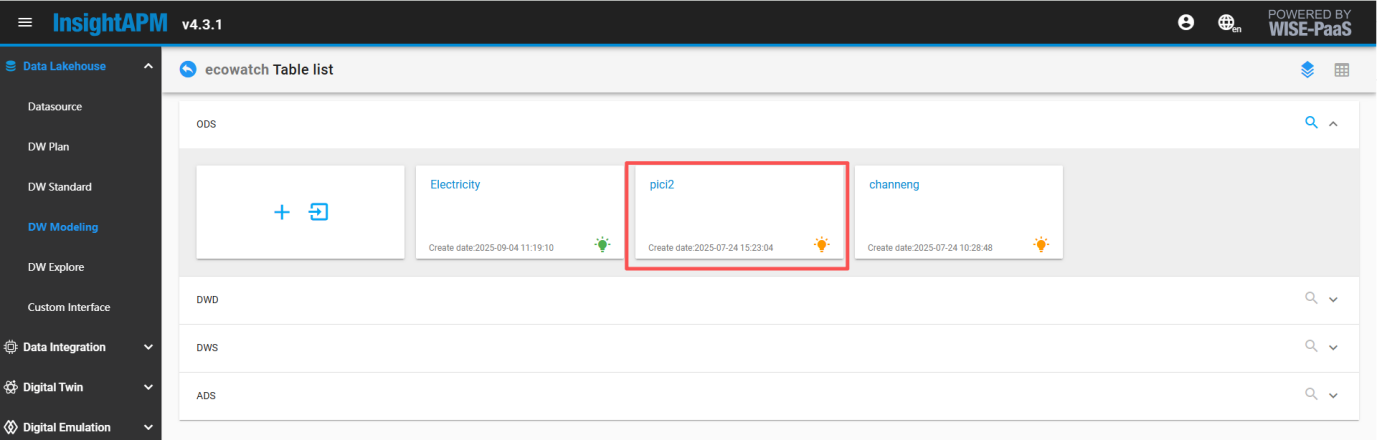
Configure the batch information interface input component to fetch third-party batch API data.
In APM asset group management, select a root node of an asset group. After entering, drag and drop an [Interface Input] component from the component list on the left, then double-click the [Interface Input] component to enter.
-
Please fill in the basic information as shown in the image below, then click 'Next'.
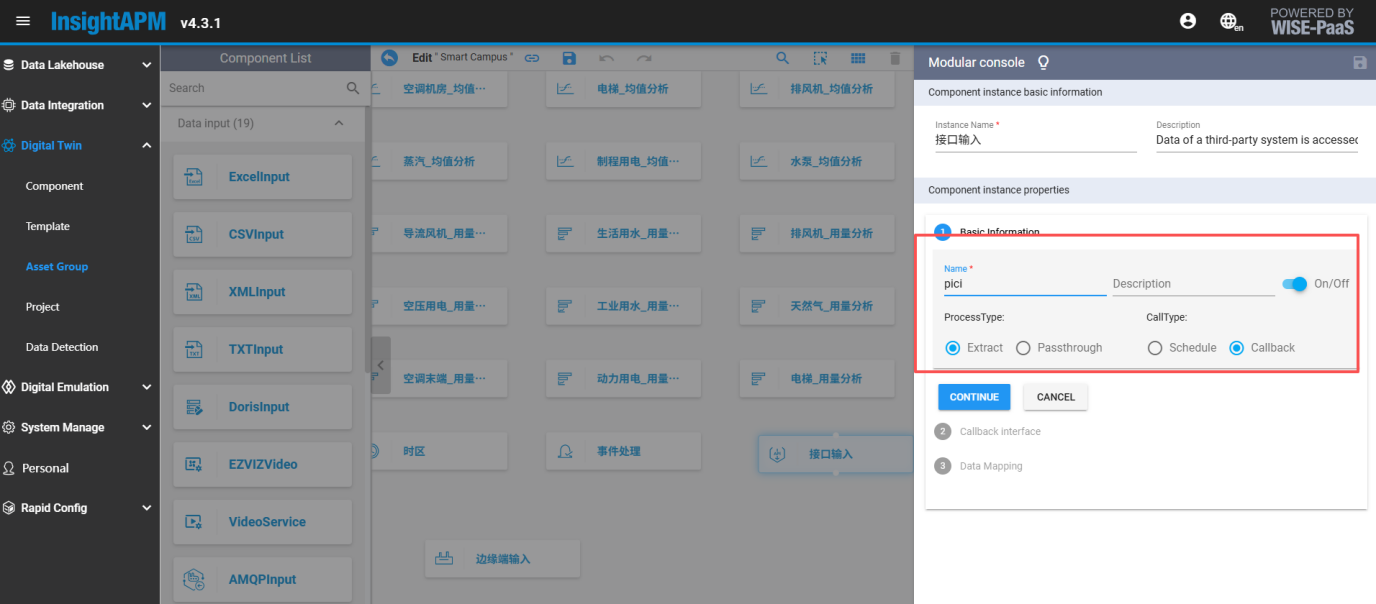
-
The callback interface is pre-filled by the system. Click Next.
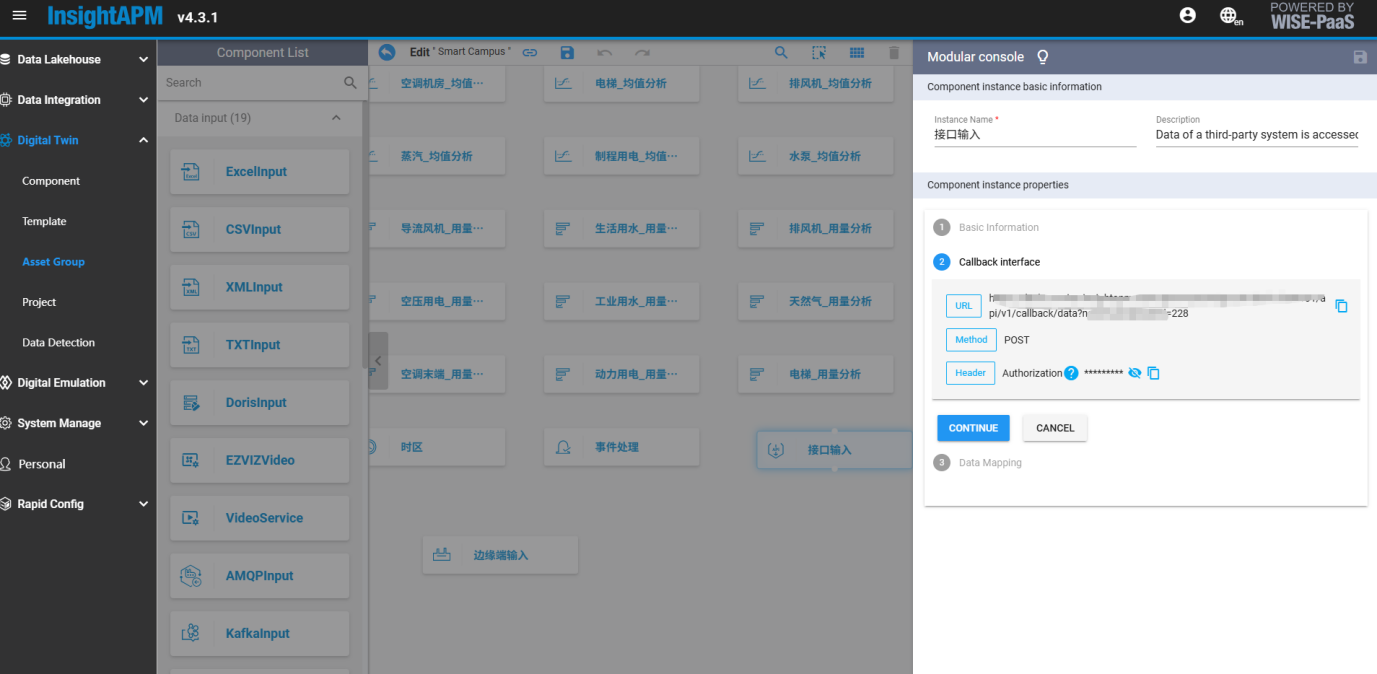
-
Data mapping
-
JSON source data: Fields are consistent with data warehouse table fields.
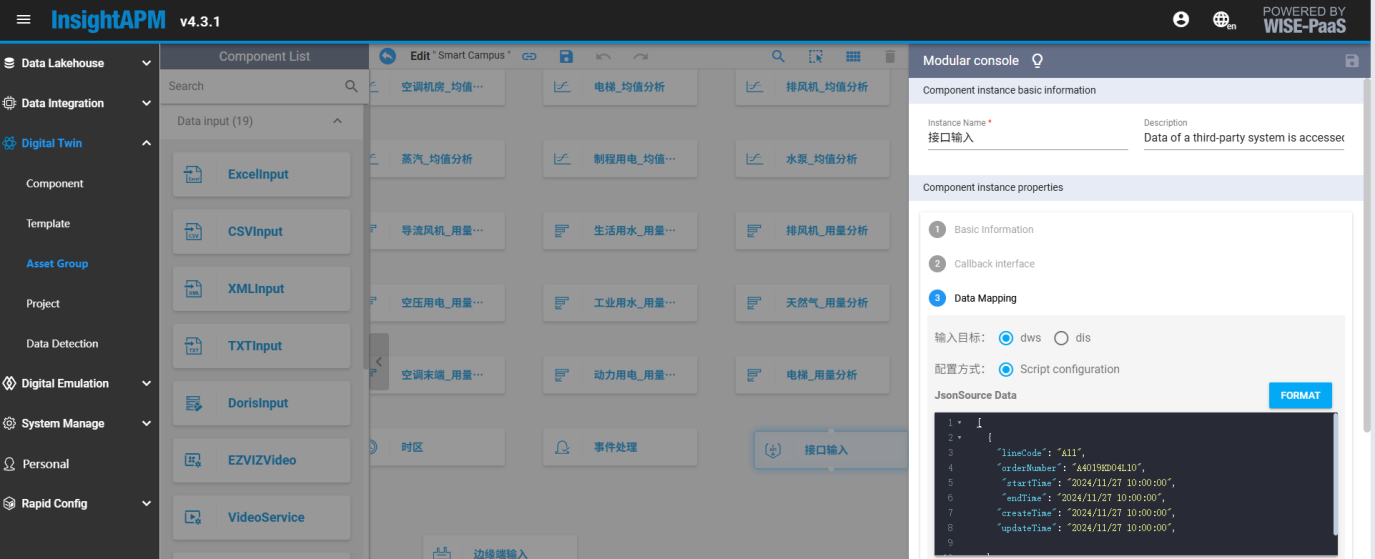
[
  {
    "lineCode": "A11",
    "orderNumber": "A4019KD04L10",
    "startTime": "2024/11/27 10:00:00",
    "endTime": "2024/11/27 10:00:00",
    "createTime": "2024/11/27 10:00:00",
    "updateTime": "2024/11/27 10:00:00"
  }
]
- Script Mapping: Fields are consistent with data warehouse table fields.
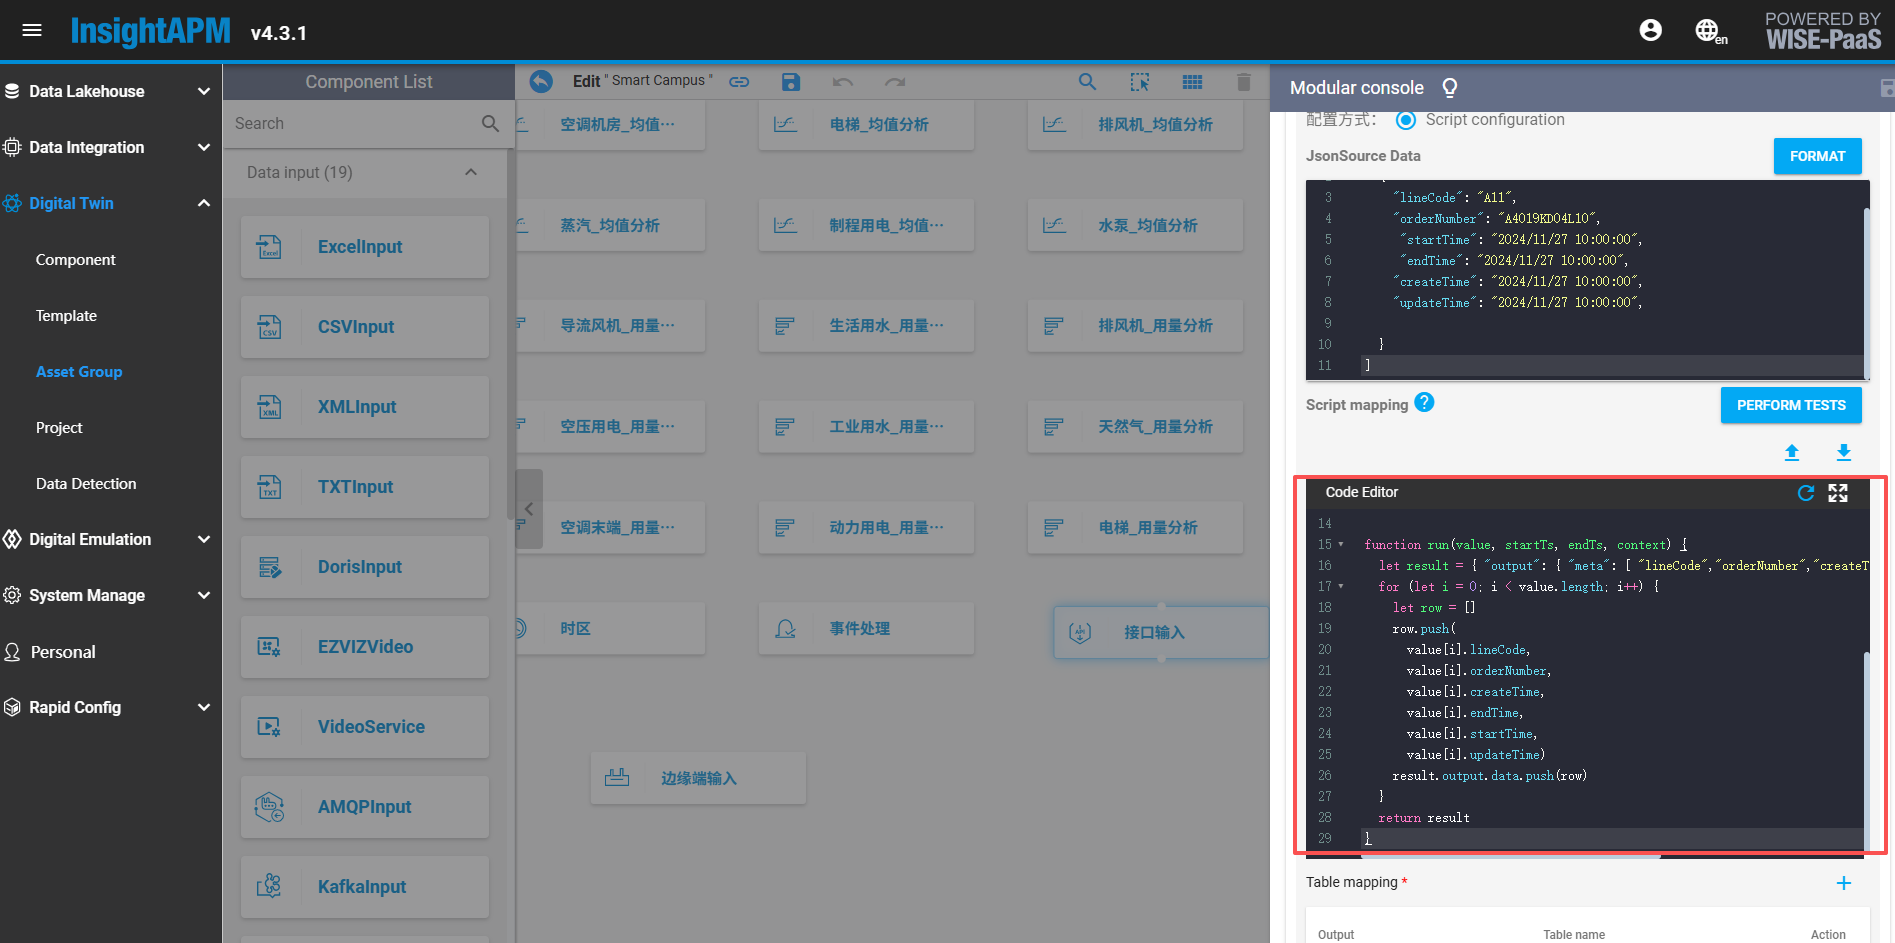
function run(value, startTs, endTs, context) {
  let result = {
    "output": {
      "meta": [
        "lineCode", "orderNumber", "createTime", "endTime", "startTime", "updateTime"
      ],
      "data": []
    }
  }

  for (let i = 0; i < value.length; i++) {
    let row = []
    row.push(
      value[i].lineCode,
      value[i].orderNumber,
      value[i].createTime,
      value[i].endTime,
      value[i].startTime,
      value[i].updateTime
    )
    result.output.data.push(row)
  }
  return result
}
Table Mapping: Select table name from data warehouse tables
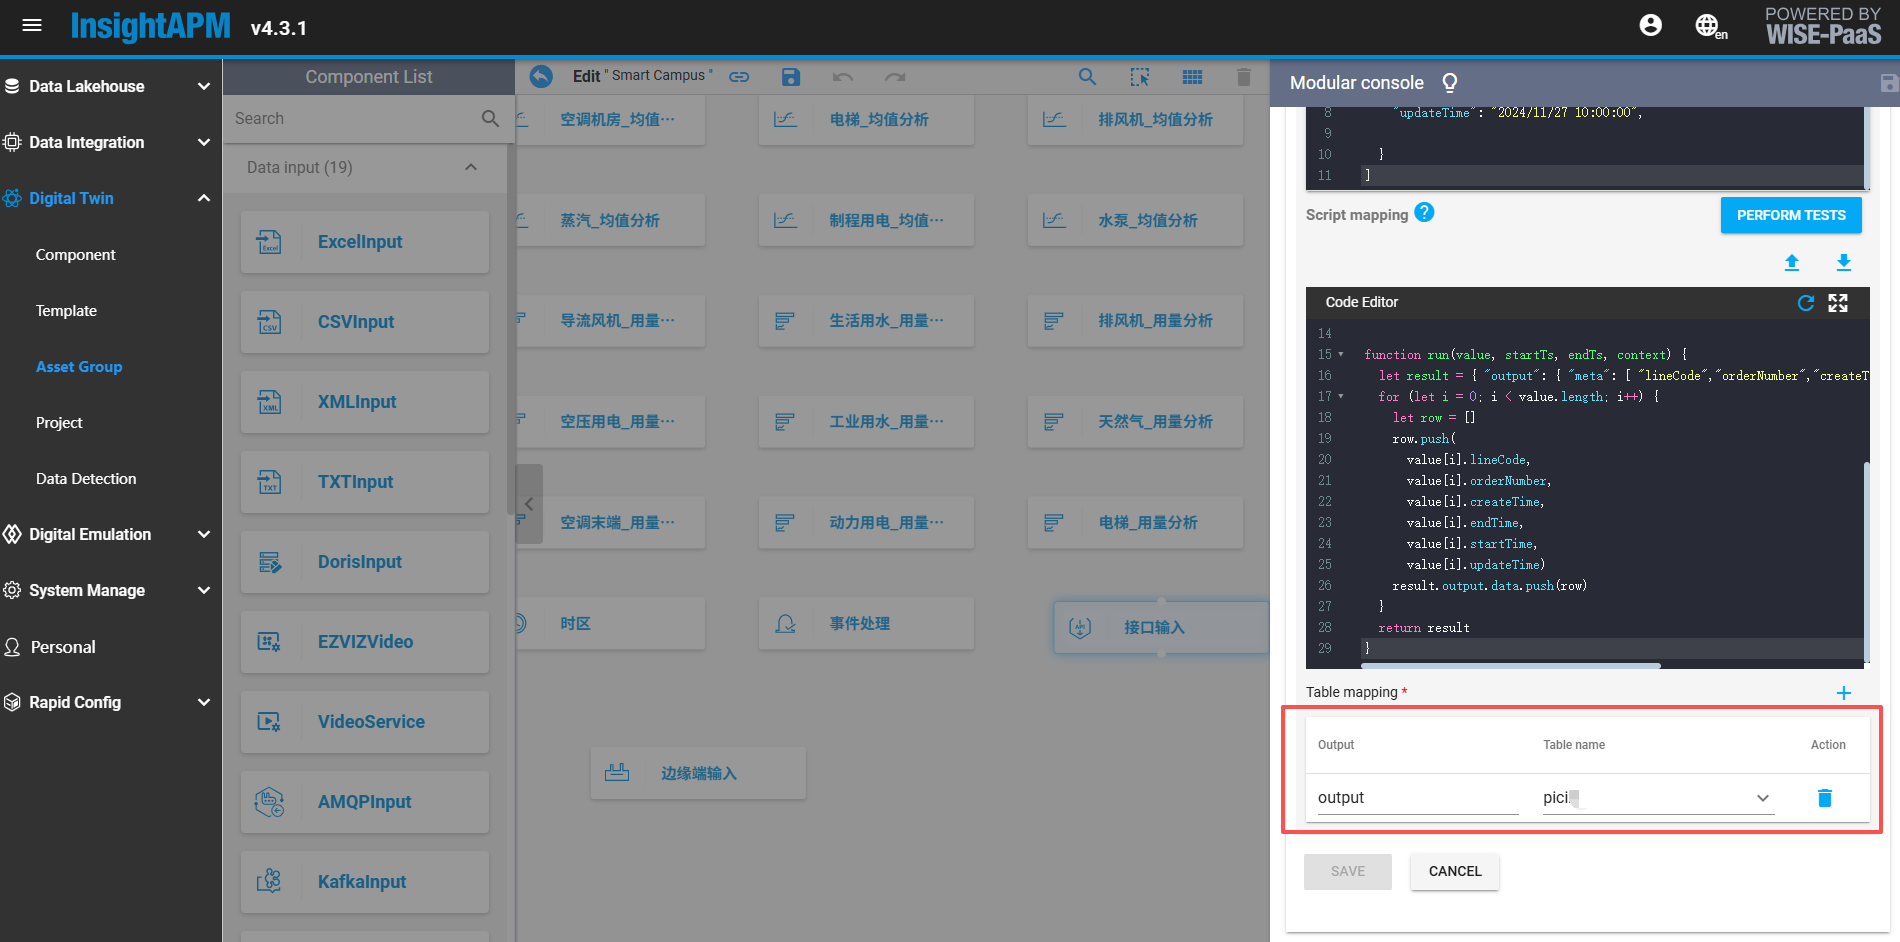
- After the above steps are configured, SE needs to provide the following information to the customer and have the customer enter production data based on this information.
Provide information Reference interface
Access address、Authorization 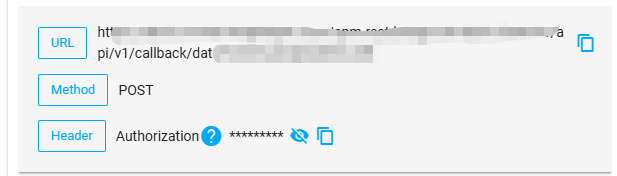
Token Find token information in Postman
HEADERS Find HEADERS information in Postman
BODY Input parameters must be fully entered. This is determined based on the actual parameter fields of the user's project site and kept consistent with the fields in Step 1.
Develop an interface for querying batch information.
Create 'ecowatch' interface group
Click APM Data Lakehouse >> Custom Interface, click "+" button to enter, Name fixedly fill in ecowatch, path fixedly fill in /ecowatch, Basic Auth click refresh button automatically generate token, Click Save (If interface group already established, then skip this step):
Create batch output interface (for batch energy consumption use)
Click on the "ecowatch" created in the previous step to enter, then enter the custom interface list screen, click the Add button to configure the custom interface:
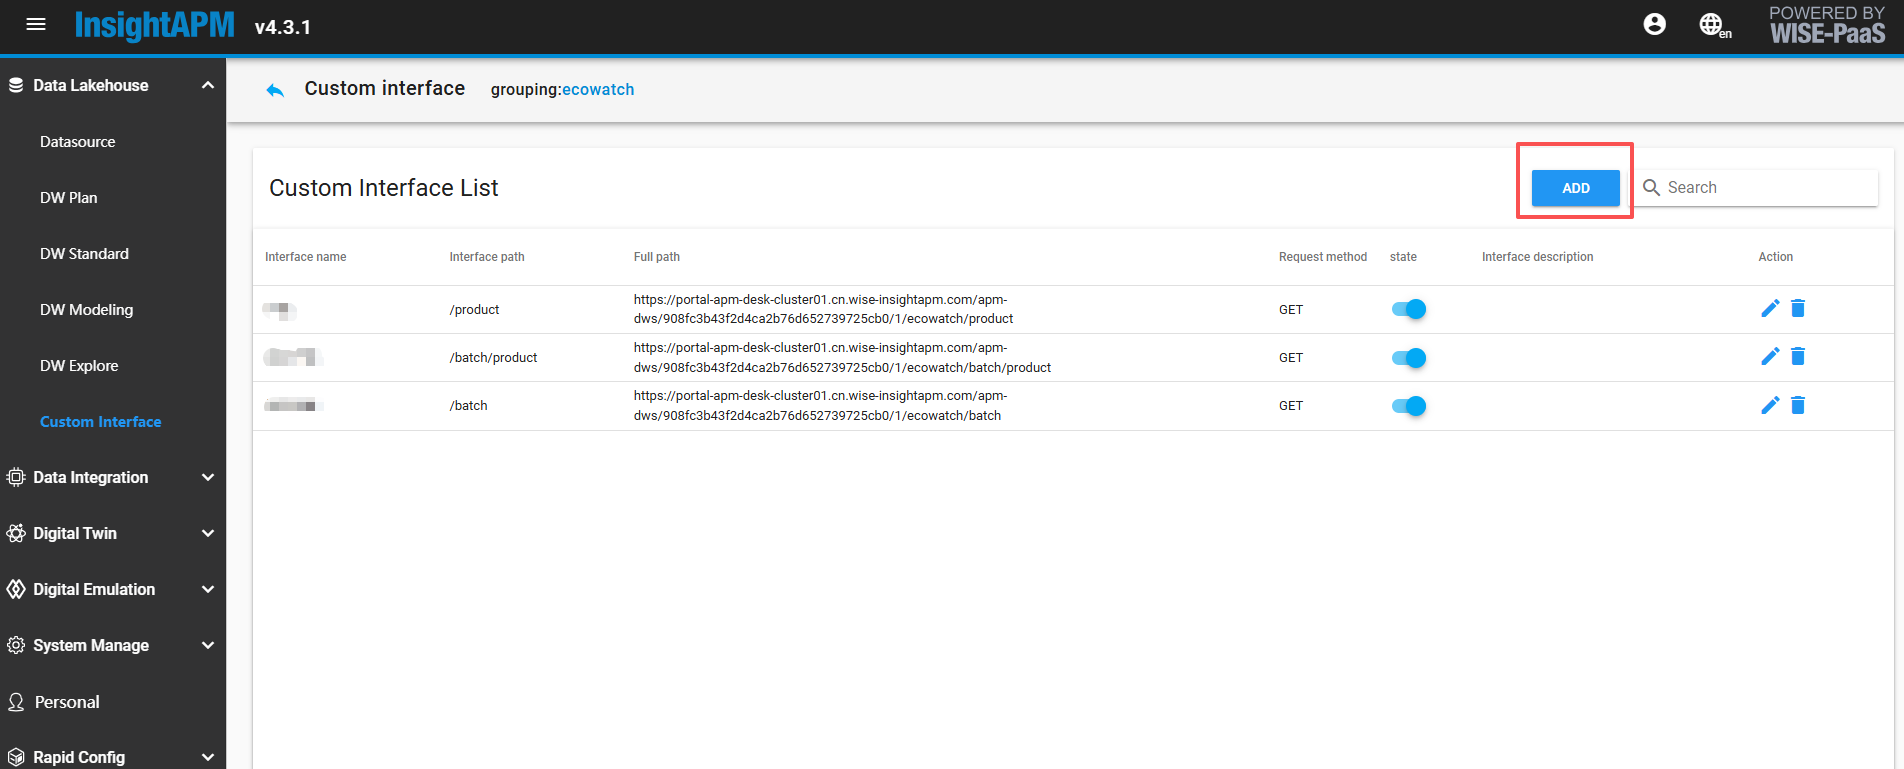
- Click the newly generated project to enter the custom interface list screen, click the Add button to configure the custom interface, fill in 'Batch Yield' for the interface name, select GET request, fixedly fill in /batch/product as the request path for the data interface, and choose BearerToken for the authentication method.
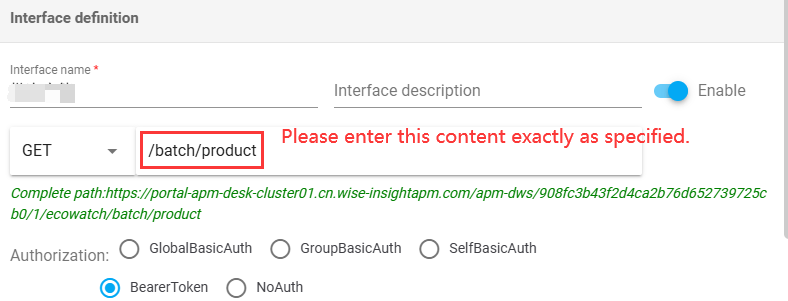
-
Refer to the example diagram for PARAM configuration. If there are multiple values for order_numbers, separate them with commas.
Example: A4019KD04L11,A4019KD04L10
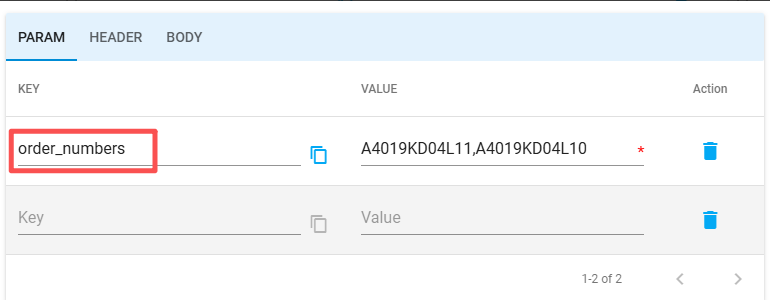
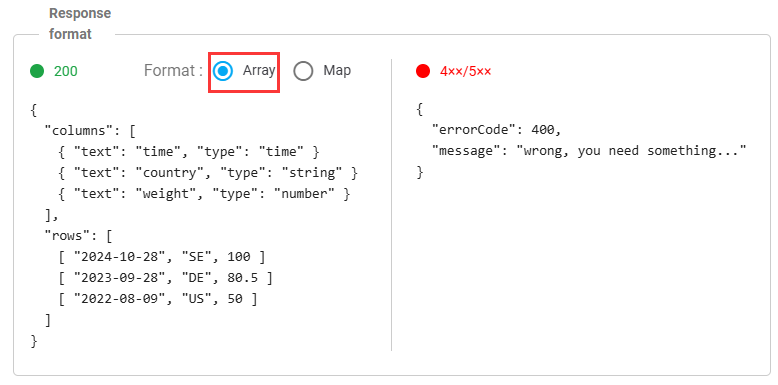
- Query configuration interface data source selects default data source, fill in sql, SELECT * FROM channeng WHERE find_in_set(orderNumber, ?)
Parameter list filled according to the schematic diagram
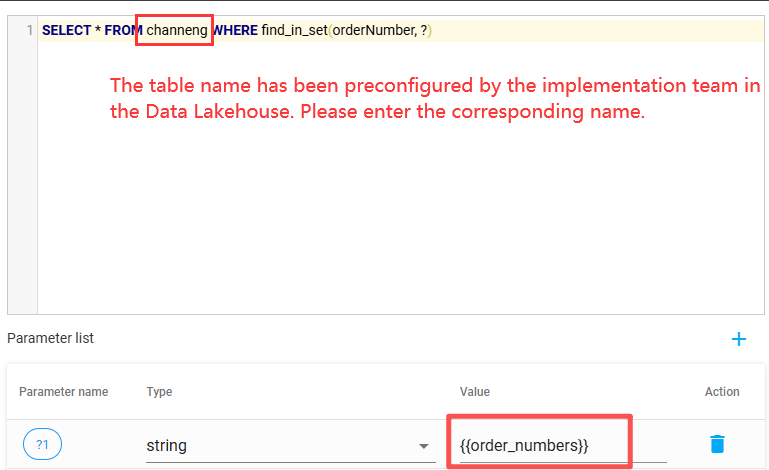
-
Execute the test. After success, click Save, and you will see this interface information generated on the custom interface list screen.
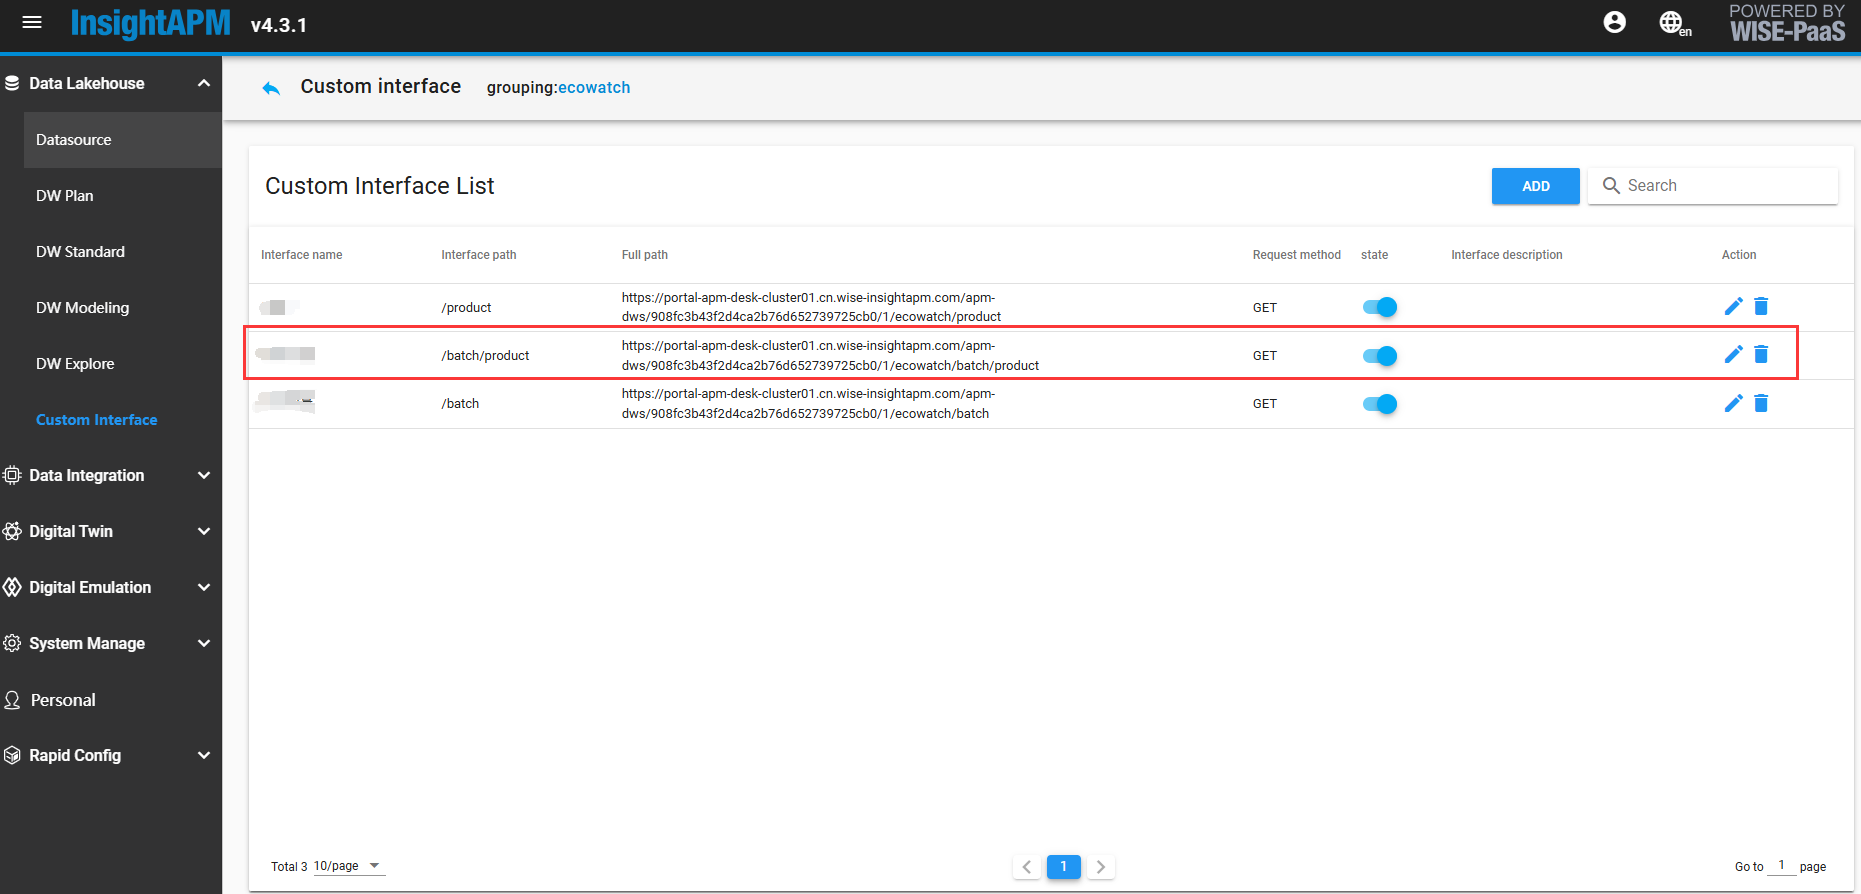
-
Calling this interface to get data is consistent with the method of calling a restful style interface. The full path is the URL of this interface, GET is the type of request method, and the request parameters are the PARAM in the third step.
Create batch usage interface (for batch energy usage)
Click on the "ecowatch" created in the previous step to enter, enter the custom interface list screen, click the Add button to configure the custom interface:
-
Click the newly generated project to enter the custom interface list screen, click the Add button to configure the custom interface, fill in "Batch Usage" for the interface name, select GET request, and fixedly fill in /batch as the request path for the data interface.
Authentication method: Bearer Token
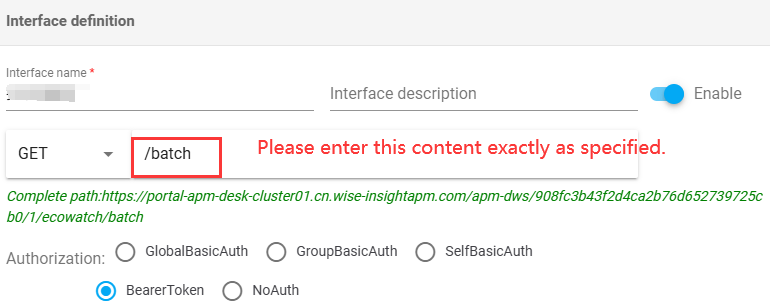
- PARAM Configuration Reference Diagram, If node_ids has multiple values, please separate them with commas when filling in. eg: 117,118,119
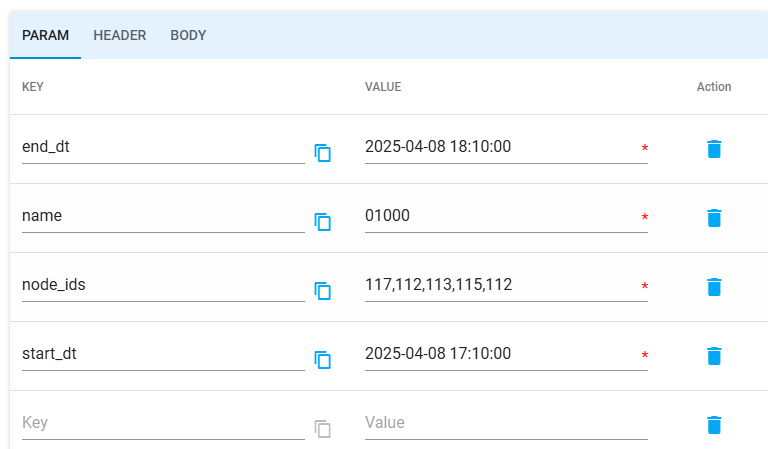
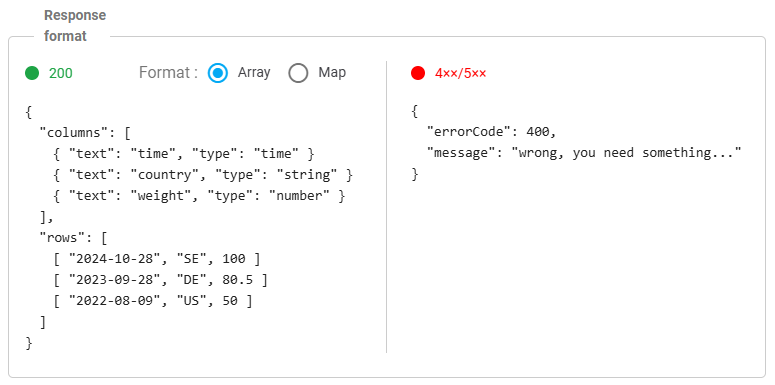
-
On the query configuration interface, select the default data source and enter the SQL:SELECT * FROM t_duration_usage_data_1 WHERE find_in_set(node_id, ?) AND name = ? AND start_ts >= ? AND start_ts < ?
Configure the parameter list according to the schematic diagram.
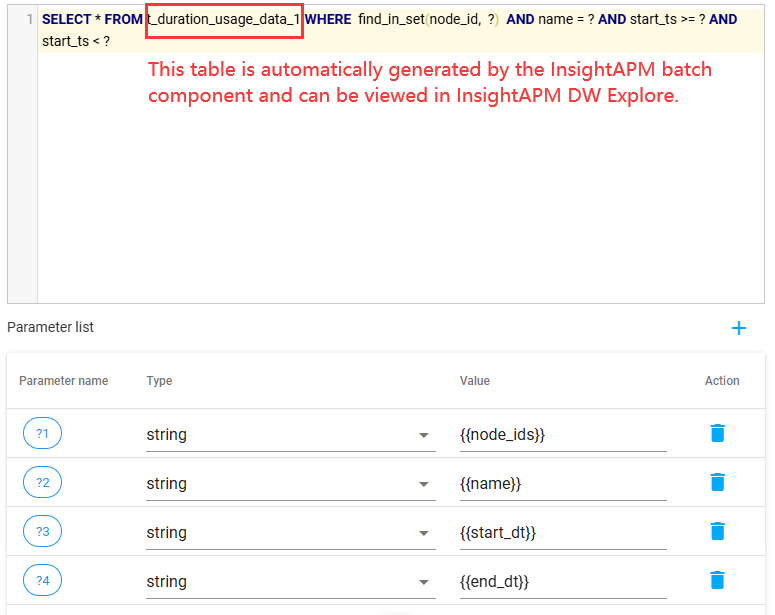
-
Run the test, and upon success, click Save. This interface information will then be visible on the custom interface list screen.
-
Calling this interface to obtain data is consistent with the method of calling a RESTful API. The full path is the URL of this interface. GET is the type of request method. The request parameter is PARAM from the third step.
Batch Usage Component Configuration
Please note before configuration: For whichever production line needs to track batch usage, please add the batch usage component in that production line.
- In APM asset group management, find the production line node of the corresponding asset group, click the Edit button to enter, drag the "Period Usage Analysis" component from the component list to the canvas, as shown in the figure below:
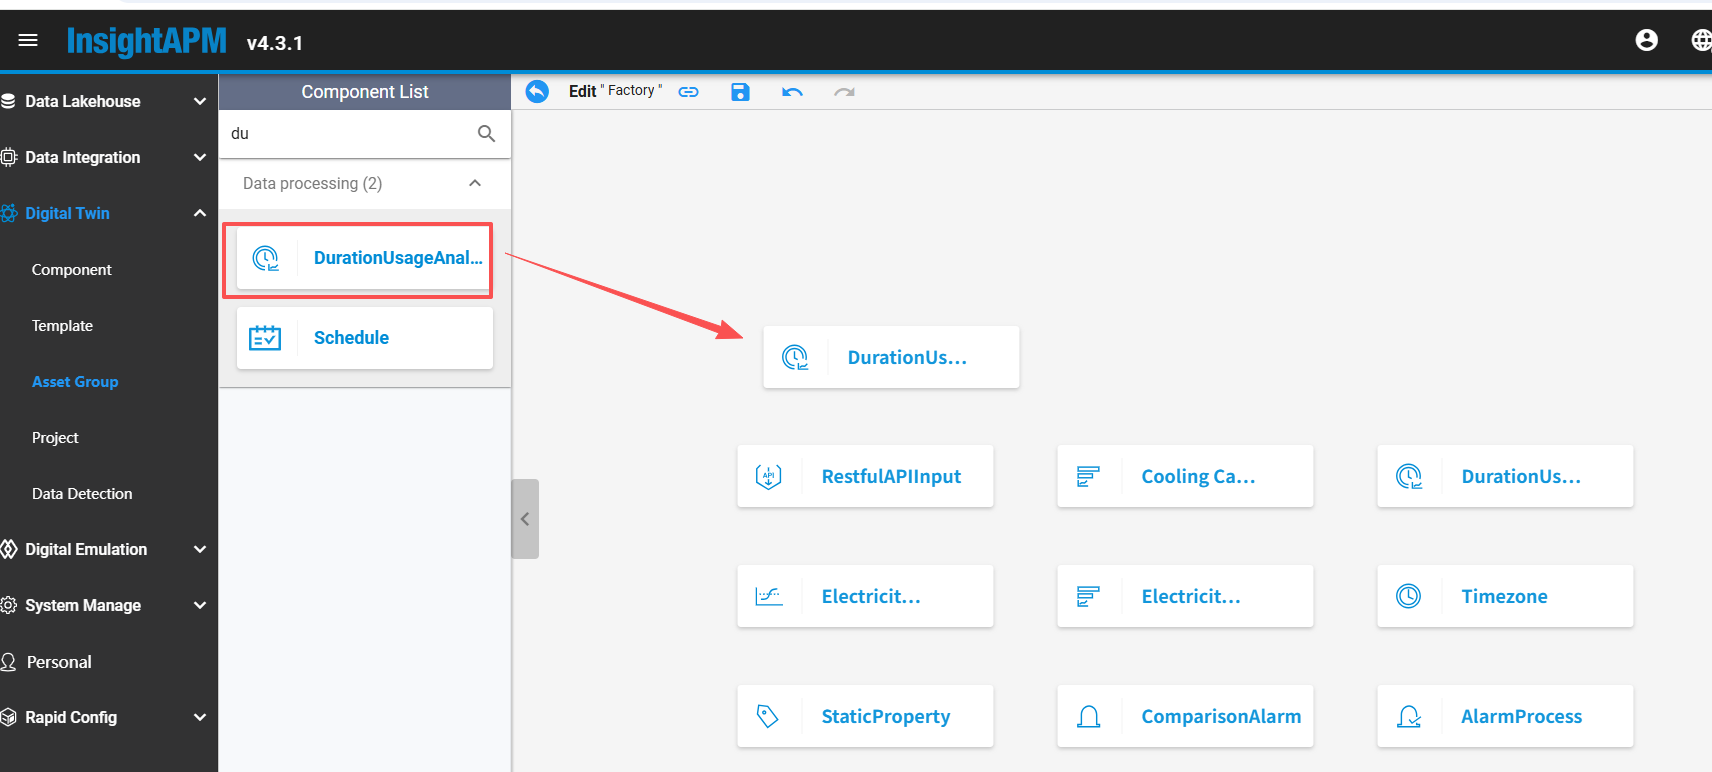
- Double-click this component to enter the component console interface, click the "Add custom metrics" button to jump to the "Component instance properties" interface.
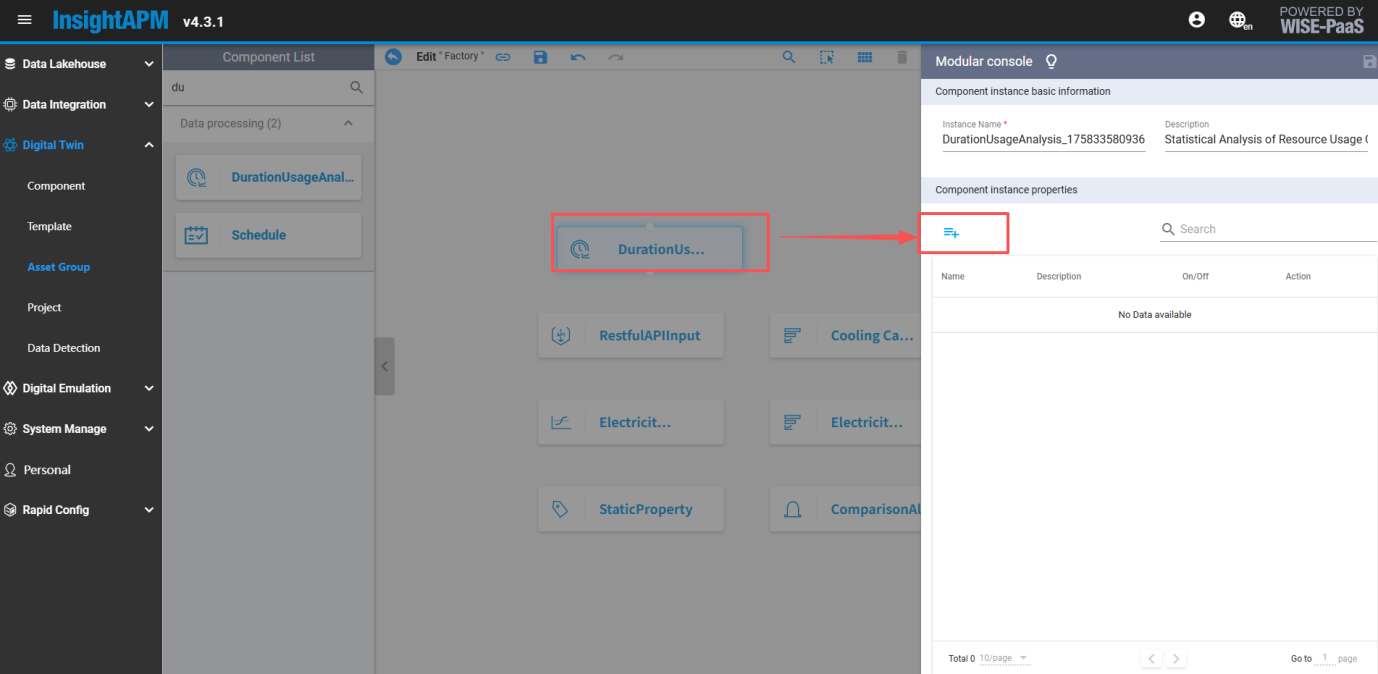
-
Pay attention to filling in the name in the basic information, it needs to be filled as the classification sub-item code of this node, decimal places should be kept as needed, and data counted by ecowatch should retain 2 decimal places.
The number of component instances created here depends on the energy classification sub-item dimension queried by the interface. For example, if the customer only views batches of electricity, then only configuring electricity code "01000" here will suffice. But if the customer needs to view batches of electricity, water, etc., then 2 component instances need to be created, namely electricity code "01000" and water code "02000".
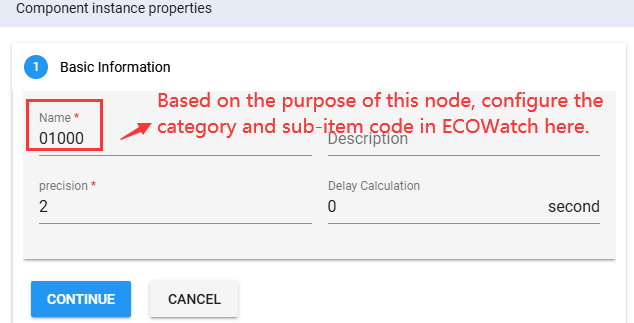
- Click CONTINUE to enter the time range settings page and set the repeat cycle to 1 hour.
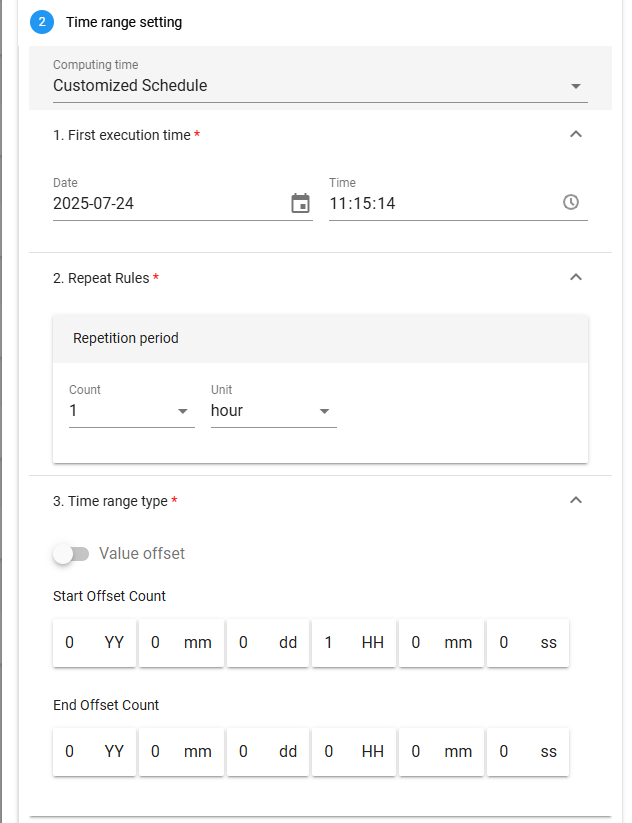
- Click CONTINUE to enter parameter and calculation formula settings.
(1) Data source, table name selection, retrieve from the pre-established batch information data warehouse and data tables;
(2) Add filter parameters lineCode and its corresponding value;
(3) Time period mapping:
-
Time period label selection orderNumber;
-
Update time selection updateTime;
-
Start time selection startTime;
-
End time selection endTime 。
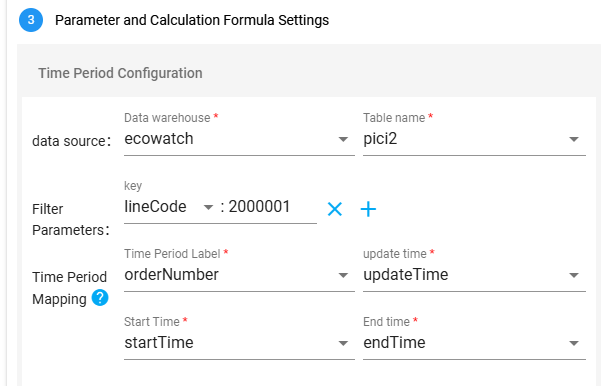
- Calculation formula configuration is filled based on actual business statistics, calculation output configuration will be filled by default and does not require setting.

- Click the save button to generate the corresponding custom statistical calculation items, and the configuration is complete.
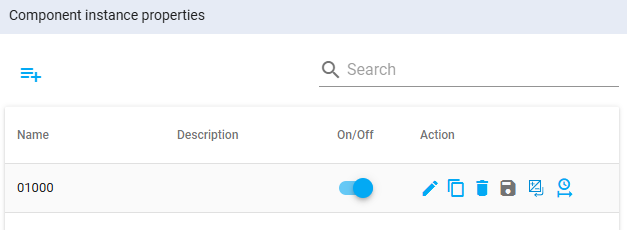
Time Schedule
The time schedule function involves the management of non-calendar day times, such as peak, flat, and valley periods, shift times, and working hours. For these complex time configurations, the system can through a series of configure, and used for energy consumption Statistical Computing。
- TOU time configuration
The system supports defining and managing "Super-peak, On-peak, Mid-peak, Off-peak and Super off-peak" time-of-use(TOU) periods. Different prices and enablement strategies are set for these periods based on electricity load fluctuations.
- Shift time configuration
The system supports time management configuration for production shifts, in order to calculate energy consumption within the shifts. According to the company's actual production arrangements, shift times can be fixed (e.g., 8-hour work system) or flexible (e.g., two-shift system or three-shift system).
- Work time configuration (To be opened)
The system supports statistically analyzing energy consumption for different periods, divided by actual working and rest times. This configuration is suitable for certain production activities or operations where working and resting hours do not fully align with the natural day's time distribution. This function can help enterprises reasonably evaluate the energy efficiency differences between actual production periods and rest periods.
Public Services - Time Schedule
Time Schedule Service Entry
After successfully logging in to iEMS, select "Time Schedule" from the application list and enter.
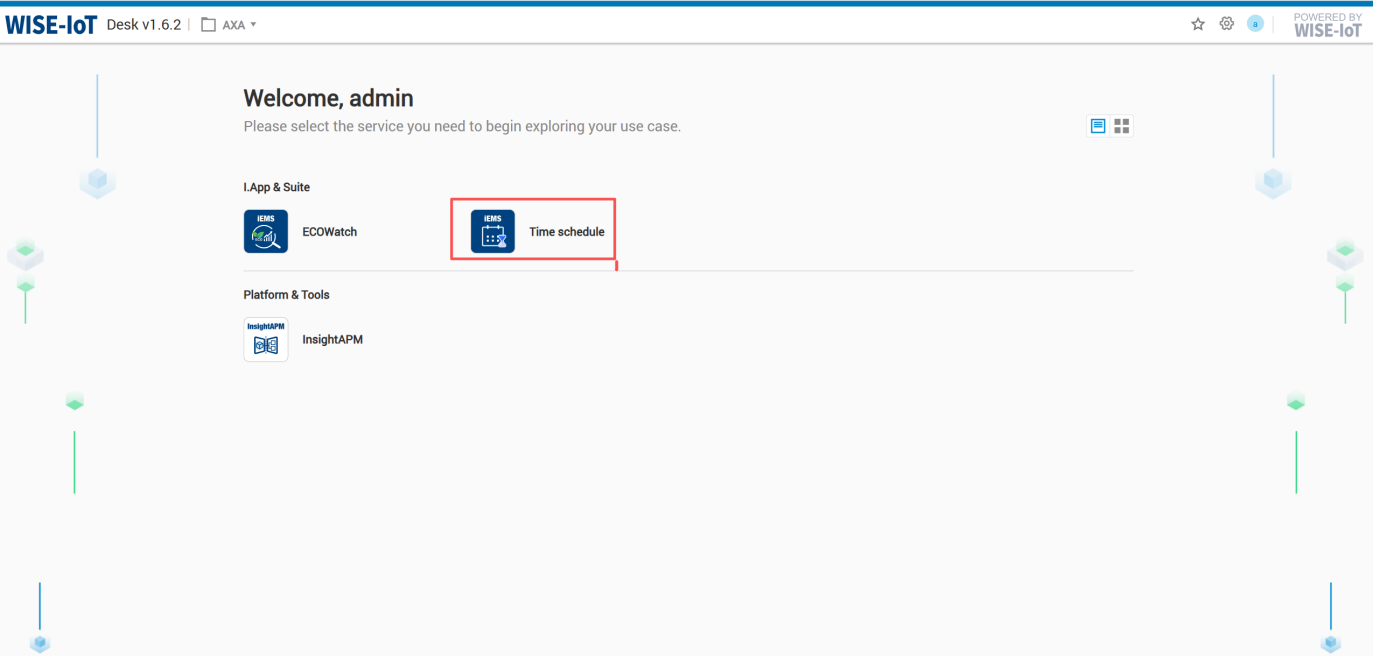
Task Setting
TOU Time Settings
Click Time Schedule>>Task Setting>>Click "TOU time"tab, Enter Peak-Flat-Valley Policy Configuration Page.
The overall configuration process is as follows:
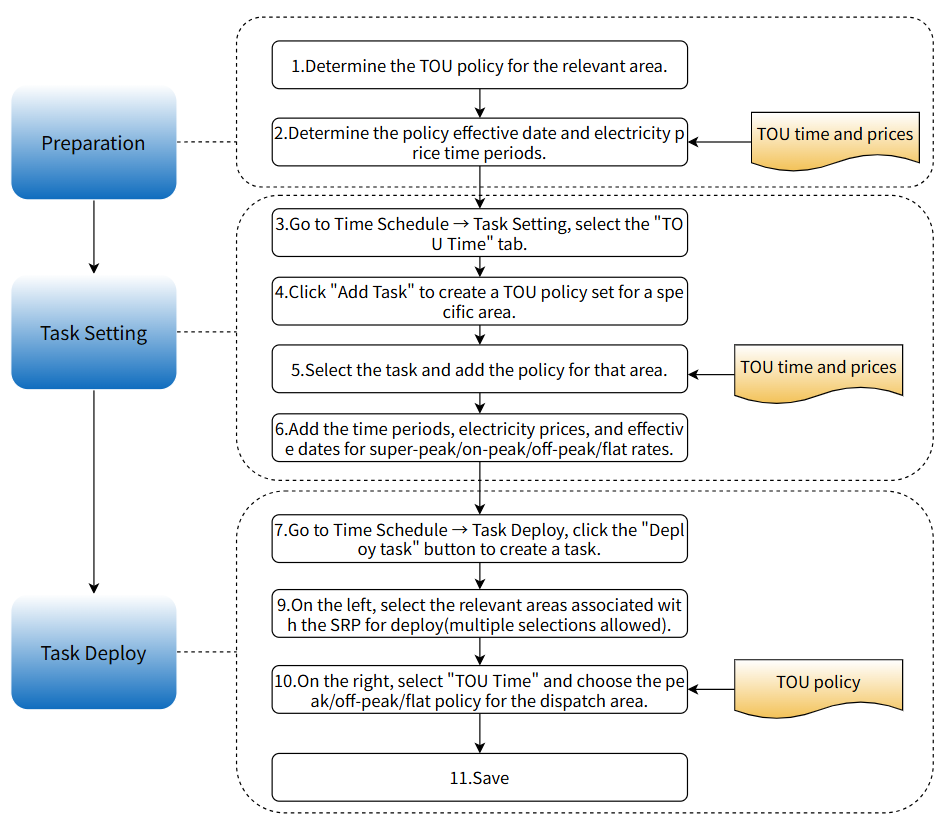
TOU Plan Lists
The initial page is empty, you need to click the "Add Task" button to formulate TOU policy sets for a certain region or area, for example, Kunshan Factory can use Kunshan as a task to serve as the peak-flat-valley policy set for the Kunshan region; Xi'an Office can use Xi'an as a task to serve as the peak-flat-valley policy set for the Xi'an region, as shown in the figure below:
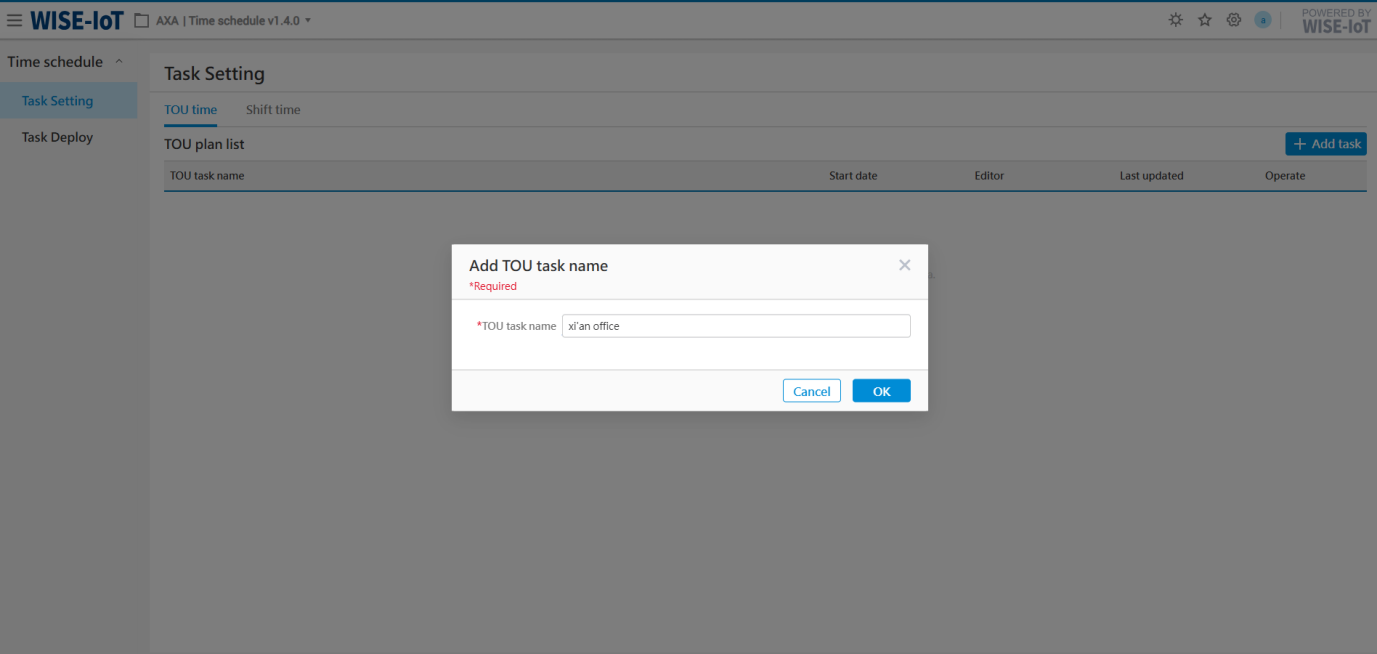
After creating the task, the system will display the information of the newly created task, as shown in the figure below:
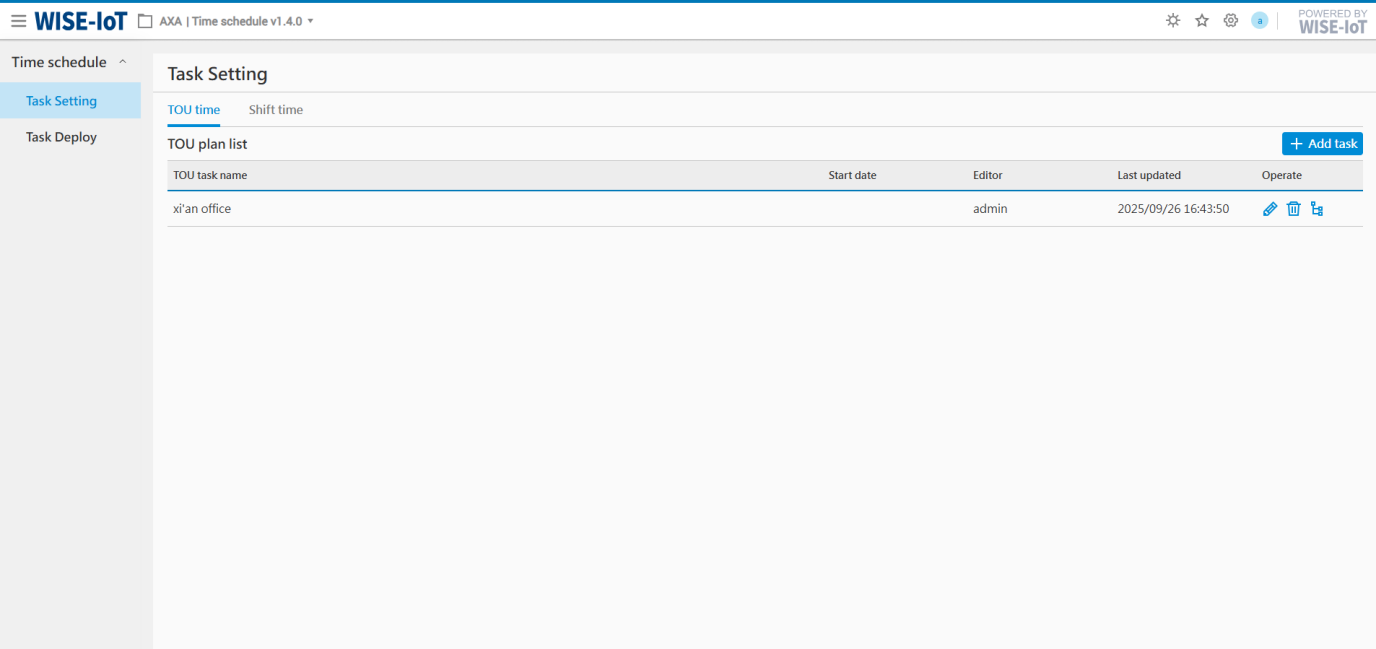
In the list page:
-
A region can add up to 12 policies;
-
Allow modification and deletion of policies;
-
Add, edit, and delete operations are permission-restricted. If a user needs to perform add, edit, or delete operations, please contact the local administrator for permission configuration.
TOU Policy Add
In the list, select a task (e.g., xi'an office), click "![]() " button, enter the area's peak-flat-valley policy addition page, and formulate the content and steps as follows:
" button, enter the area's peak-flat-valley policy addition page, and formulate the content and steps as follows:
+------------------------------------------------------------------------------------------------------------------+------------------------------------------------------------------------------------------------------------------------------------------------------------------+
| Step 1: Policy settings |
+------------------------------------------------------------------------------------------------------------------+------------------------------------------------------------------------------------------------------------------------------------------------------------------+
| Basic Information | Enter TOU plan name (e.g., New Peak-Flat-Valley Policy effective from 2025/05), and set the effective date of the new policy. |
+------------------------------------------------------------------------------------------------------------------+------------------------------------------------------------------------------------------------------------------------------------------------------------------+
| Once completed, we will then begin configuring the time slots and electricity price information for the new policy. |
+-------------------------------------------------------------------------------------------------------------------------------------------------------------------------------------------------------------------------------------------------------------------------------------+
|  |
+-------------------------------------------------------------------------------------------------------------------------------------------------------------------------------------------------------------------------------------------------------------------------------------+
| Step 2, Period settings and TOU time setting |
+------------------------------------------------------------------------------------------------------------------+------------------------------------------------------------------------------------------------------------------------------------------------------------------+
| (3) period | Enter period name, e.g., Summer Month. |
+------------------------------------------------------------------------------------------------------------------+------------------------------------------------------------------------------------------------------------------------------------------------------------------+
| (4) Date | Select the date corresponding to this period |
| | |
| | 1) A date can only appear in one period; |
| | |
| | 2) Allow adding multiple dates; |
| | |
| |
|
+-------------------------------------------------------------------------------------------------------------------------------------------------------------------------------------------------------------------------------------------------------------------------------------+
| Step 2, Period settings and TOU time setting |
+------------------------------------------------------------------------------------------------------------------+------------------------------------------------------------------------------------------------------------------------------------------------------------------+
| (3) period | Enter period name, e.g., Summer Month. |
+------------------------------------------------------------------------------------------------------------------+------------------------------------------------------------------------------------------------------------------------------------------------------------------+
| (4) Date | Select the date corresponding to this period |
| | |
| | 1) A date can only appear in one period; |
| | |
| | 2) Allow adding multiple dates; |
| | |
| | 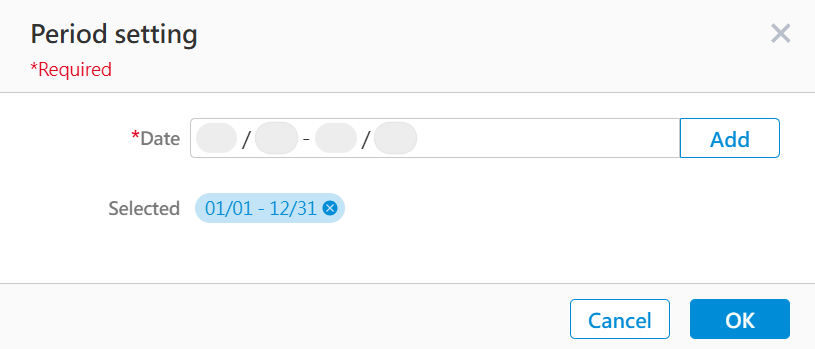 |
+------------------------------------------------------------------------------------------------------------------+------------------------------------------------------------------------------------------------------------------------------------------------------------------+
| (5) Time-of-use electricity prices | The default electricity price is "1", and the system allows users to customize it. |
| | |
| | ※CU is Currency Unit, an abbreviation for electricity price unit, and is a general term here. The display of specific cost units follows the rules of each SRP. |
| | |
| | ※ The unit of electricity is kWh |
+------------------------------------------------------------------------------------------------------------------+------------------------------------------------------------------------------------------------------------------------------------------------------------------+
| (6) TOU Period(Super-peak,On-peak,Mid-peak,off-peak) | The system's default configuration is the normal period. To adjust, select the button and drag the mouse in the canvas until the desired time slot is selected. |
+------------------------------------------------------------------------------------------------------------------+------------------------------------------------------------------------------------------------------------------------------------------------------------------+
| After the above operations are completed, if other time periods need to be configured (such as non-summer months), click the "+" button in the upper right corner to add new, continue to repeat step 2, until all are added. |
| |
|
|
+------------------------------------------------------------------------------------------------------------------+------------------------------------------------------------------------------------------------------------------------------------------------------------------+
| (5) Time-of-use electricity prices | The default electricity price is "1", and the system allows users to customize it. |
| | |
| | ※CU is Currency Unit, an abbreviation for electricity price unit, and is a general term here. The display of specific cost units follows the rules of each SRP. |
| | |
| | ※ The unit of electricity is kWh |
+------------------------------------------------------------------------------------------------------------------+------------------------------------------------------------------------------------------------------------------------------------------------------------------+
| (6) TOU Period(Super-peak,On-peak,Mid-peak,off-peak) | The system's default configuration is the normal period. To adjust, select the button and drag the mouse in the canvas until the desired time slot is selected. |
+------------------------------------------------------------------------------------------------------------------+------------------------------------------------------------------------------------------------------------------------------------------------------------------+
| After the above operations are completed, if other time periods need to be configured (such as non-summer months), click the "+" button in the upper right corner to add new, continue to repeat step 2, until all are added. |
| |
| 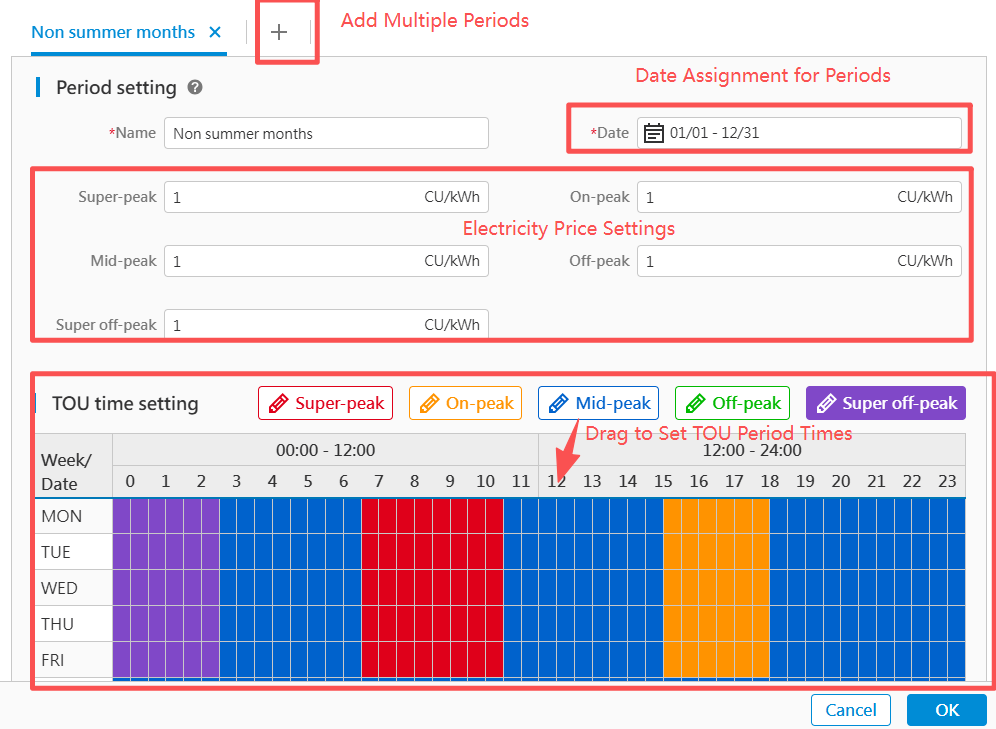 |
+-------------------------------------------------------------------------------------------------------------------------------------------------------------------------------------------------------------------------------------------------------------------------------------+
|
+-------------------------------------------------------------------------------------------------------------------------------------------------------------------------------------------------------------------------------------------------------------------------------------+
Once the TOU policy has been formulated, you must navigate to the "Task Deploy" module to synchronize the newly added policy information with the associated regions.
TOU Policy Edit
In the list list, select a TOU policy in a task, click "![]() "button, enter the TOU policy editing page. The operation steps on the editing page are the same as those for TOU policy formulation.
"button, enter the TOU policy editing page. The operation steps on the editing page are the same as those for TOU policy formulation.
After the peak-flat-valley policy changes, you must go to the "Task Deploy" module to synchronize the updated policy information to the associated areas.
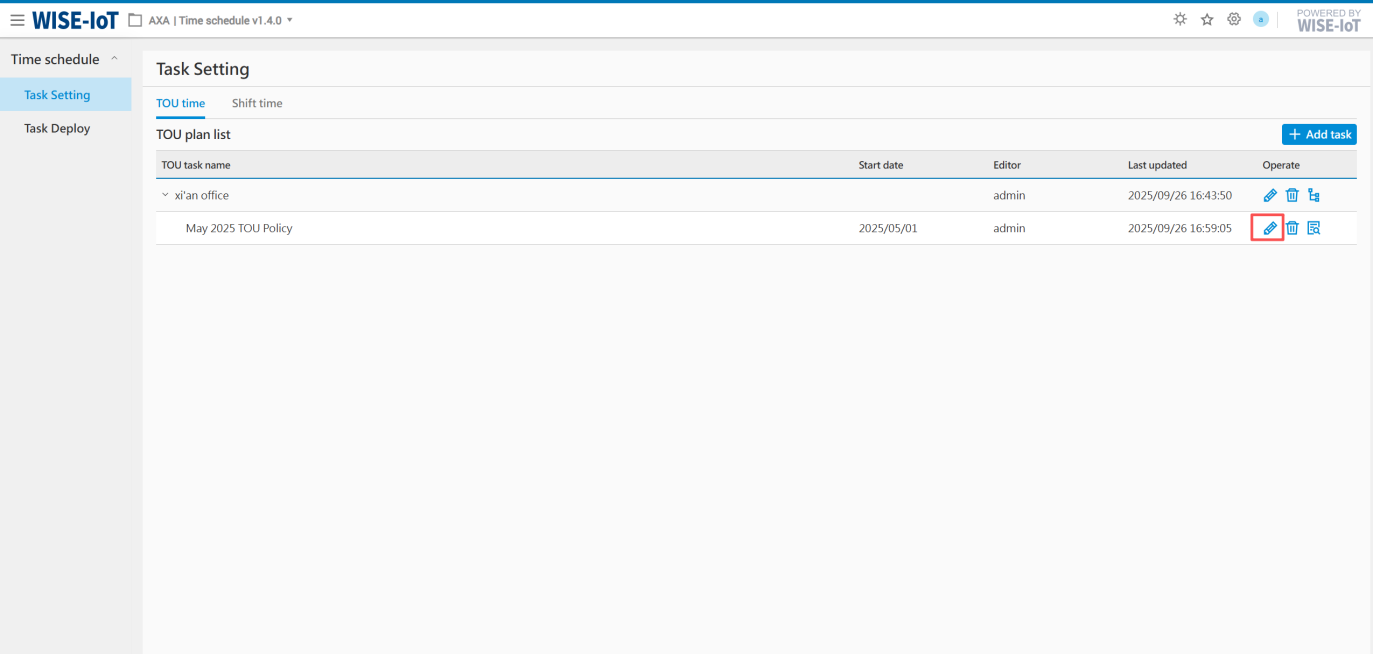
TOU Policy Delete
In the list, after selecting a Peak-Valley-Flat policy, click "![]() " button, can delete the corresponding policy information.
" button, can delete the corresponding policy information.

Or, use the "Delete all plans" option from the task's "![]() " button to remove all of its policies.
" button to remove all of its policies.
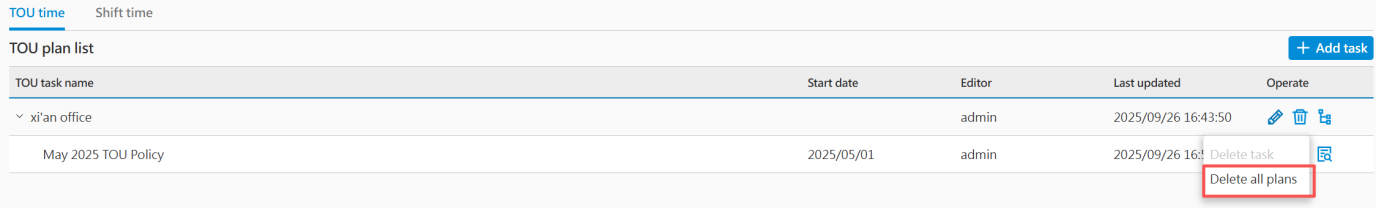
TOU Policy View
In the list, after selecting a TOU policy, click "![]() " button, for viewing formulated policy information.
" button, for viewing formulated policy information.
Delete Task
In the list, hover over a task row, click the "![]() " button, and select "Delete task" to remove it along with its associated policy information. Note: A task cannot be deleted if it has active TOU policies linked to it.
" button, and select "Delete task" to remove it along with its associated policy information. Note: A task cannot be deleted if it has active TOU policies linked to it.
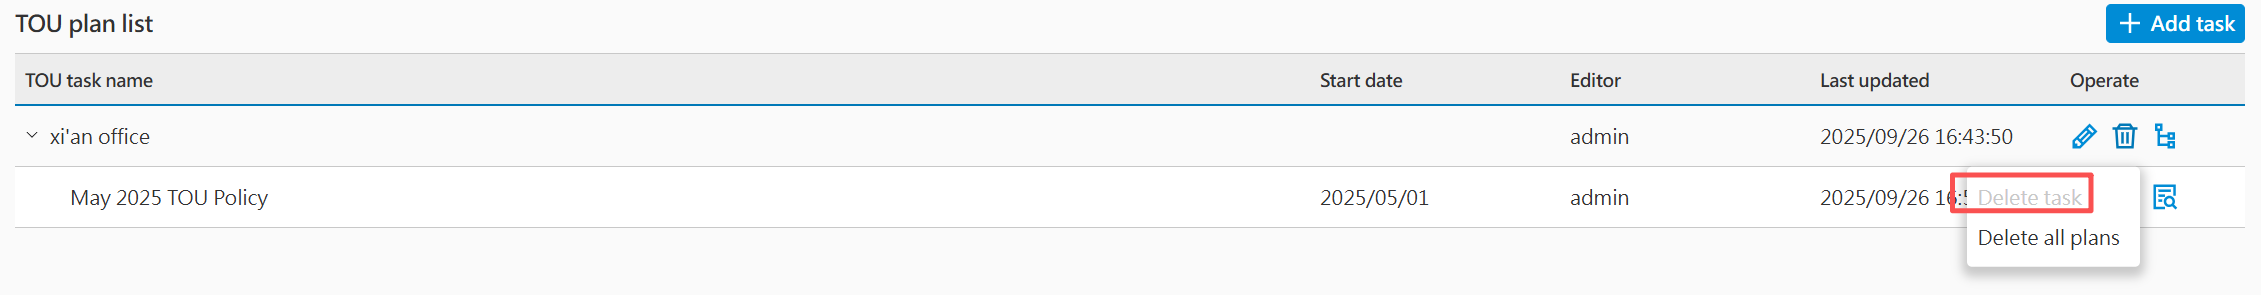
Shift Time Settings
Click Time Schedule>>Task setting>>Select the "Shift Time" tab, Enter Shift time Configuration Page。
The overall configuration process is as follows:
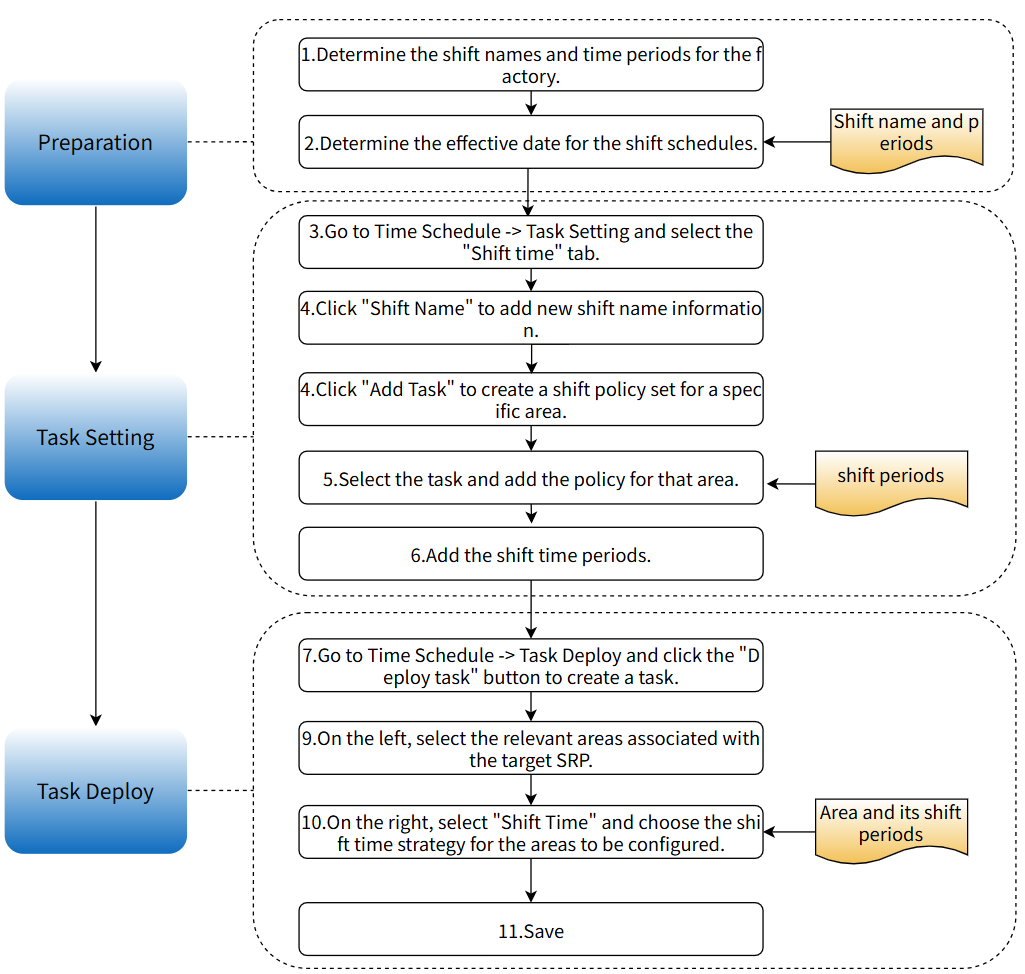
Shift Time List
The initial page is empty, first you need to click "Shift Name" to confirm the shift name information, such as Day Shift, Night Shift, as shown in the figure below:
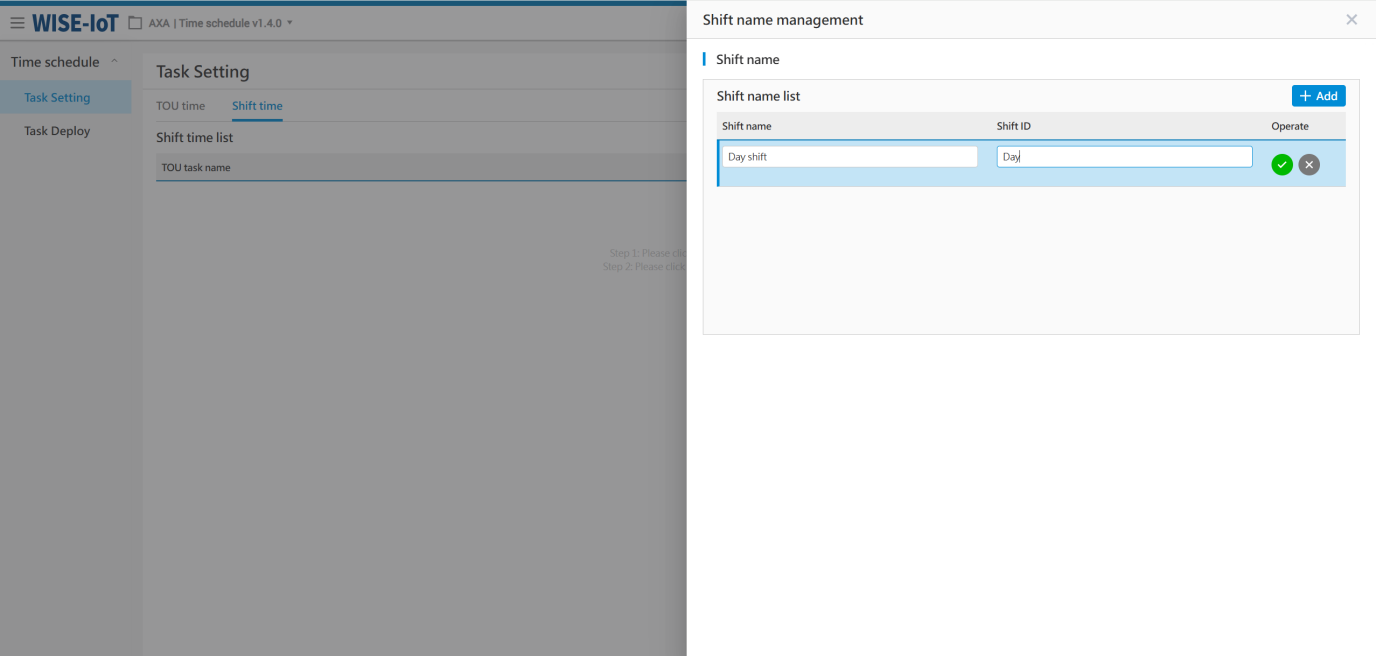
After adding the shift name information, the "Add Task" button is needed to formulate a shift strategy set for a specific region or area. For example, Kunshan Factory can use Kunshan as a task, serving as the shift policy set for the Kunshan region; Xi'an Office can use Xi'an as a task, serving as the shift policy set for the Xi'an region, as shown in the figure below:
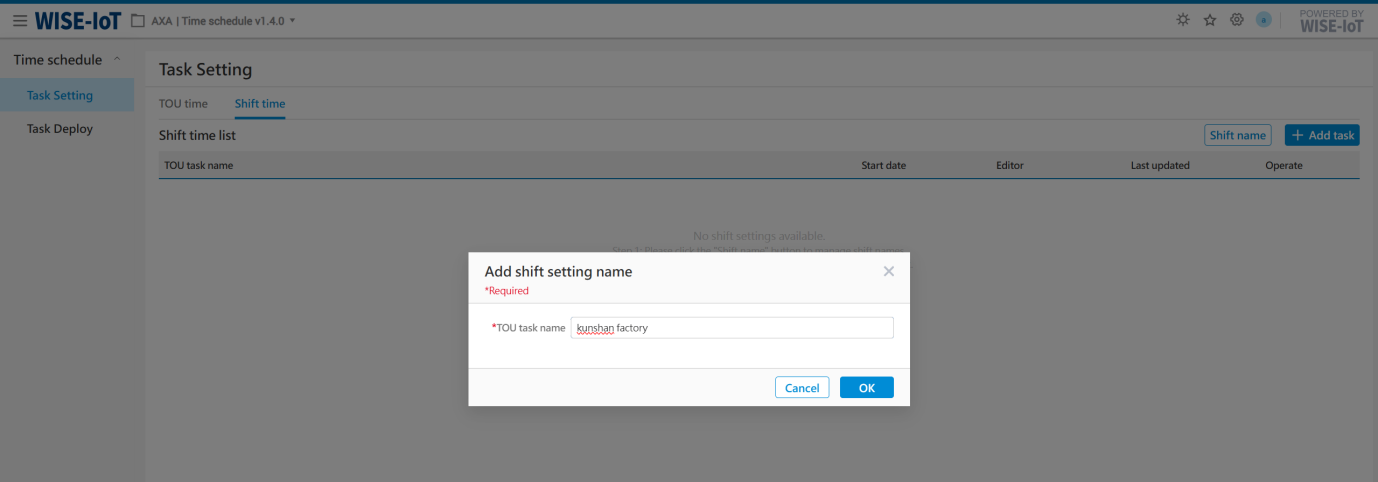
After creating the task, the system will display the information of the newly created task, as shown in the figure below:
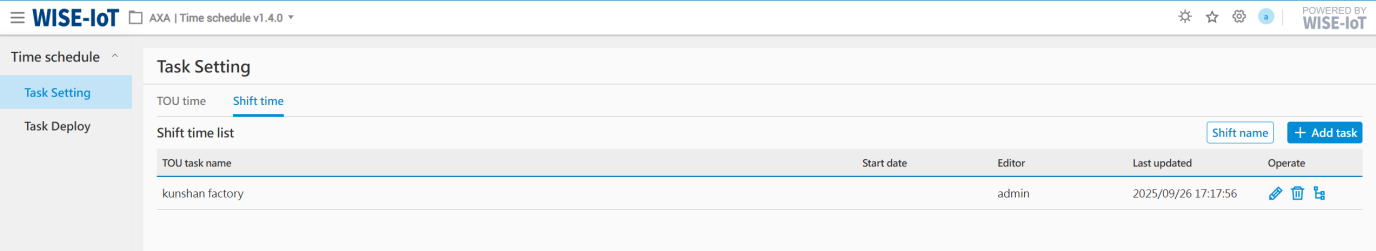
In the list page:
-
A region can add up to 12 new policies.
-
Allow modification and deletion of policies;
-
Adding, editing, and deleting are permission-restricted. If users need to perform add, edit, or delete operations, please contact your local administrator for permission configuration.
Shift Policy Add
In the list list, select a task (e.g.,kunshan factory ), click "![]() " button, enter the new shift strategy page for this area. The content and steps are as follows:
" button, enter the new shift strategy page for this area. The content and steps are as follows:
+--------------------------------------------------------------------------------------------------------------------+----------------------------------------------------------------------------------------------------------------------------------------------------------------------------+
| Step 1: Shift policy setting |
+--------------------------------------------------------------------------------------------------------------------+----------------------------------------------------------------------------------------------------------------------------------------------------------------------------+
| Basic Information | Enter the policy name (e.g., Chongqing Juice Online shift Time), and set the effective date of the new policy. |
+--------------------------------------------------------------------------------------------------------------------+----------------------------------------------------------------------------------------------------------------------------------------------------------------------------+
| Next, configure the time periods for the new policy. |
+-------------------------------------------------------------------------------------------------------------------------------------------------------------------------------------------------------------------------------------------------------------------------------------------------+
| 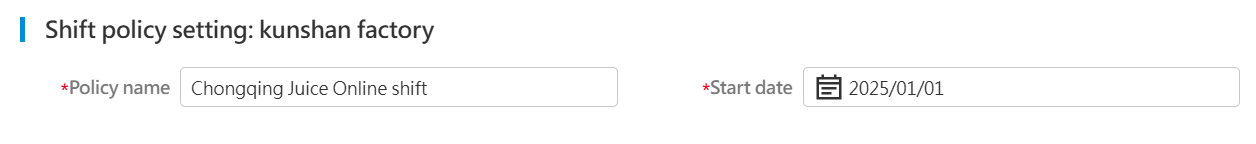 |
+-------------------------------------------------------------------------------------------------------------------------------------------------------------------------------------------------------------------------------------------------------------------------------------------------+
| Step 2, Applicable cycle Settings |
+--------------------------------------------------------------------------------------------------------------------+----------------------------------------------------------------------------------------------------------------------------------------------------------------------------+
| (1) Time period | Enter cycle name, e.g., full shift period. |
+--------------------------------------------------------------------------------------------------------------------+----------------------------------------------------------------------------------------------------------------------------------------------------------------------------+
| (2) Applicable cycle | Select the date corresponding to this period |
| | |
| | 1) A date is only allowed to appear in one time slot; |
| | |
| | 2) Allow adding multiple dates; |
| | |
| |
|
+-------------------------------------------------------------------------------------------------------------------------------------------------------------------------------------------------------------------------------------------------------------------------------------------------+
| Step 2, Applicable cycle Settings |
+--------------------------------------------------------------------------------------------------------------------+----------------------------------------------------------------------------------------------------------------------------------------------------------------------------+
| (1) Time period | Enter cycle name, e.g., full shift period. |
+--------------------------------------------------------------------------------------------------------------------+----------------------------------------------------------------------------------------------------------------------------------------------------------------------------+
| (2) Applicable cycle | Select the date corresponding to this period |
| | |
| | 1) A date is only allowed to appear in one time slot; |
| | |
| | 2) Allow adding multiple dates; |
| | |
| | 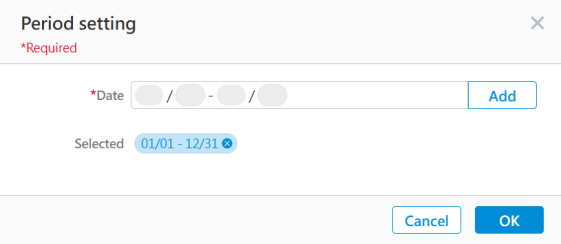 |
+--------------------------------------------------------------------------------------------------------------------+----------------------------------------------------------------------------------------------------------------------------------------------------------------------------+
| (3) Shift time list | Click the Add button to add the time range for each shift |
| | |
| |
|
+--------------------------------------------------------------------------------------------------------------------+----------------------------------------------------------------------------------------------------------------------------------------------------------------------------+
| (3) Shift time list | Click the Add button to add the time range for each shift |
| | |
| | 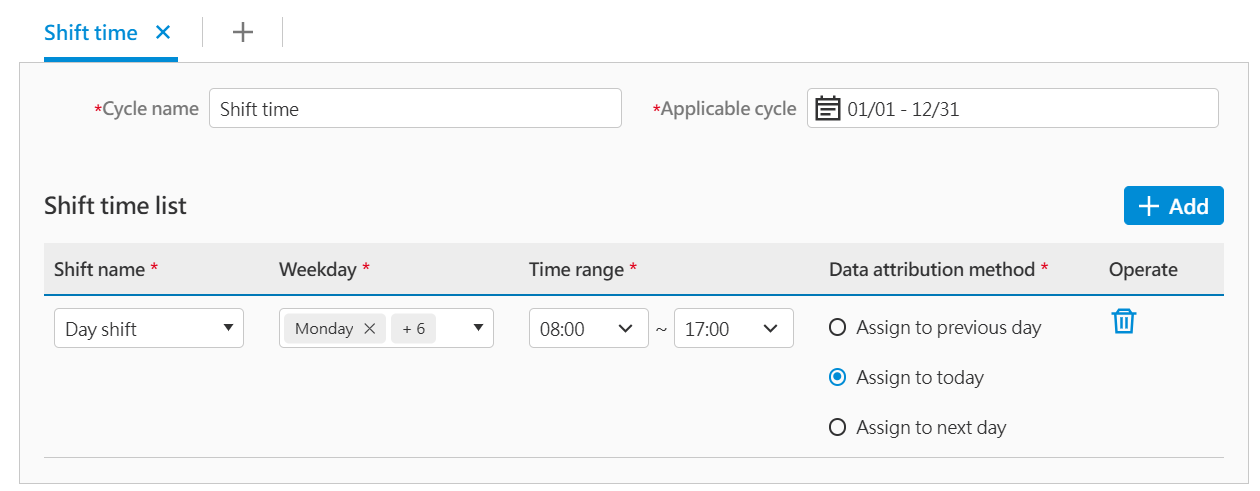 |
| | |
| | 1) Shift Name: The name created in the previous section.; |
| | |
| | 2) Weekday: Select according to the actual situation. If days of the week are not distinguished, the default is Monday to Sunday; |
| | |
| | 3) Time range: Daily time ranges are not allowed to overlap, please set them correctly; |
| | |
| | 4) Data attribution method: According to the factory shift consumption attribution arrangement, it can be assigned to the previous day, the current day, or the next day. |
+--------------------------------------------------------------------------------------------------------------------+----------------------------------------------------------------------------------------------------------------------------------------------------------------------------+
| After completing the above operations, if you need to configure other periods (e.g., summer months), click the "+" button in the upper right corner to add a new one, continue to repeat step 2 until all additions are complete. |
| |
|
|
| | |
| | 1) Shift Name: The name created in the previous section.; |
| | |
| | 2) Weekday: Select according to the actual situation. If days of the week are not distinguished, the default is Monday to Sunday; |
| | |
| | 3) Time range: Daily time ranges are not allowed to overlap, please set them correctly; |
| | |
| | 4) Data attribution method: According to the factory shift consumption attribution arrangement, it can be assigned to the previous day, the current day, or the next day. |
+--------------------------------------------------------------------------------------------------------------------+----------------------------------------------------------------------------------------------------------------------------------------------------------------------------+
| After completing the above operations, if you need to configure other periods (e.g., summer months), click the "+" button in the upper right corner to add a new one, continue to repeat step 2 until all additions are complete. |
| |
| 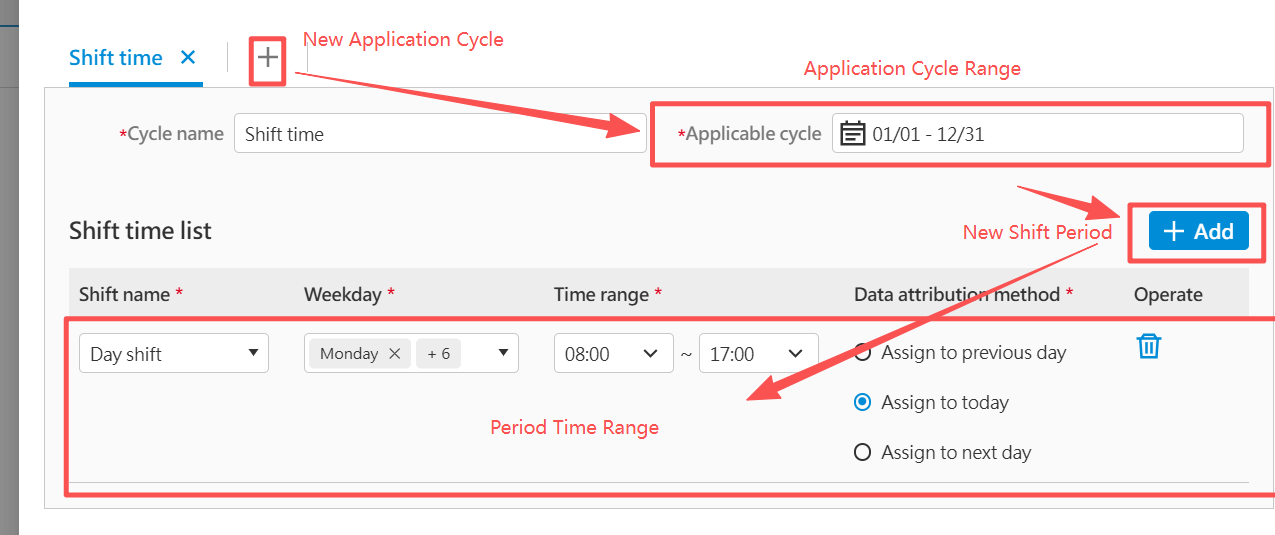 |
+-------------------------------------------------------------------------------------------------------------------------------------------------------------------------------------------------------------------------------------------------------------------------------------------------+
|
+-------------------------------------------------------------------------------------------------------------------------------------------------------------------------------------------------------------------------------------------------------------------------------------------------+
Once the shift policy has been formulated, you must navigate to the "Task Deploy" module to synchronize the newly added policy information to the associated areas.
Shift Policy Edit
In the list, select a shift policy in a certain task, Click the "![]() "button to enter the shift policy editing page. The operating steps on the editing page are the same as those for formulating shift policies.
"button to enter the shift policy editing page. The operating steps on the editing page are the same as those for formulating shift policies.
After the shift policy is changed, you must navigate to the "Task Deploy" module to synchronize the updated policy information to the associated regions.
Shift Policy Delete
In the list, after selecting a shift policy, click "![]() " button, can delete the corresponding policy information.
" button, can delete the corresponding policy information.
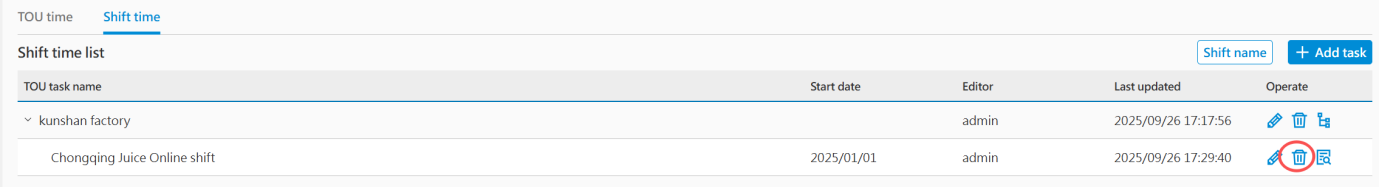
Or, use the "Delete all polices" option from the task's "![]() " button to remove all of its policies.
" button to remove all of its policies.
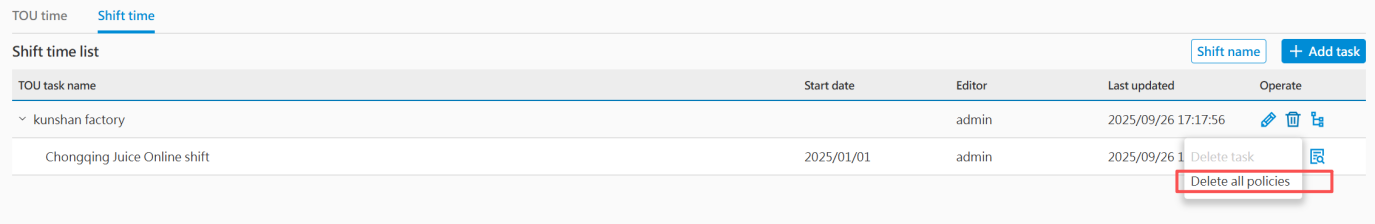
Shift Policy View
After selecting a shift policy in the list list, click "![]() " button, to view the formulated policy information.
" button, to view the formulated policy information.
Task Delete
In the list, hover over a task row, click the "![]() " button, and select "Delete task" to remove it along with its associated policy information. Note: A task cannot be deleted if it has active shift policies linked to it.
" button, and select "Delete task" to remove it along with its associated policy information. Note: A task cannot be deleted if it has active shift policies linked to it.
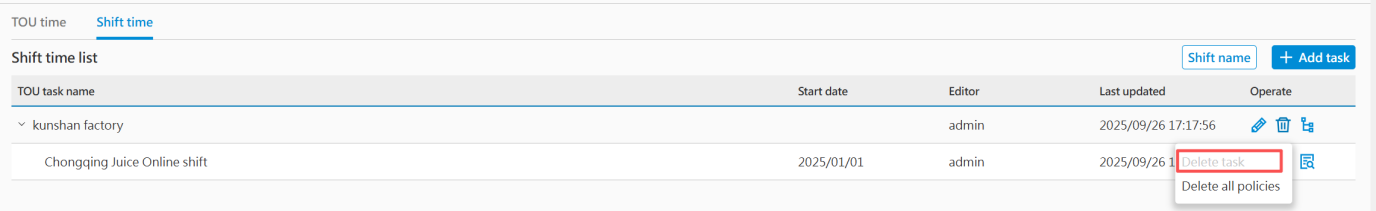
Task Deploy
Click Time Schedule>>Task Deploy, Enter Time Task deploy Page.
Time Task Deployment List
The initial page is empty. You need to click the "Deploy task" button to synchronize the TOU time and shift time to the associated areas, as shown in the figure below:
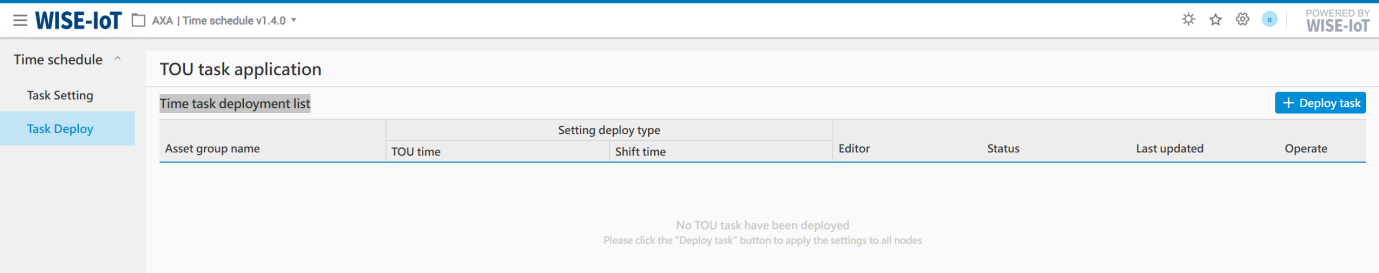
In the list page:
-
The most recently assigned task records are displayed at the top;
-
Click "
 " button, to view detailed information on issued items.
Deploy Task Configuration
In the list, click the "Deploy task" button to enter the policy distribution page. The operating steps are as follows:
+-------------------------------------------------------------------------+-------------------------------------------------------------------------------------------------------------------------------------------------------------------------------------+
| Step 1: On the left, select the policy association area |
+-------------------------------------------------------------------------+-------------------------------------------------------------------------------------------------------------------------------------------------------------------------------------+
| Project Selection | First, select the SRP and project for this release. For example: if configuring regional shift information for ECOWatch products, then select "ECOWatch". |
| | |
| | ※ Here are displayed all items in APM, users please choose according to their needs. |
+-------------------------------------------------------------------------+-------------------------------------------------------------------------------------------------------------------------------------------------------------------------------------+
| Area selection | Select policy application area |
| | |
| | ※ECOWatch includes business asset groups and meter asset groups. If configuring shift information for the same region, it is necessary to select the topologies of both categories. |
| | |
| | ※ Other SRP business nodes, just select normally. |
+-------------------------------------------------------------------------+-------------------------------------------------------------------------------------------------------------------------------------------------------------------------------------+
| Once the above operations are complete, proceed to step 2. |
+---------------------------------------------------------------------------------------------------------------------------------------------------------------------------------------------------------------------------------------------------------------+
| 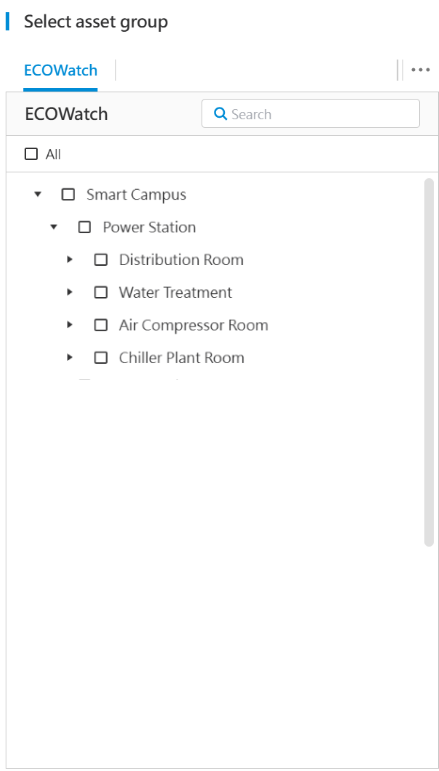 |
+---------------------------------------------------------------------------------------------------------------------------------------------------------------------------------------------------------------------------------------------------------------+
| Step 2, select TOU time or Shift time |
+-------------------------------------------------------------------------+-------------------------------------------------------------------------------------------------------------------------------------------------------------------------------------+
| Shift task | 1) Click the "Shift Time"tab, first, click the "Undeploy"switch on the right, turn on the switch, indicating that shift tasks will be sent this time. |
| | |
| | 2) Secondly, select the task assigned this time. For example, if "xi'an office" was added in the time task settings module, then select the task; |
| | |
| | The dispatch process for Shift Time follows the same steps as for the TOU Time. |
+-------------------------------------------------------------------------+-------------------------------------------------------------------------------------------------------------------------------------------------------------------------------------+
| After completing the above operations, click the "OK" button. The system will automatically apply the selected tasks to the selected areas. |
| |
|
|
+---------------------------------------------------------------------------------------------------------------------------------------------------------------------------------------------------------------------------------------------------------------+
| Step 2, select TOU time or Shift time |
+-------------------------------------------------------------------------+-------------------------------------------------------------------------------------------------------------------------------------------------------------------------------------+
| Shift task | 1) Click the "Shift Time"tab, first, click the "Undeploy"switch on the right, turn on the switch, indicating that shift tasks will be sent this time. |
| | |
| | 2) Secondly, select the task assigned this time. For example, if "xi'an office" was added in the time task settings module, then select the task; |
| | |
| | The dispatch process for Shift Time follows the same steps as for the TOU Time. |
+-------------------------------------------------------------------------+-------------------------------------------------------------------------------------------------------------------------------------------------------------------------------------+
| After completing the above operations, click the "OK" button. The system will automatically apply the selected tasks to the selected areas. |
| |
| 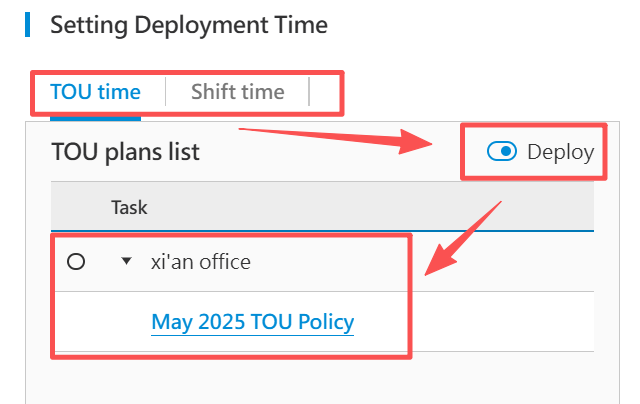 |
+---------------------------------------------------------------------------------------------------------------------------------------------------------------------------------------------------------------------------------------------------------------+
|
+---------------------------------------------------------------------------------------------------------------------------------------------------------------------------------------------------------------------------------------------------------------+
Deployed Task Records
In the list, select a task to be distributed, click "![]() " button, enter the issuance record details viewing page.
" button, enter the issuance record details viewing page.
MessagePush
Introduction
MessagePush is responsible for the delivery of messages such as alerts, meter reading reports, and health examination reports. This document provides operational instructions to help users master the standard implementation procedures of the MessagePush platform, enabling them to quickly set up and configure notification groups and personnel for receiving system-pushed notifications.
Login Message Push Notification Platform
Message The Push platform does not have a standalone entry point.
User usage WISE-iEMS platform, in iEMS at [System Settings-Alarm Settings] and at [System Settings-Quota Management-Alarm Configuration], there is an "Add Group" button. Clicking this button, you can directly access Message Push platform.
Enter Message After the Push platform, click the "+" button in the upper right corner to create a message push method, as shown in the figure below. The system provides 4 message push methods:
-
Email: Support QQ Mail, 126 Mail, Gmail, Aliyun Mail and custom email. If you need to send attachments, it is recommended to use Email.
-
Enterprise WeChat: After an event is triggered, messages are automatically pushed to Enterprise WeChat groups.
-
DingTalk: After the event is triggered, messages are automatically pushed to the DingTalk group.
-
Webhook: After the event is triggered, messages are automatically pushed to the third-party interface.
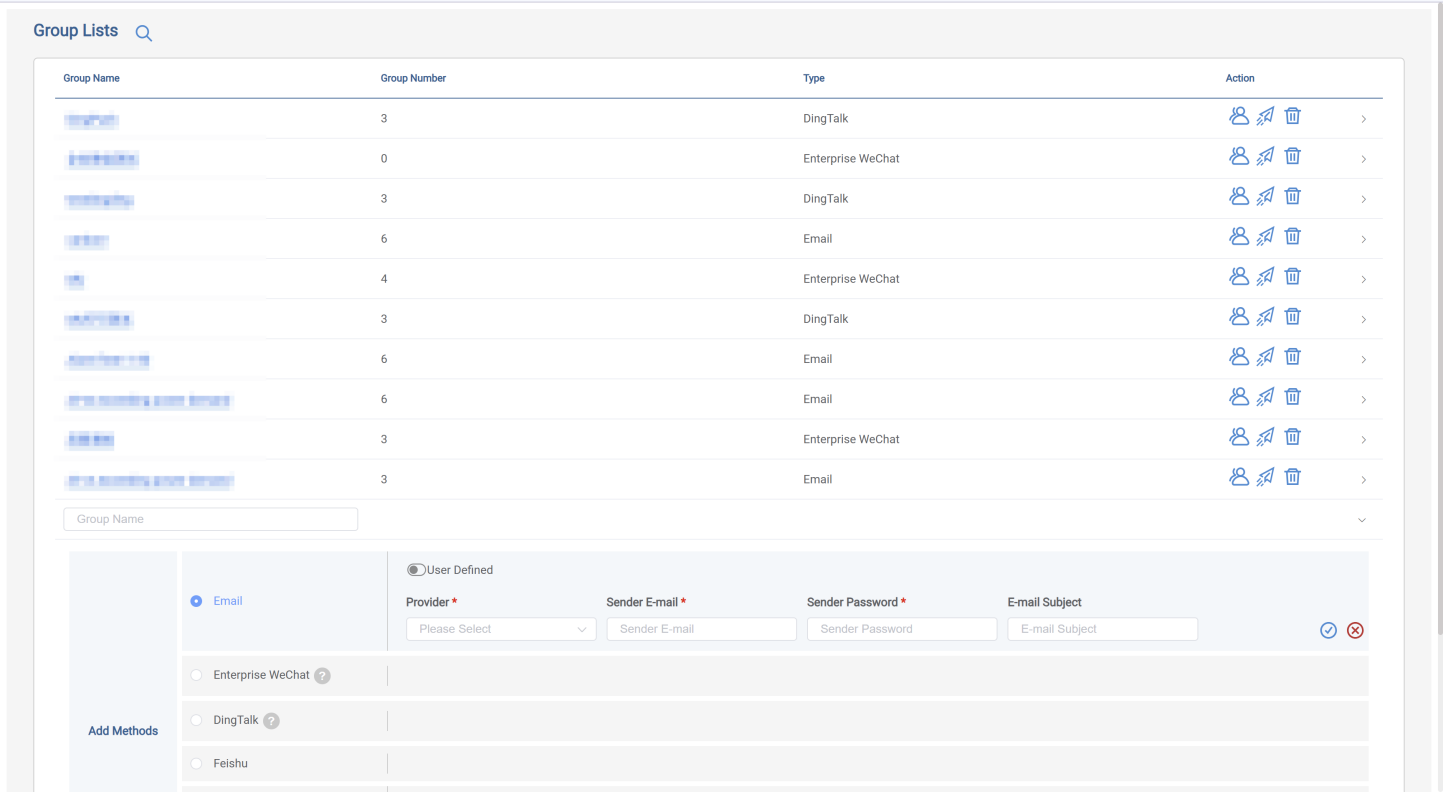
Email Configuration
Enter Message Push After the platform, click the "+" button in the upper right corner, select "Email", the system provides QQ Mail, 126 Mail, Gmail, Aliyun Mail.
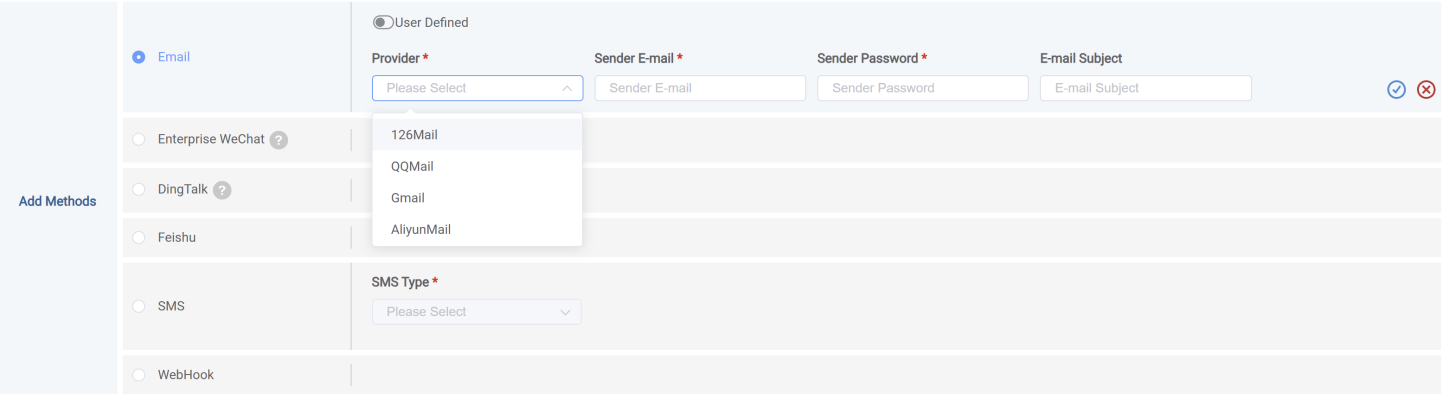
Notification Method Configuration
QQ Mail Configuration
QQ Mail configuration requires the following information:
-
supplier: Select "QQ Mail"
-
Sender email: Select QQ sender's email address, e.g.: example@qq.com
-
Sender password: Go to the sender's QQ mailbox, and get the email authorization code by following the link below (i.e. Message Push needed "Sender Password")
-
Note: In the operation steps, enable service and select "POP3/SMTP" Service
- Email subject: Sent email subject text content, optional.
After configuration is complete, click "Save" can be found above. Group List View the configured information.
126 Mail Configuration
126 Mail Configuration requires the following information:
-
Supplier: Select "126 Mail"
-
Sender's email: Select 126 sender's email address, such as:
example@126.com -
Sender password: Access the sender's 126 mailbox, get the mailbox authorization code by following the link below (i.e., Message Push needed "Sender password")
-
126 Mail App Password Tutorial:
https://help.mail.163.com/faqDetail.do?code=d7a5dc8471cd0c0e8b4b8f4f8e49998b374173cfe9171305fa1ce630d7f67ac286624f309a1a7089 -
Note: In the operation steps, enable service and select "POP3/SMTP" Service.
- Email Subject: Text content of the sent email subject, optional.
After the configuration is complete, click "Save" can be in the upper part of Group List View configured information.
Aliyun Mail
Aliyun mail configuration requires the following information:
-
Supplier: Select "Aliyun Mail"
-
Sender email: Select Aliyun sender email address, e.g.:
example@aliyun.com -
Sender password: Access the sender's Aliyun Mail, and obtain the mailbox authorization code following the link below (i.e. Message Push needed "Sender Password")
Alibaba Cloud Email Authorization Code Operation Tutorial:
https://www.mail-aliyun.cn/news/zhinan/209.html
- Email Subject: Sent email subject text content, optional.
After configuration is complete, click "![]() " to save in the above's Group List view configured information.
" to save in the above's Group List view configured information.
Gmail configuration
Gmail configuration requires the following information:
-
Supplier: Select "Gmail"
-
Sender email: Select Gmail sender's email address, such as:
example@gmail.com -
Sender password: Access the sender's Gmail mailbox, and obtain the email authorization code via the following link (i.e. Message Push needed "Sender password")
Gmail App Password Tutorial:
https://support.google.com/mail/answer/185833
- Email Subject: Sent email subject text content, optional
After configuration is complete, click "
" to save in the upper part of the Group list view the configured information.
Custom email
If the above 4 types of email push method do not meet requirements, click "User Defined", you can then customize the email settings. You need to fill in the following information, where * represents a required field.
After filling it out, click "![]() " to Save, you can view the configured information in the list above."
" to Save, you can view the configured information in the list above."

Group Member
After the message notification method is created, notification personnel information needs to be added. The operating steps are as follows:
- In Group list select from Email Notification method type, click the "
 " button on the right side, enter the personnel adding page.
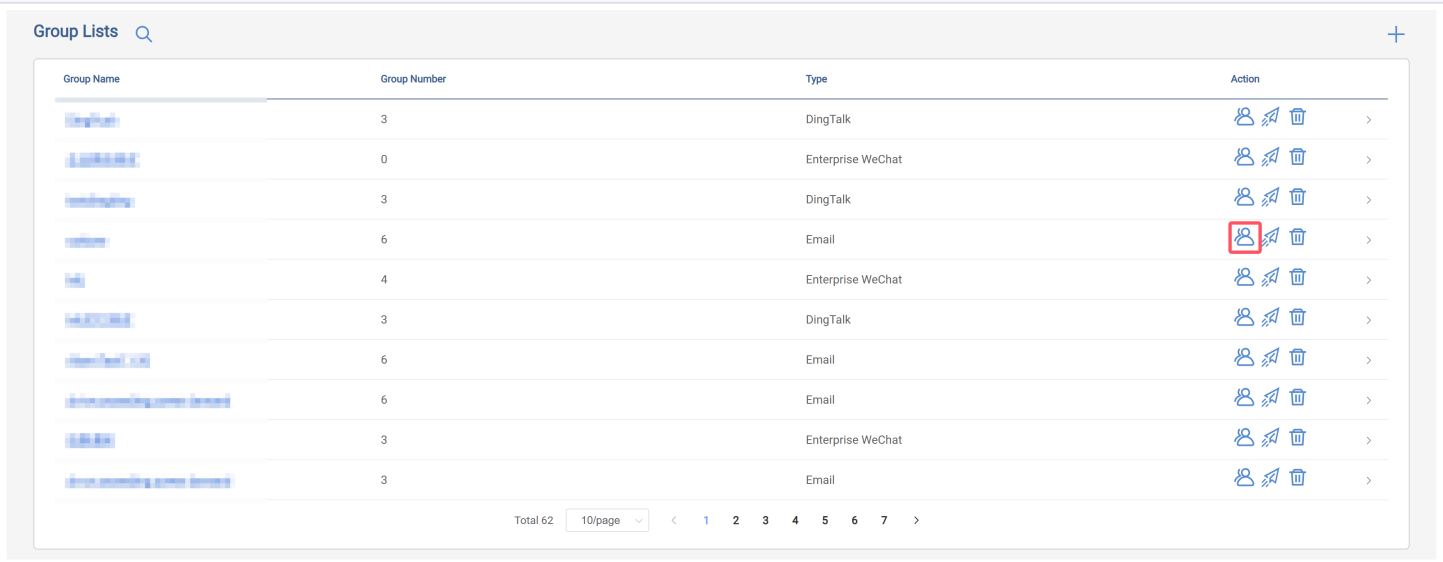
- Email Category personnel addition, need to fill in the following information:
-
group member: i.e., fill in the name
-
Email: Enter the recipient's email address
-
Shipping method: i.e., email reception method, including To, BCC, CC
You can add multiple personnel details here. After each addition or edit, you need to click "
" to save.
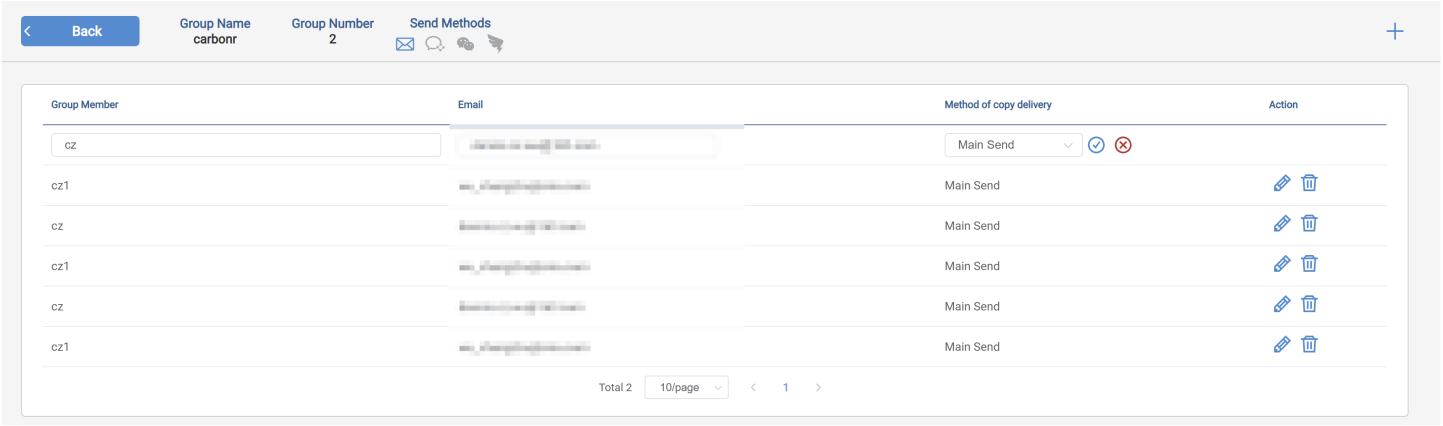
Enterprise WeChat Notification Configuration
Notification method configuration
Enter Message Push on the platform, click the "+" button in the upper right corner, select "Enterprise WeChat", and save, as shown in the figure below.
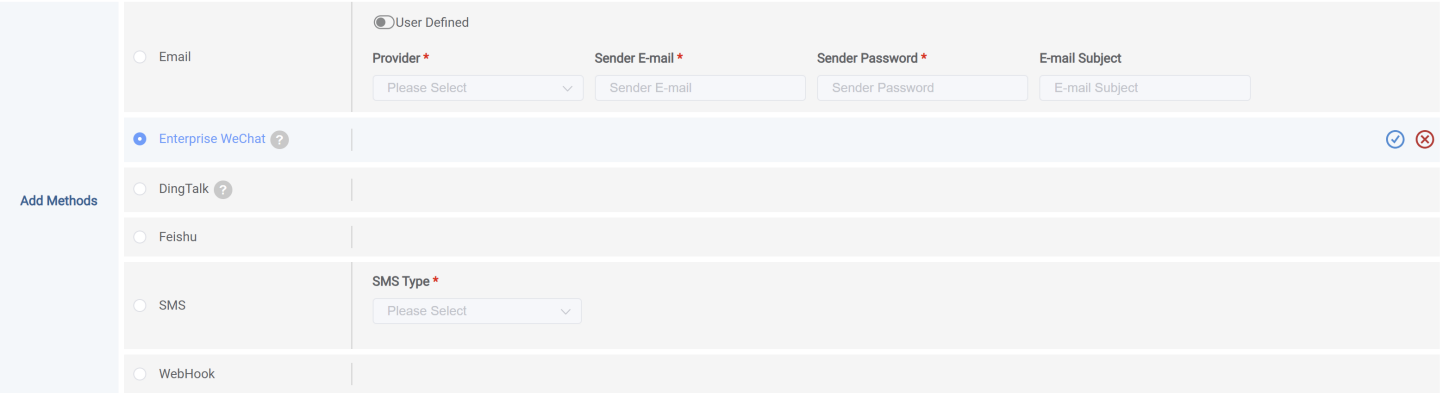
Notification Group Configuration
After the message notification method is created, notification group information needs to be added. The operation steps are as follows:
- At Group List Select Enterprise WeChat notification method, click on the right side of the "" button, enter personnel addition page.
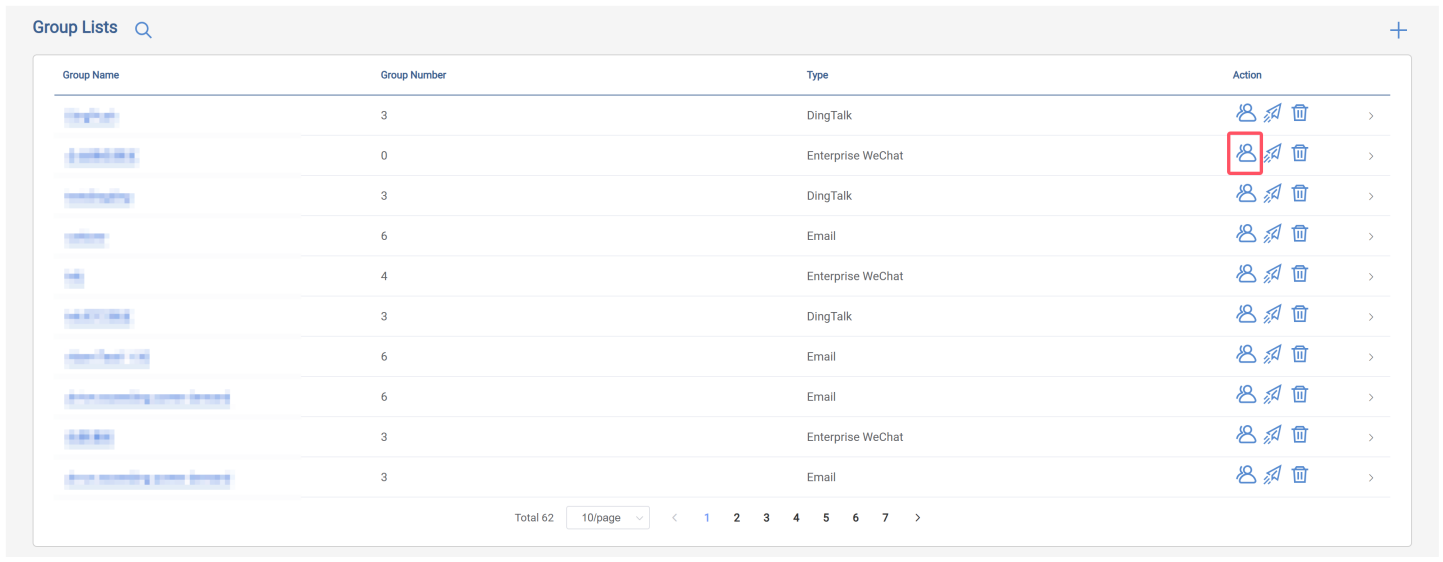
- Enterprise WeChat Existing personnel group information, fill in WeChat Group Webhook URL. Please fill in the following information:
-
Group member: i.e., enter the name
-
Webhook URL: Input Enterprise WeChat Group Webhook URL, the steps to obtain a URL are as follows:
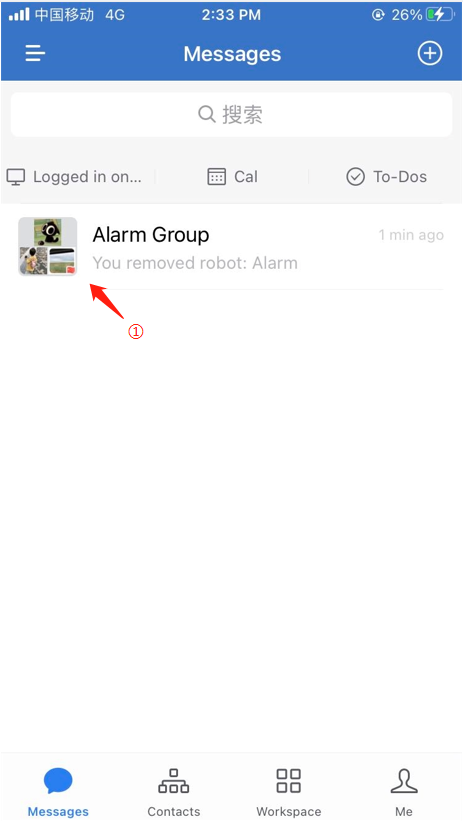
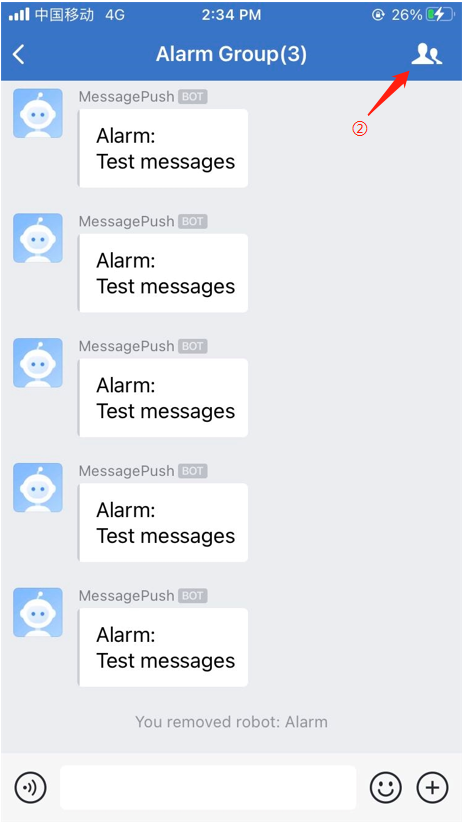


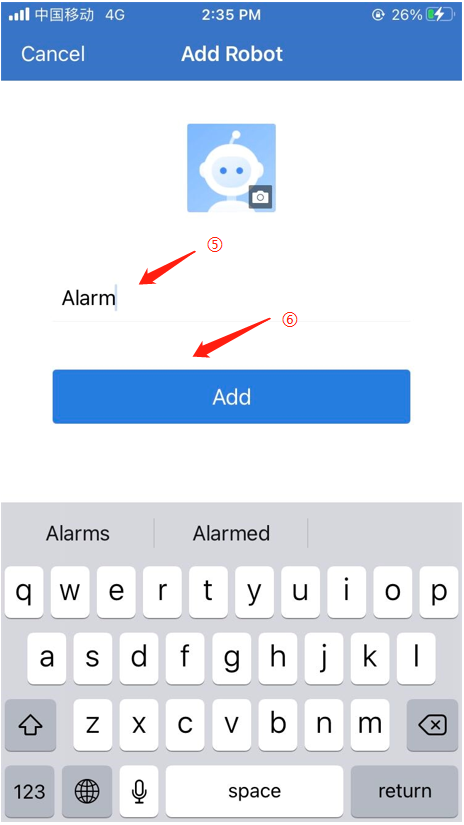
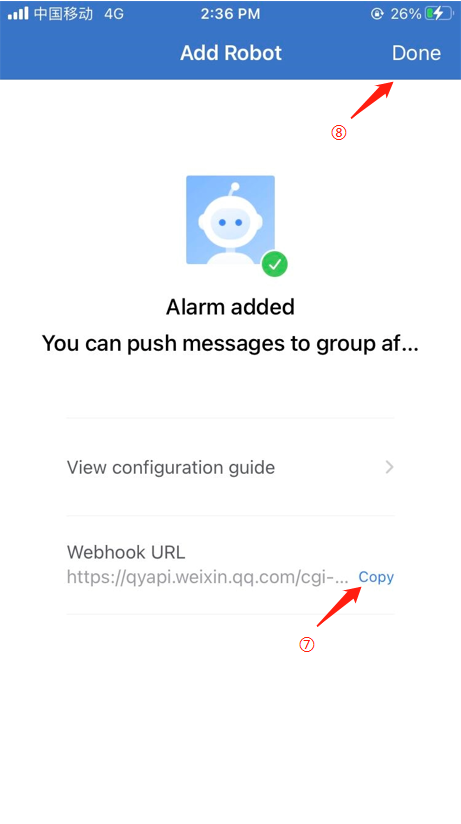
Multiple groups can be added here, and after each addition or edit, you need to click "
DingTalk Notification Configuration
Notification Method Configuration
Enter Message Push on the platform, click the "+" button in the upper right corner, select "DingTalk", and save, as shown in the figure below.
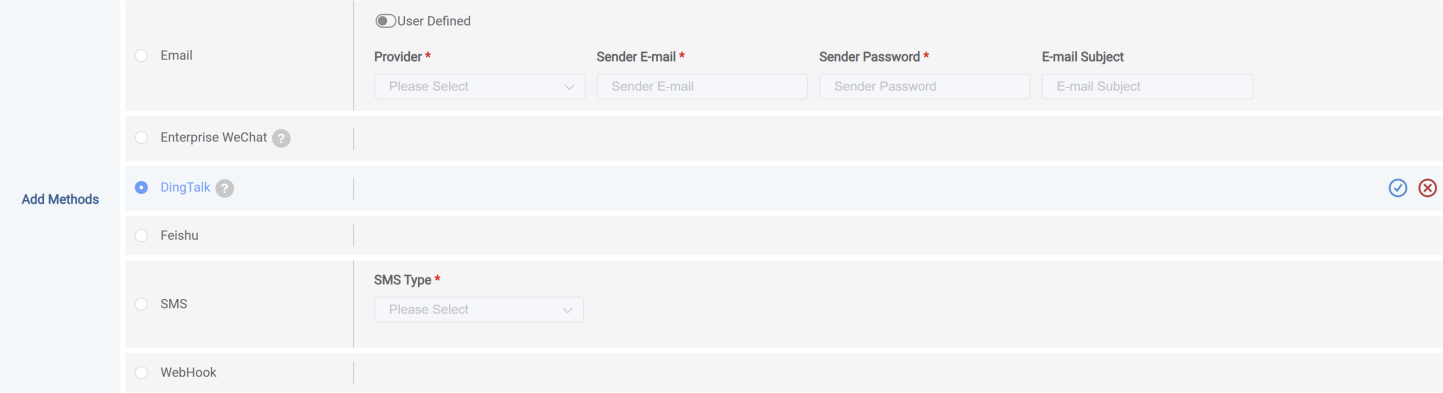
Notification Group Configuration
Once DingTalk the message notification method has been created, you need to add notification personnel information. The operating steps are as follows:
- At Group List select DingTalk notification method, click the right side of the "button", enter the personnel addition page.
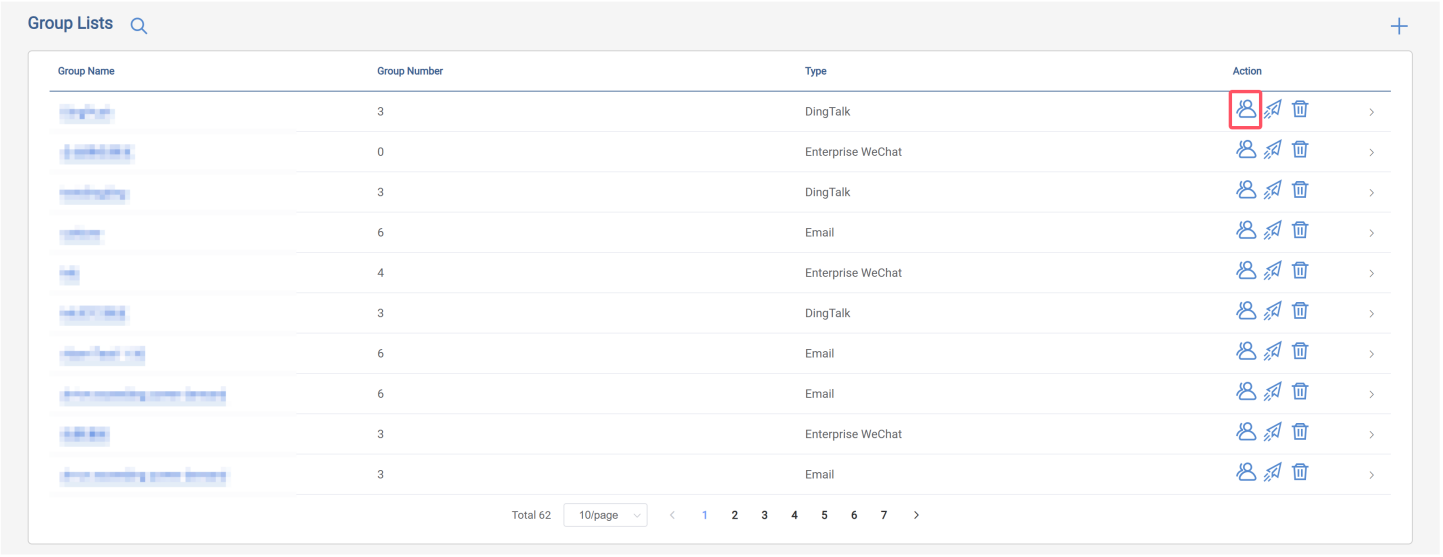
- DingTalk already has staff group information, filling in the DingTalk group's Webhook URL and Secret. You need to fill in the following information:
-
Group members: i.e., fill in the name
-
WebHook URL and Secret: Input DingTalk Group's Webhook URL and Secret, the operating steps to obtain these two pieces of information are as follows:
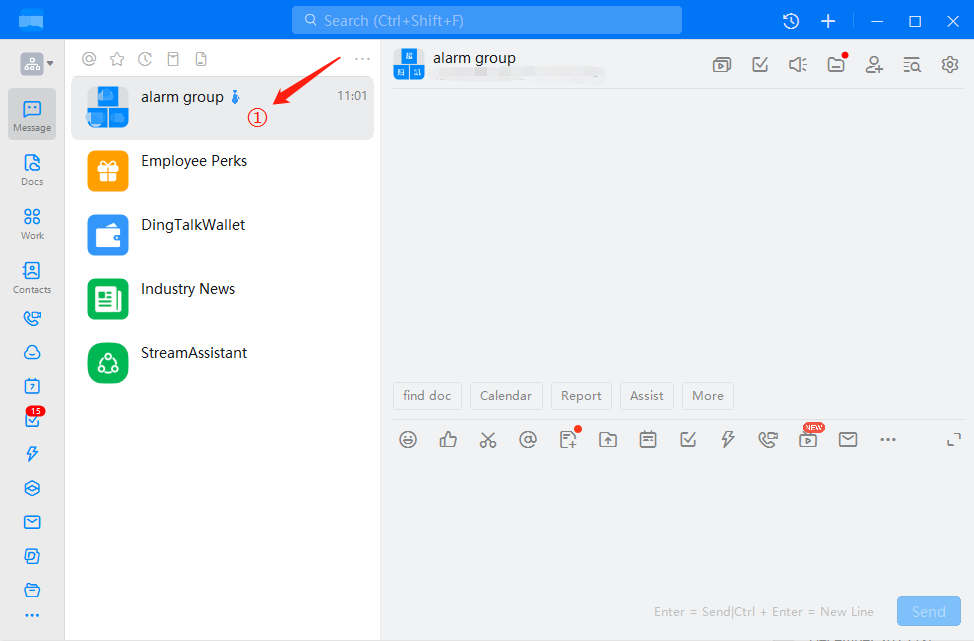
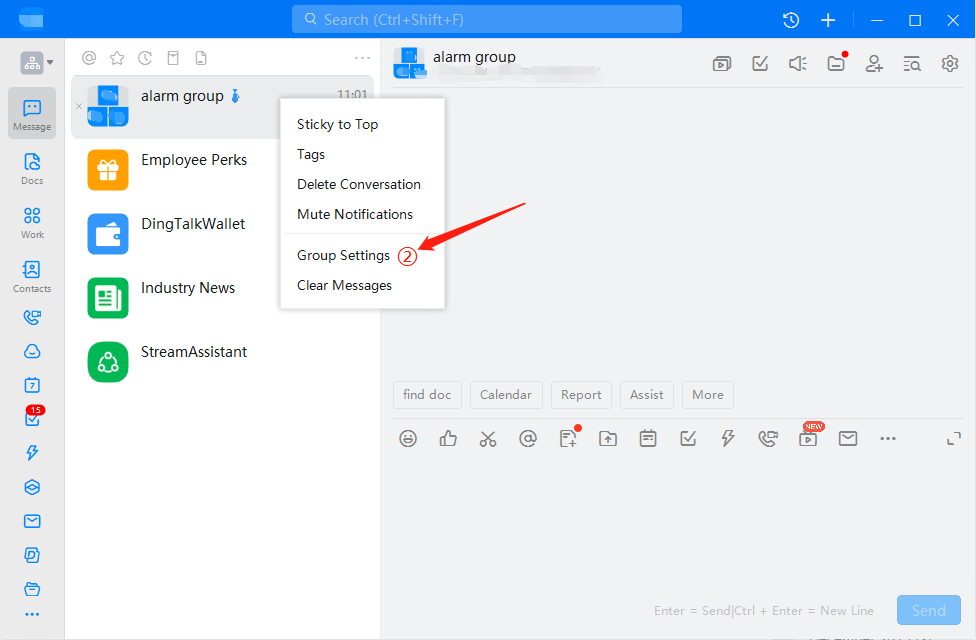
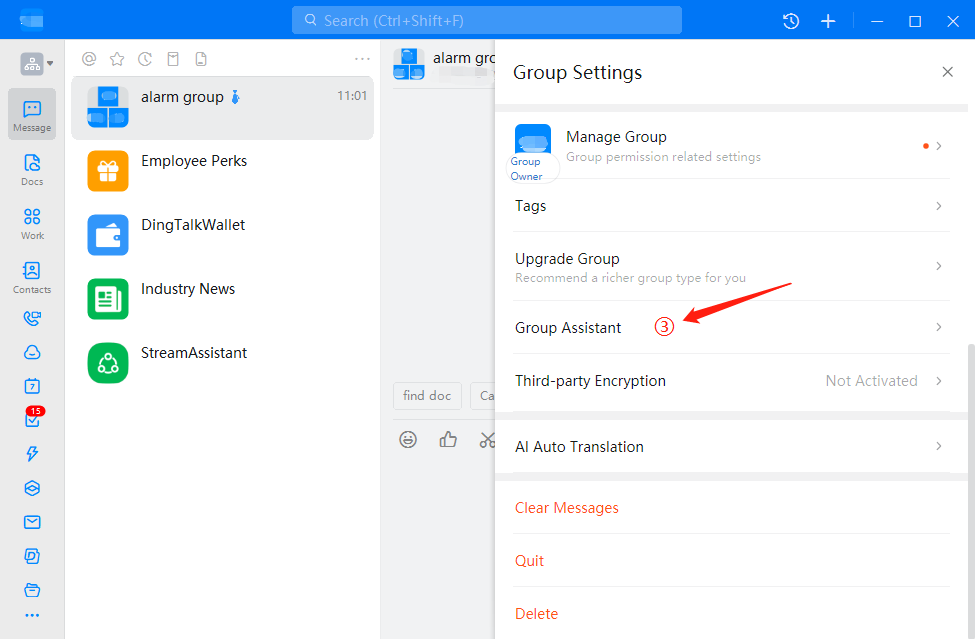
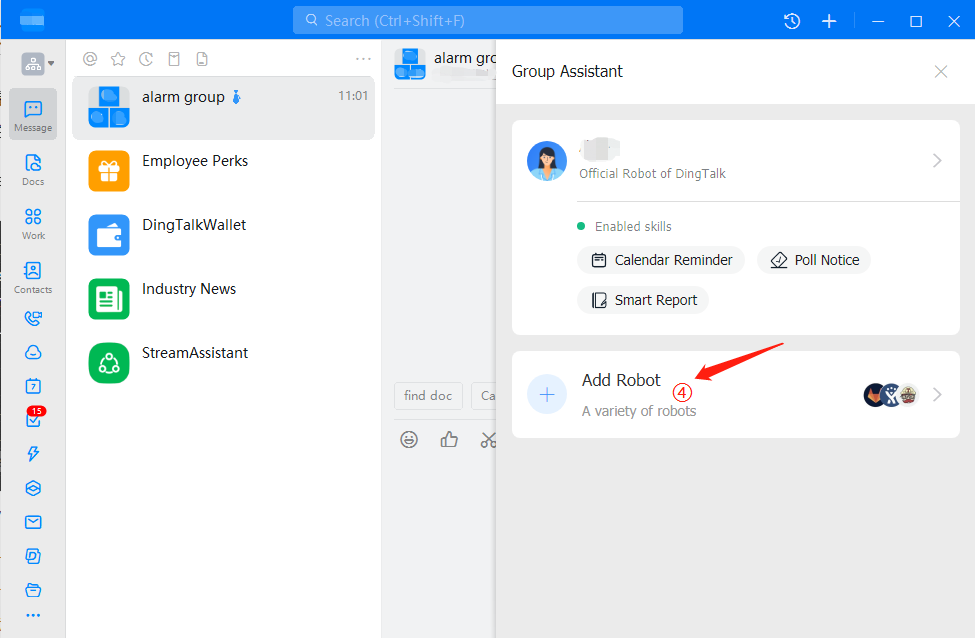
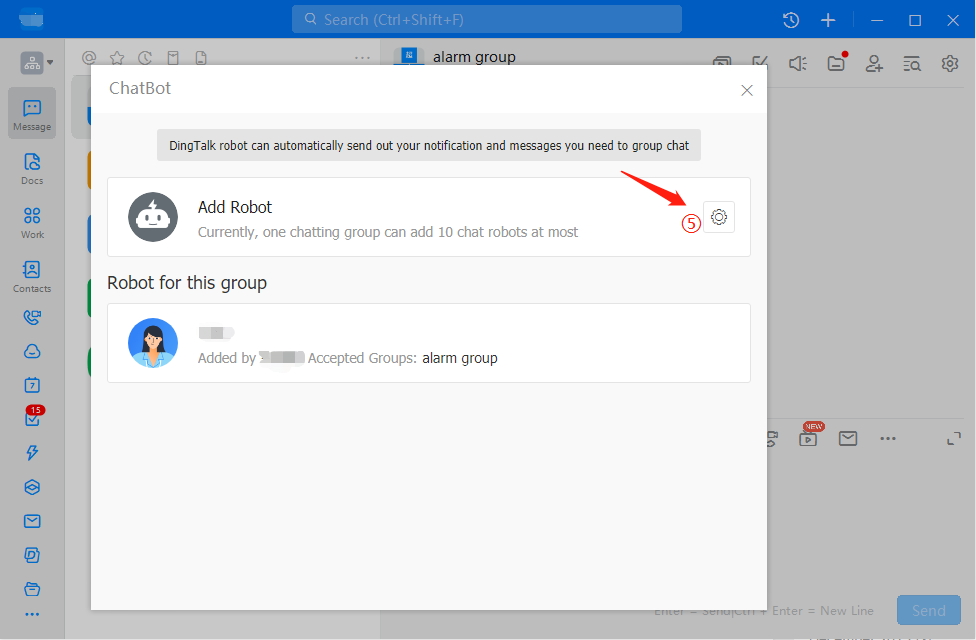
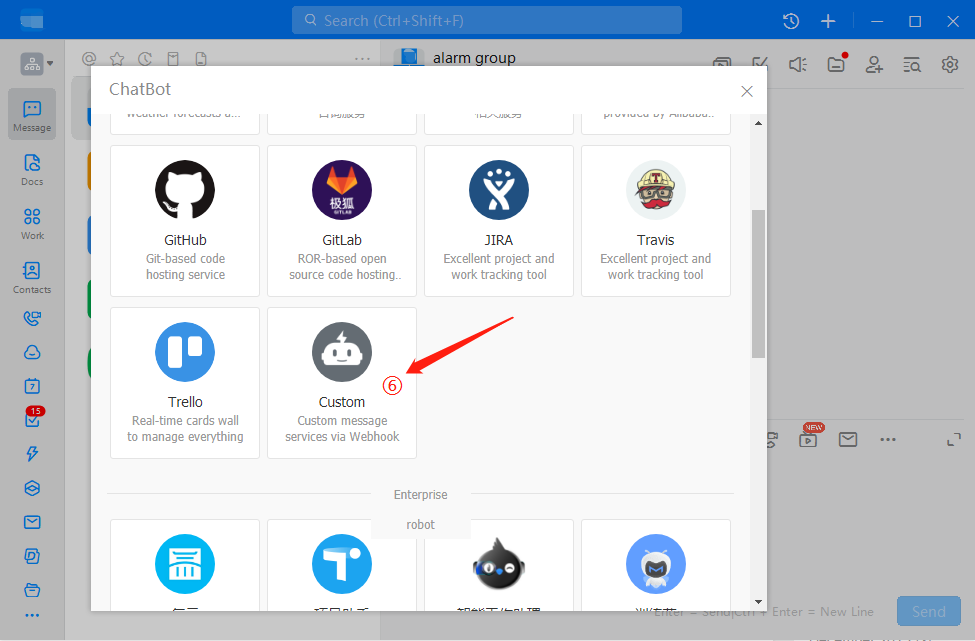
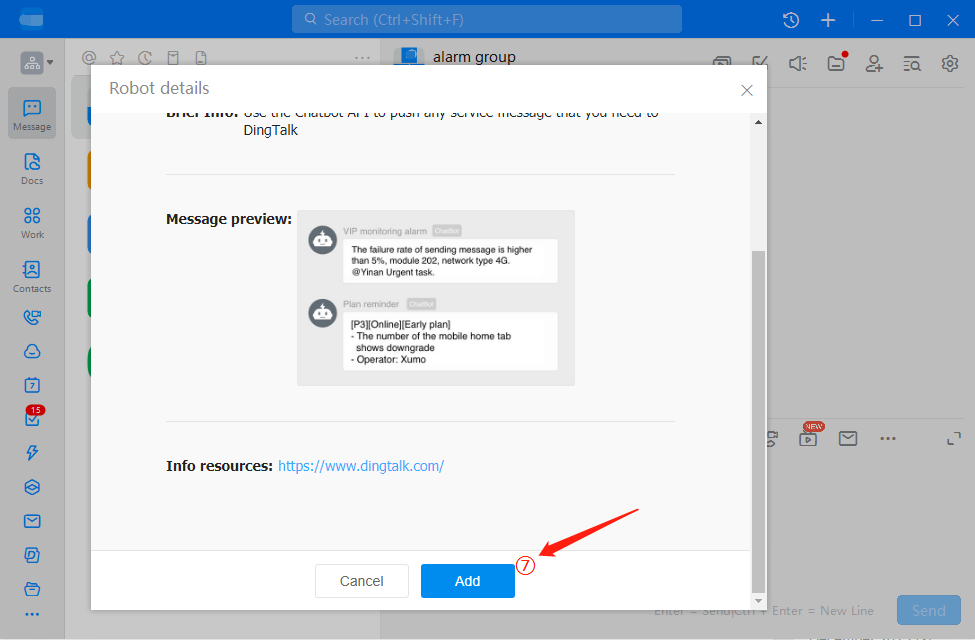
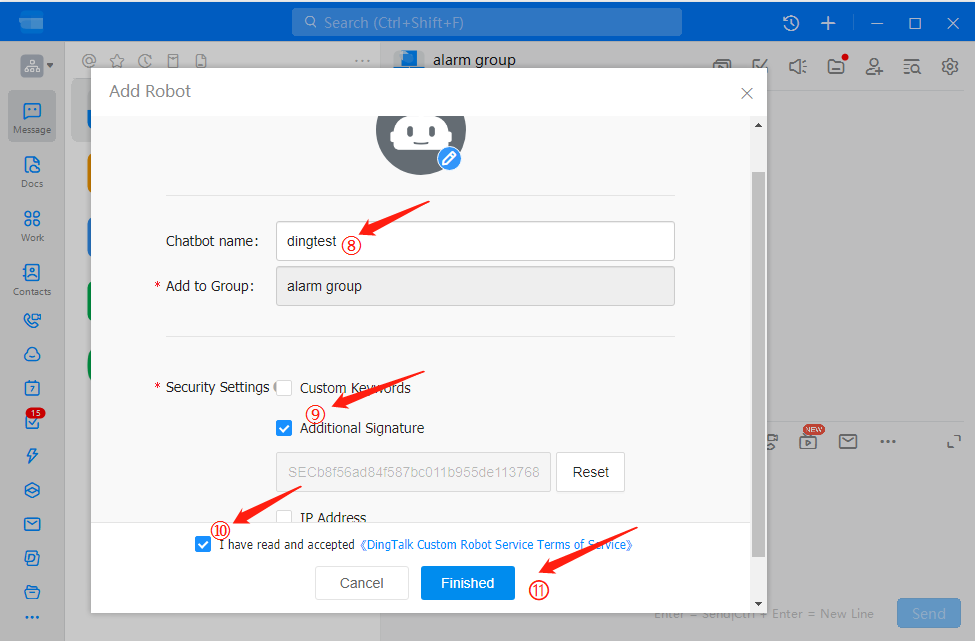
Multiple groups can be added here. After each addition or edit, you need to click "
Feishu Notification Configuration
Notification Method Configuration
After entering the Message Push platform, click the "+" button in the upper right corner, select "Feishu" and save, as shown in the figure below.
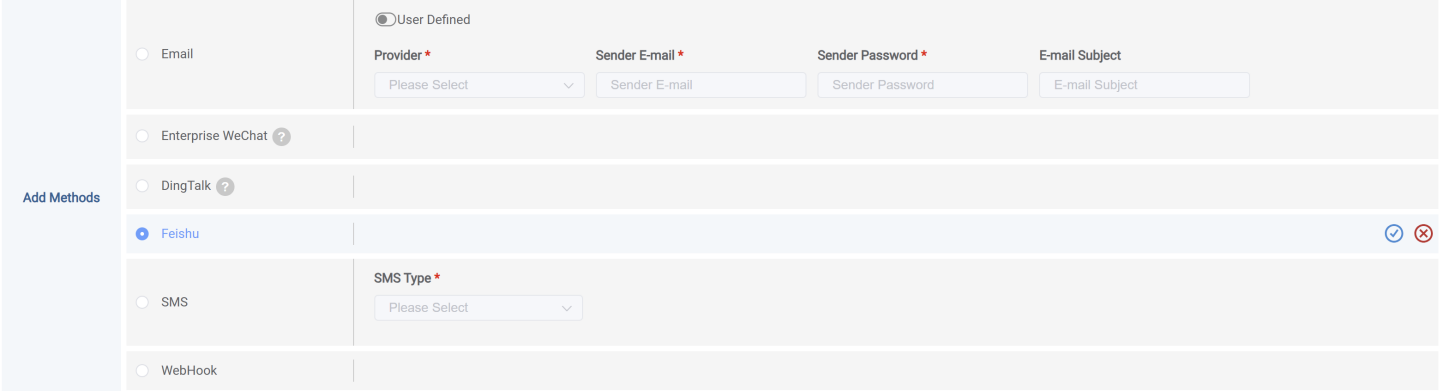
Notification Group Configuration
"Feishu" After the message notification method is created, you need to add notification personnel information. The operating steps are as follows:
- At Group List select in""Feishu" methods, click the right-hand side's "" button, enter the personnel addition page.
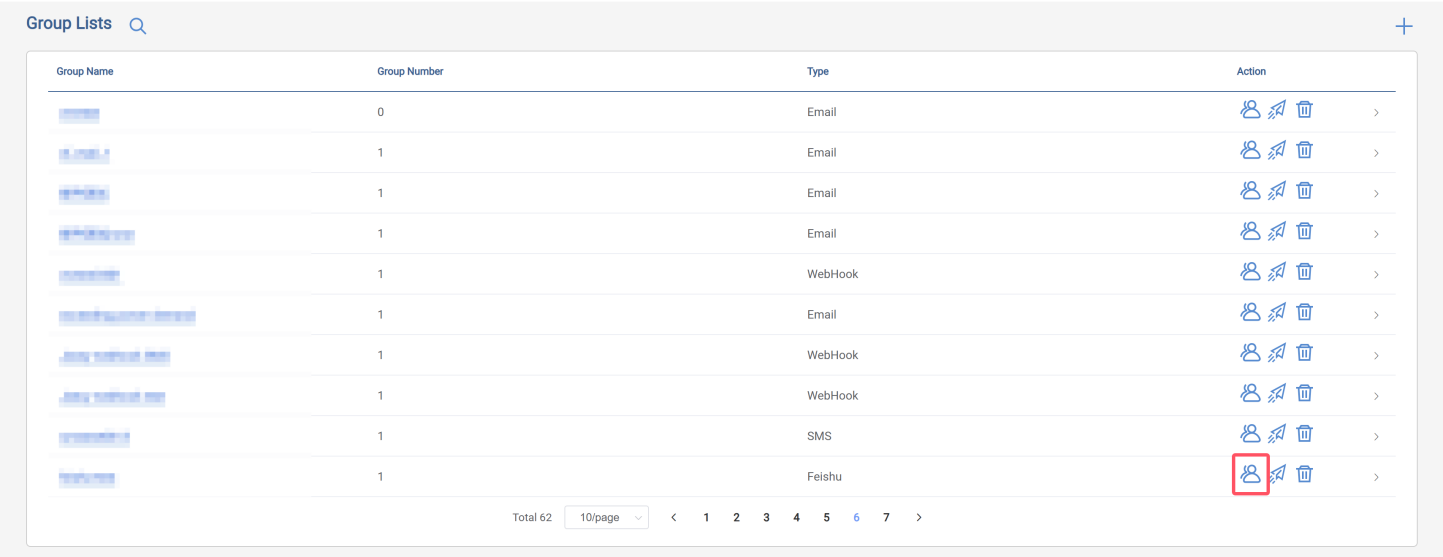
- "Feishu" group information already exists, fill in "Feishu" Webhook URL. Please fill in the following information:
-
Group Member: i.e., fill in name
-
Web Hook URL: Input "Feishu" group Webhook URL, the steps to obtain this information are as follows:
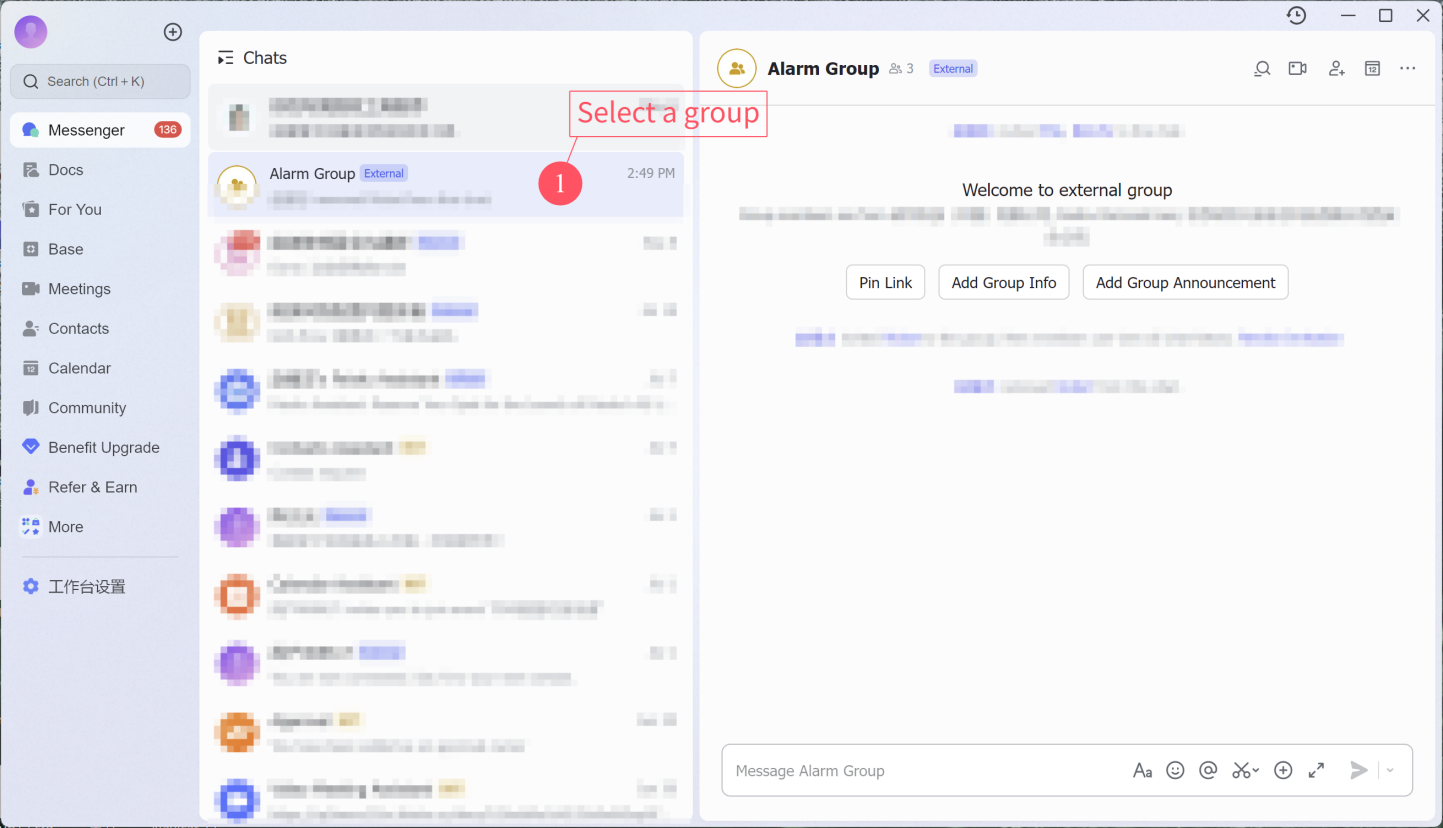
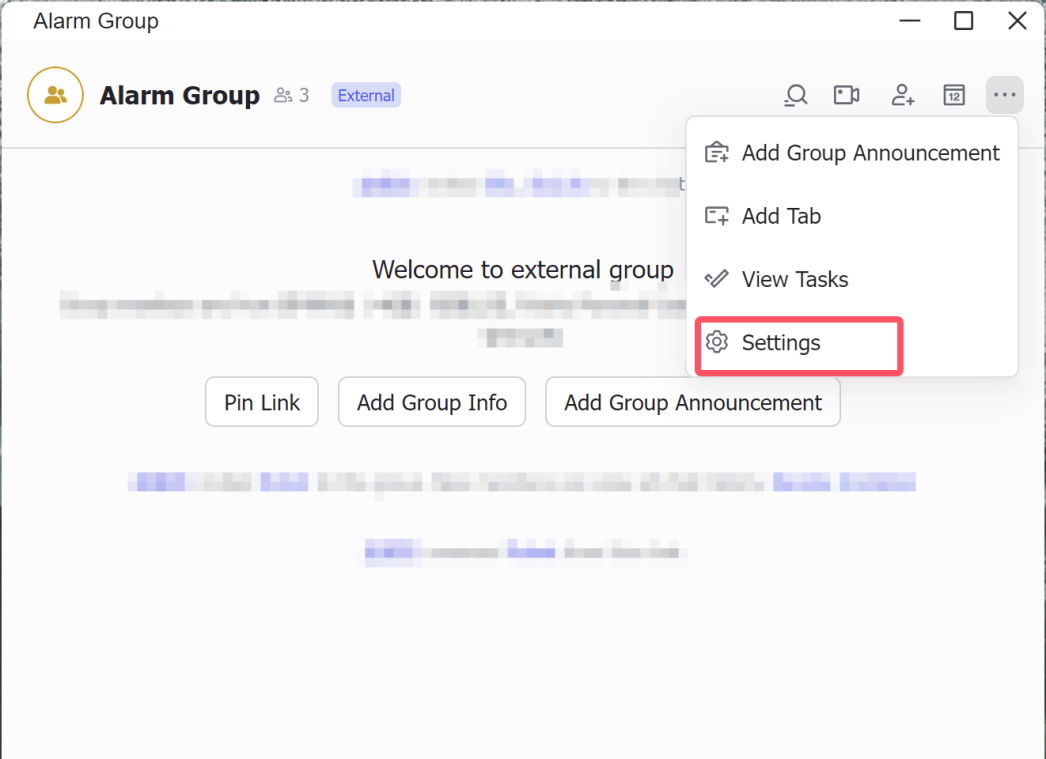
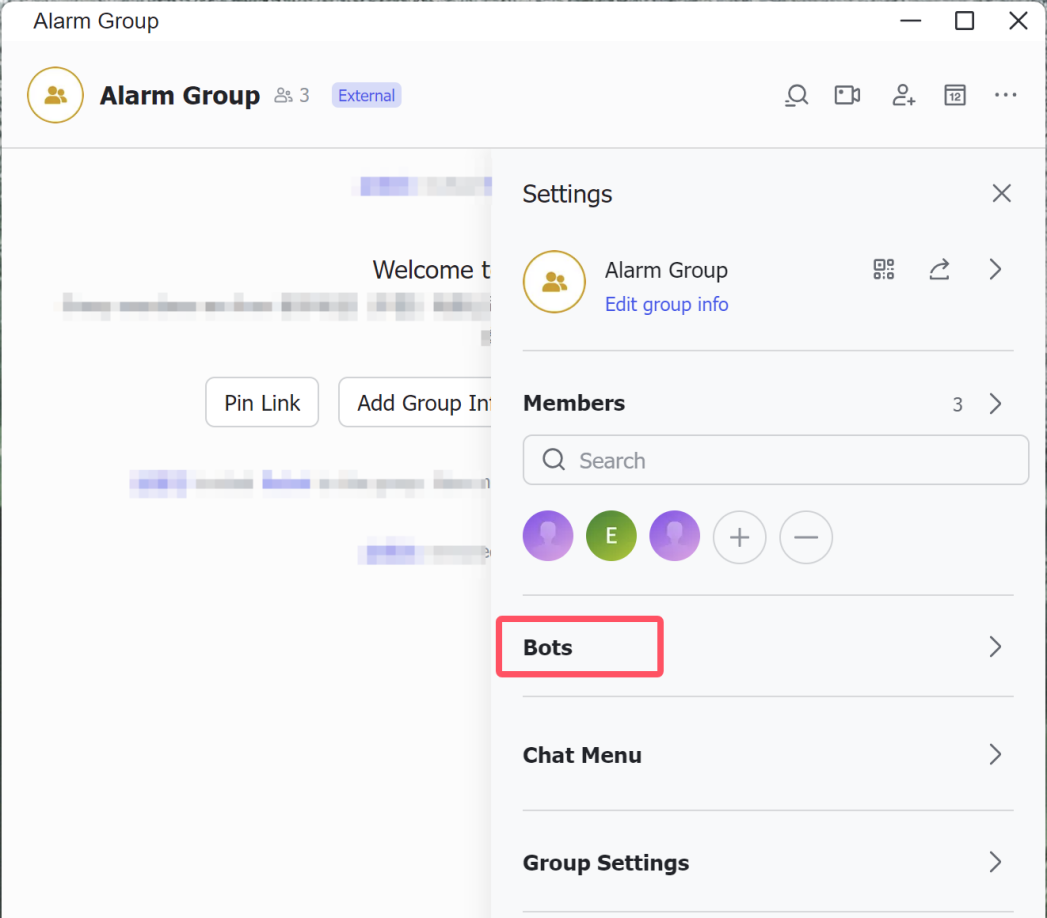
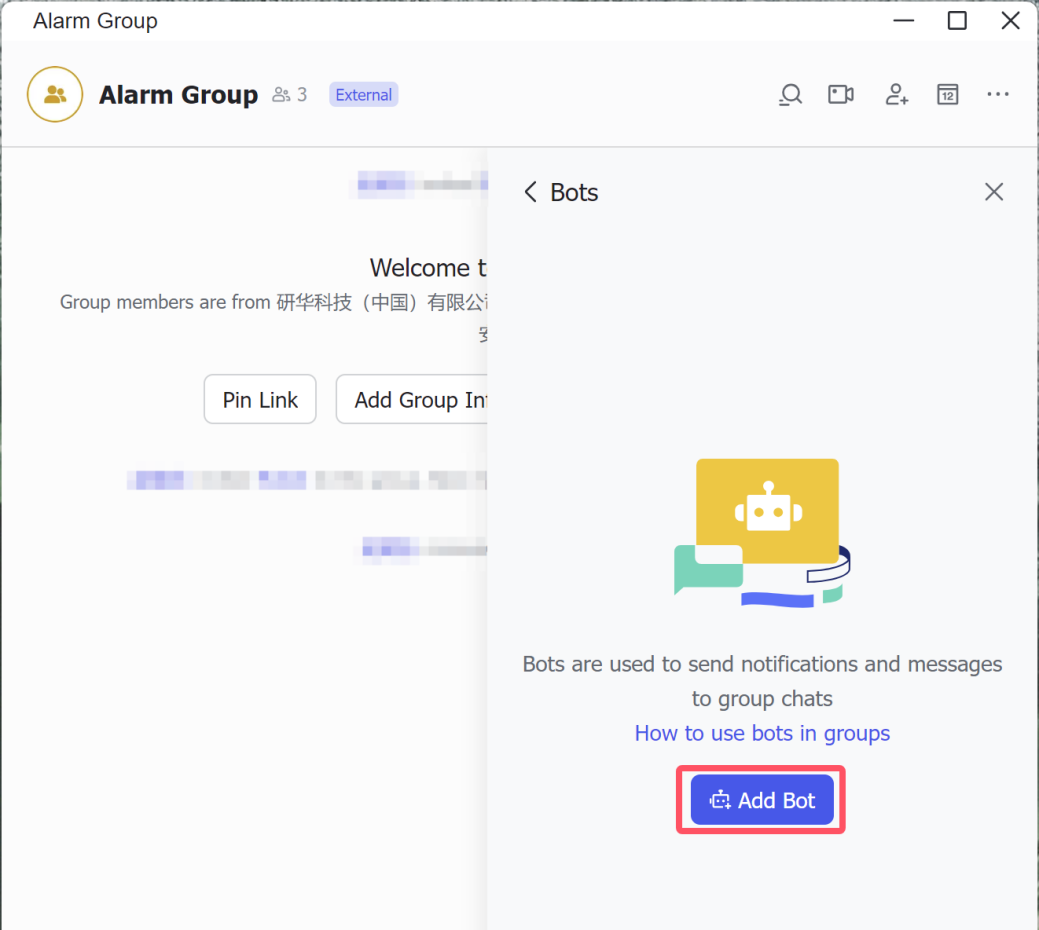
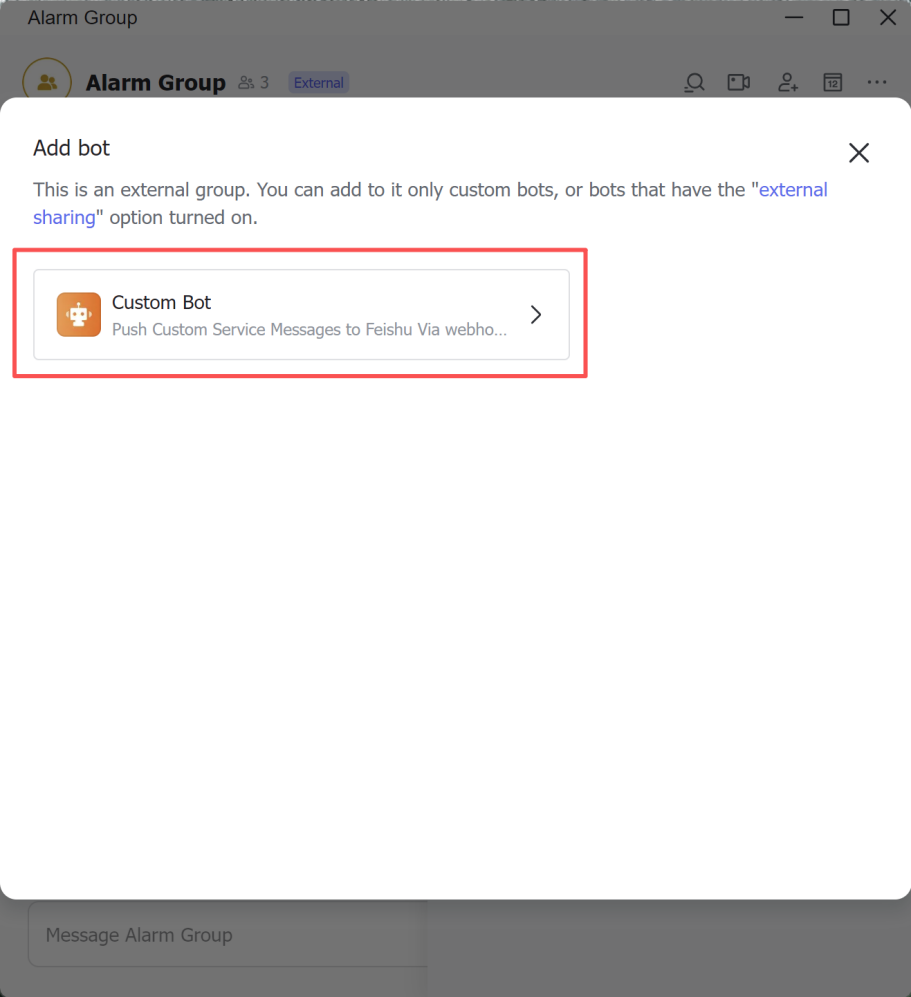
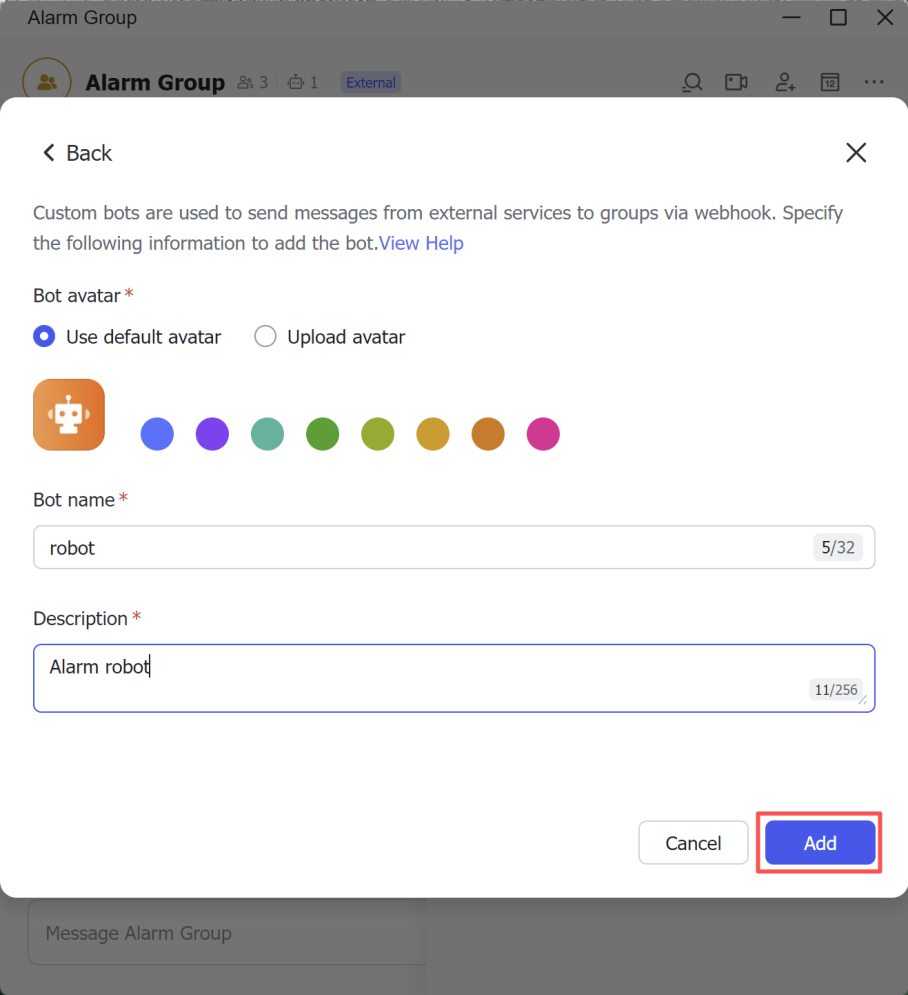
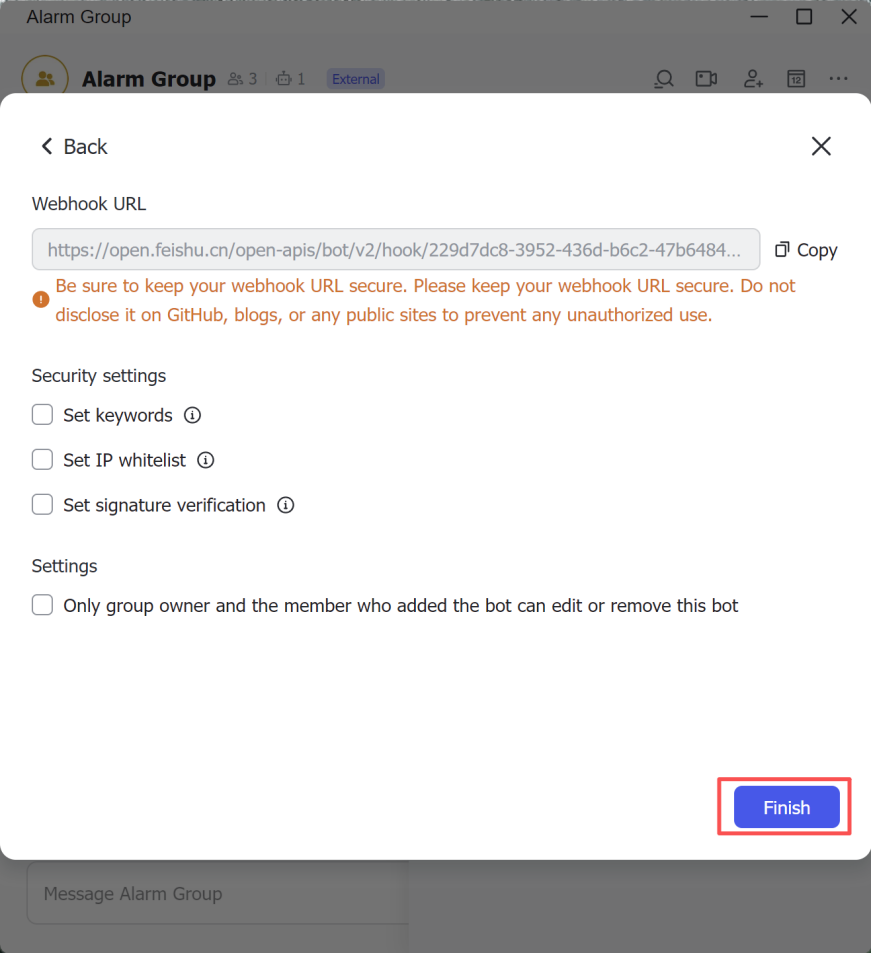
Here you can add multiple groups, after each addition or edit, you must click "
WebHook Notification Configuration
Notification Method Configuration
Goto Message Push on the platform, click the '+' button in the upper right corner, select "WebHook" and save, as shown in the figure below.
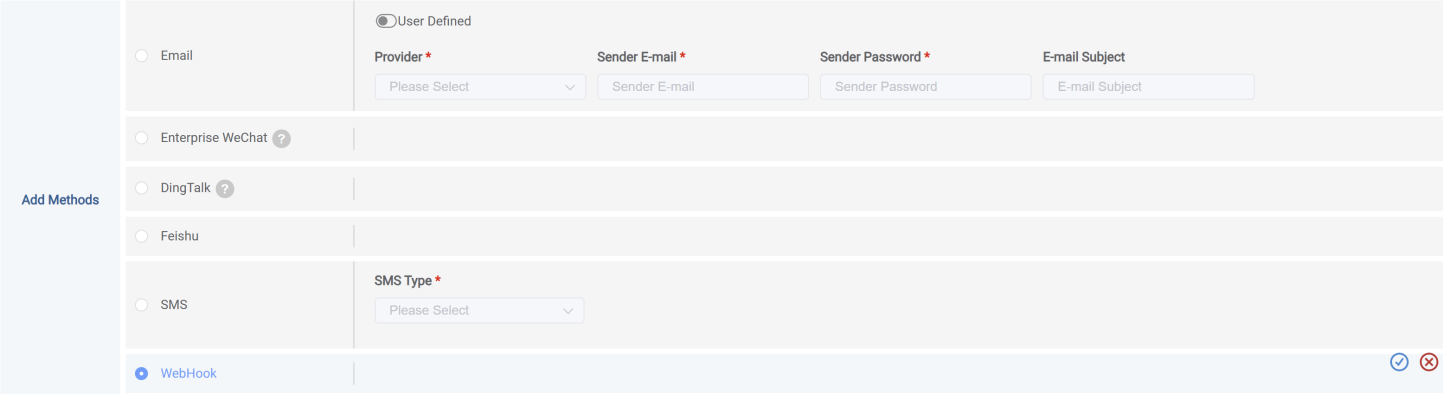
Third-party interface configuration
Webhook After the message notification method is created, notification-related information needs to be added, and the operating steps are as follows:
- In Group List select from "Webhook" notification method type, click on the right side of the "Click the "" button to enter the personnel addition page.
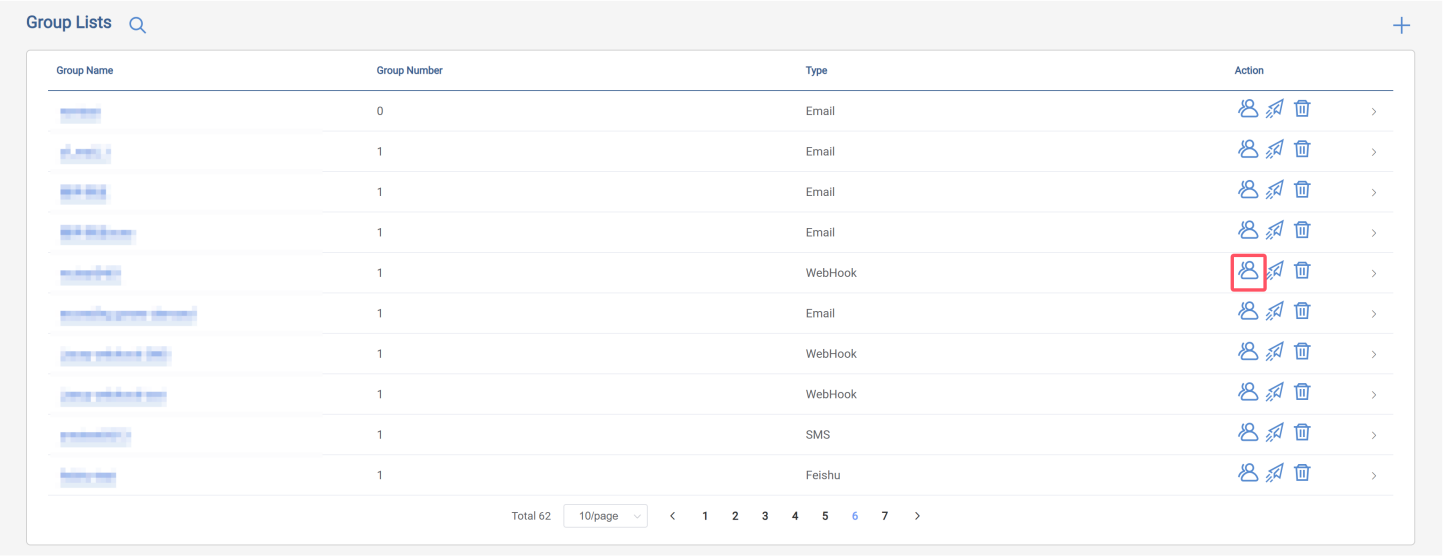
- After entering the page, you need to fill in the following information:
-
Group member: i.e., fill in the name
-
WebHook URL: Call interface address, required
-
Http Method: Interface sending method, optional: GET, POST, PUT
-
WebHook Header: Optional, fill in as appropriate
-
WebHook Body: Optional, fill in as appropriate
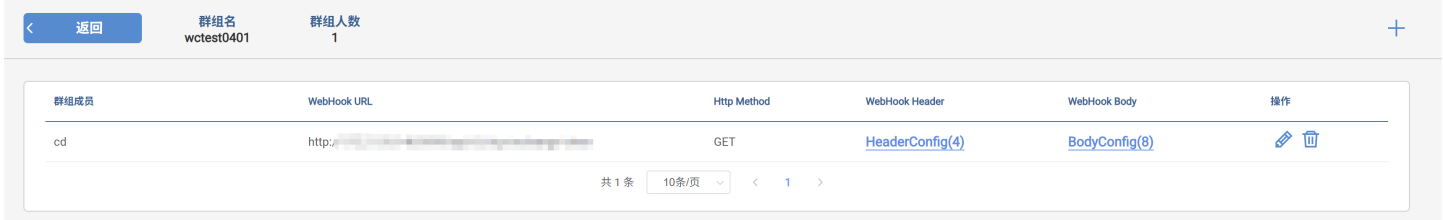
Multiple third-party interface information can be added here. After each addition or edit, you must click "Save".