1. Site Inspection Overview
Inspections, evaluations and trends of all sites under the current company are displayed according to the time range set.
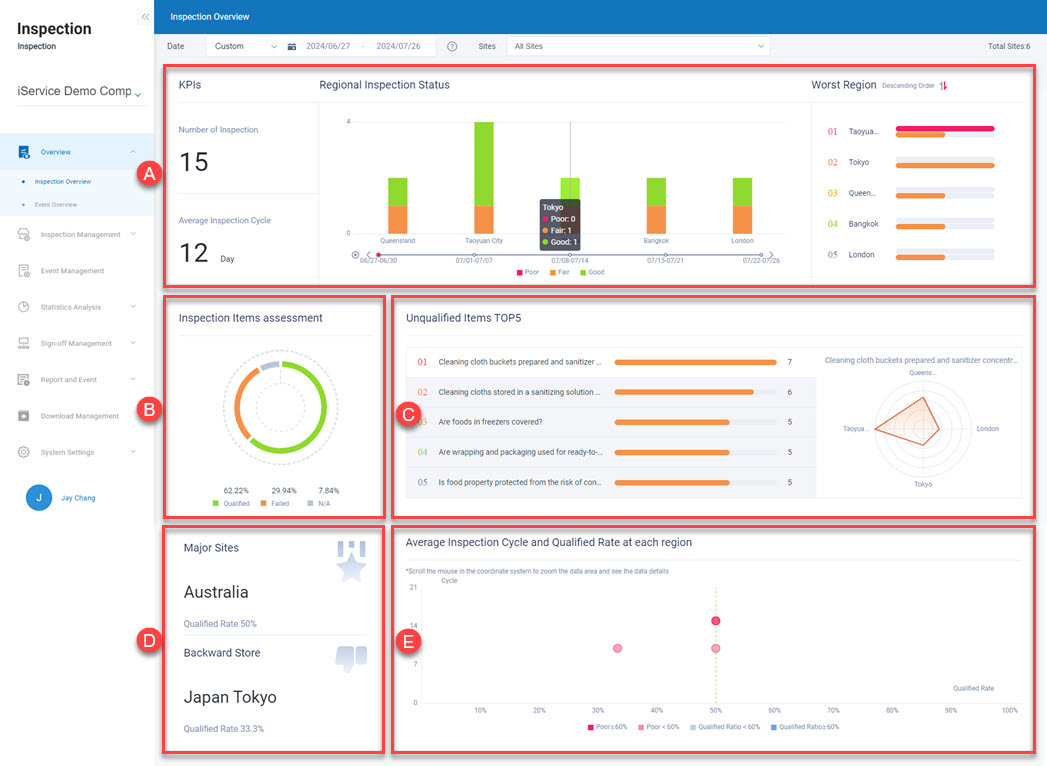
A. KPI: Lists the total number of inspections and the average inspection cycle; a bar chart is also used to show the statuses of each region, including immediate supervision, awaiting improvement, and good inspection reports. B. Proportion of items of site inspection for evaluation: The site inspection items for evaluation will be displayed in a pie chart to show their proportions. C. Top 5 unqualified items: Among all the items in site inspections, the most common defects ranked in the top 5 will be displayed in a radar chart to show the proportions across different areas. D. Major/Backward sites: Sites with the highest and lowest passing rates will be listed. E. The cycle time for site inspections and the passing rate in each area: The cycle time of site inspections is used as the X-axis, and the passing rate is used as the Y-axis to show the distribution of sites passing the inspection. You can use the mouse to zoom in on the data range for viewing.
2. Event Overview
Displays event processing statuses and trends in all sites under the current company according to the time range set.
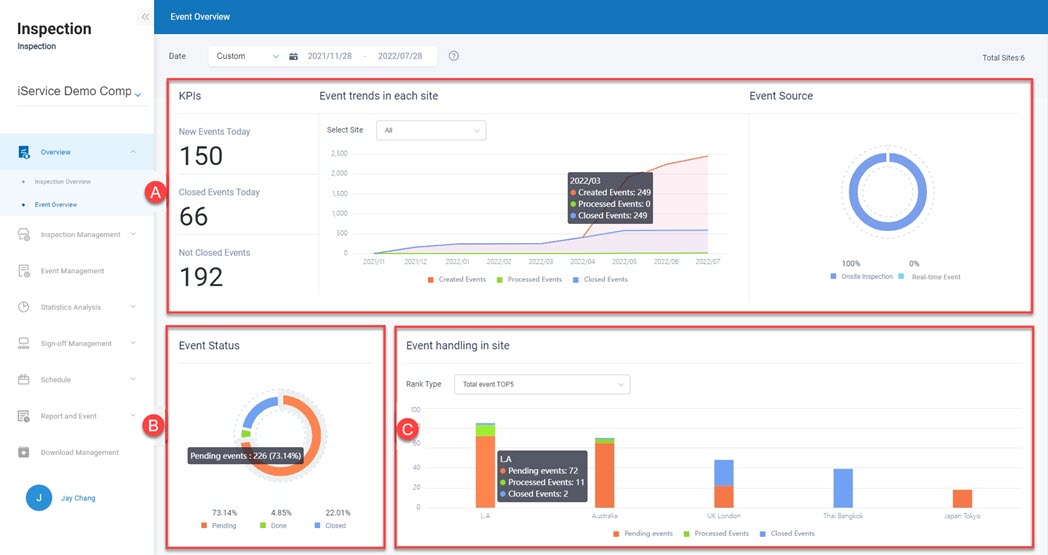 A. KPI: The number of events that occurred/settled on the day, and the pending cases. You can view the trend of event occurrences and settlements at a particular site, and display the cause of the events in a pie chart.
B. Status of response to events: Displayed in a pie chart to show the proportion of response statues to different events.
C. Responses to incidents at the sites: Displays the top 5 sites of incidents by 'top 5 by number of events', 'top 5 by pending actions', and 'top 5 by event settlements' in a bar chart.
A. KPI: The number of events that occurred/settled on the day, and the pending cases. You can view the trend of event occurrences and settlements at a particular site, and display the cause of the events in a pie chart.
B. Status of response to events: Displayed in a pie chart to show the proportion of response statues to different events.
C. Responses to incidents at the sites: Displays the top 5 sites of incidents by 'top 5 by number of events', 'top 5 by pending actions', and 'top 5 by event settlements' in a bar chart.