1. Statistics on Site Inspection Evaluation
Multilateral analysis will be conducted on the basis of the evaluation result and total scoring on the site inspection report to assist company administrator to quickly understand the inspection result of all or some sites.
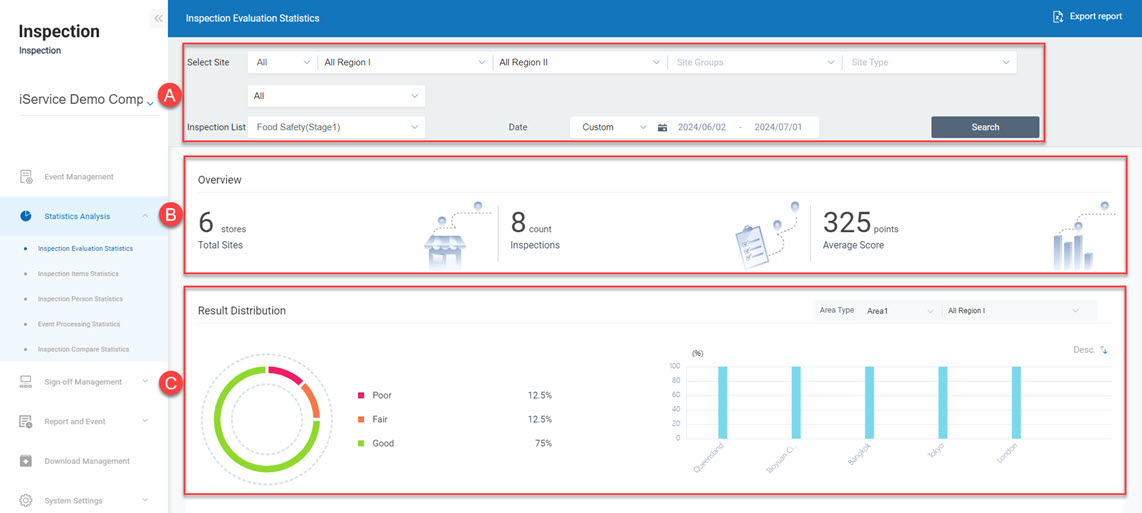
 A. Options of sites/inspection checklist: select the sites by country, region, site type/group and site name. You can also perform conditional searches according to the inspection tables.
B. Overview: total number of sites for inspection within the search range, total inspection frequency and average scoring.
C. Evaluation result distribution: clicking the pie chart on the left, the bar chart on the right will proceed to statistical analysis on the basis of immediate supervision, pending corrective action or sound evaluation results. Different classification will be switched by the display of statistical data. Click the bar charts and check the detail at the bottom.
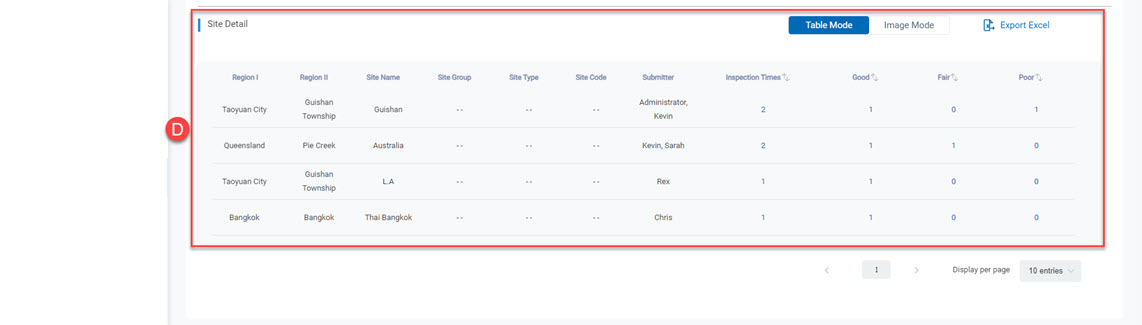
D. Details on the evaluation of the sites: displays detailed information according to the bar chart selected above. You may click the evaluation count to view the inspection report directly.You can switch between table or graphic modes, and also export as Excel file format.
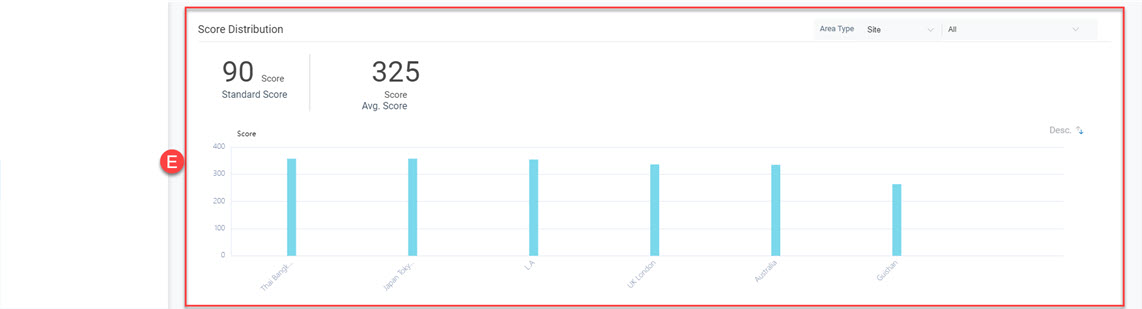
E. Distribution of the scoring from evaluation: switch to different classifications on the basis of the data display, click the bar chart and view the details at the bottom.
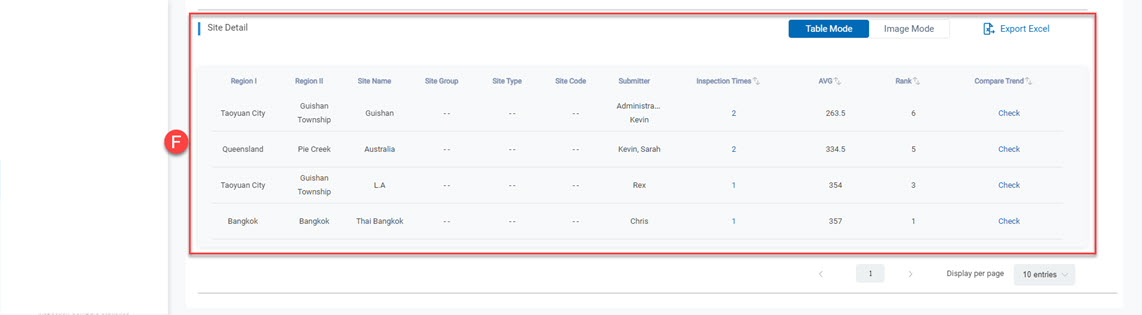
F. Evaluation details of scoring sites: displays the detailed information according to the bar chart selected above. You may click the evaluation count to view the inspection report, or proceed to period-on-period analysis. You can switch between table or graphic modes, and also export as Excel file format.
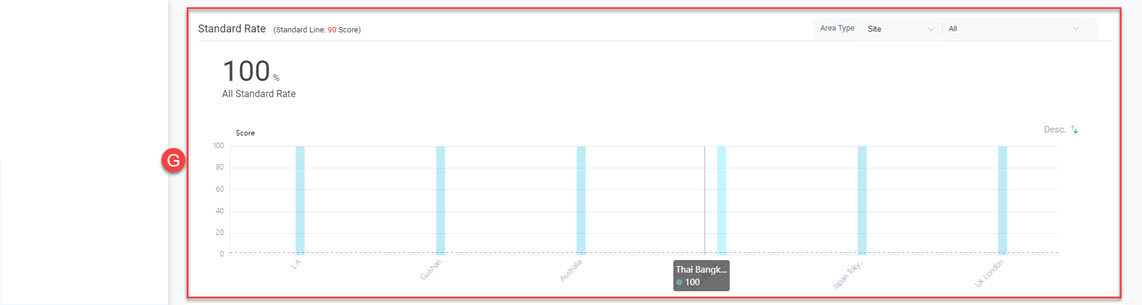
G. Compliance rate of the scoring from evaluation: This measures whether the inspection results meet the standards. The system calculates the compliance rate (pass rate) for all inspection items based on the score of each inspection. You can click on the bar chart to view detailed information below.
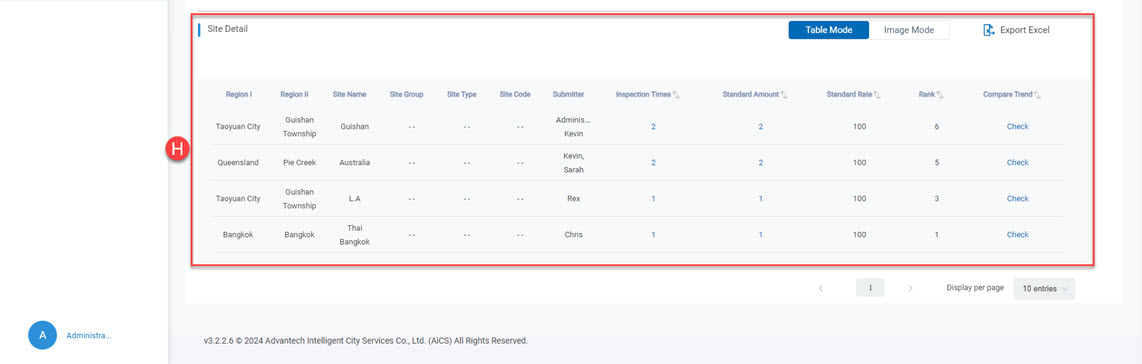
H. Evaluation details of compliance rate: Details of Compliant Location Assessment: Detailed data is displayed based on the selected bar chart above. You can click the number of assessments to view the inspection reports, or click to perform a comparative analysis. You can switch between table or chart mode, and also export it as an Excel file.
A. Options of sites/inspection checklist: select the sites by country, region, site type/group and site name. You can also perform conditional searches according to the inspection tables.
B. Overview: total number of sites for inspection within the search range, total inspection frequency and average scoring.
C. Evaluation result distribution: clicking the pie chart on the left, the bar chart on the right will proceed to statistical analysis on the basis of immediate supervision, pending corrective action or sound evaluation results. Different classification will be switched by the display of statistical data. Click the bar charts and check the detail at the bottom.
D. Details on the evaluation of the sites: displays detailed information according to the bar chart selected above. You may click the evaluation count to view the inspection report directly.You can switch between table or graphic modes, and also export as Excel file format.
E. Distribution of the scoring from evaluation: switch to different classifications on the basis of the data display, click the bar chart and view the details at the bottom.
F. Evaluation details of scoring sites: displays the detailed information according to the bar chart selected above. You may click the evaluation count to view the inspection report, or proceed to period-on-period analysis. You can switch between table or graphic modes, and also export as Excel file format.
G. Compliance rate of the scoring from evaluation: This measures whether the inspection results meet the standards. The system calculates the compliance rate (pass rate) for all inspection items based on the score of each inspection. You can click on the bar chart to view detailed information below.
H. Evaluation details of compliance rate: Details of Compliant Location Assessment: Detailed data is displayed based on the selected bar chart above. You can click the number of assessments to view the inspection reports, or click to perform a comparative analysis. You can switch between table or chart mode, and also export it as an Excel file.
2. Statistics on items of inspection
Analysis will be conducted on the evaluation result to help company administrators quickly understand the most common items assessed as failure in all sites in order the seek remedy through training and education.
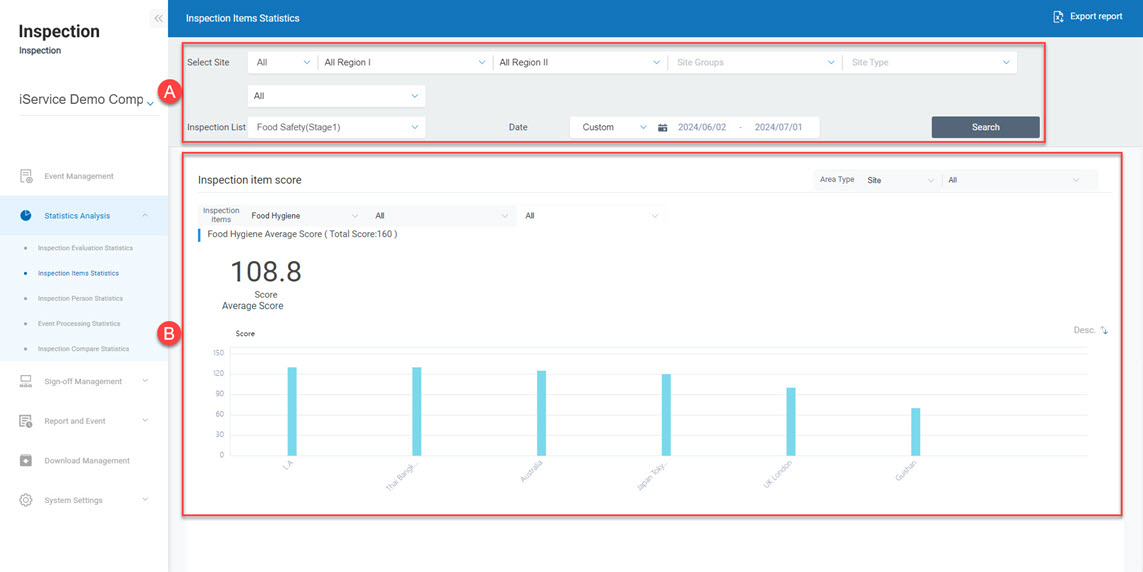
 A. Options of sites/inspection checklist: select the sites by country, region, site type/group and site name. You can also perform conditional searches according to the inspection tables.
B. Scoring of the items of site inspection: switch to different classifications on the basis of the data display, click the bar chart and view the details at the bottom.
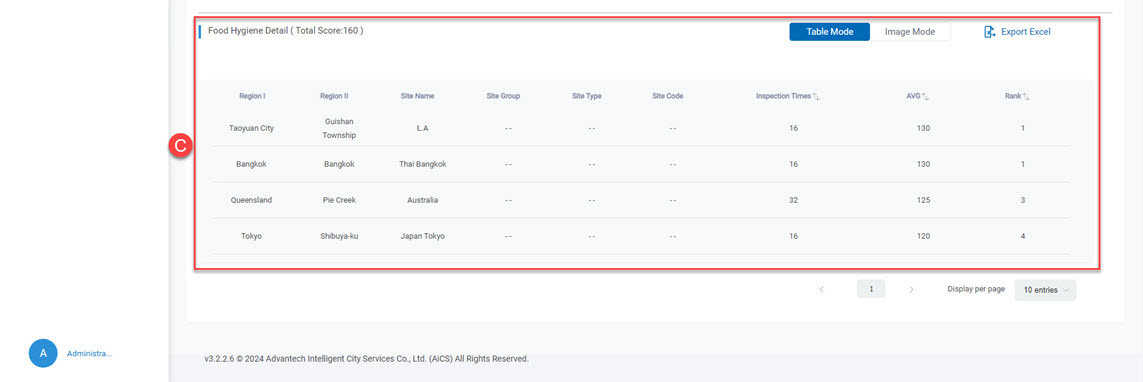
C. Evaluation detail: displays the detailed information according to the bar chart selected above. You can switch between table or graphic modes, and also export as Excel file format.
A. Options of sites/inspection checklist: select the sites by country, region, site type/group and site name. You can also perform conditional searches according to the inspection tables.
B. Scoring of the items of site inspection: switch to different classifications on the basis of the data display, click the bar chart and view the details at the bottom.
C. Evaluation detail: displays the detailed information according to the bar chart selected above. You can switch between table or graphic modes, and also export as Excel file format.
3. Statistics on the site inspectors
To allow company administrator to quickly understand the status of inspection conducted by the site inspectors as reference for subsequent personnel evaluations.
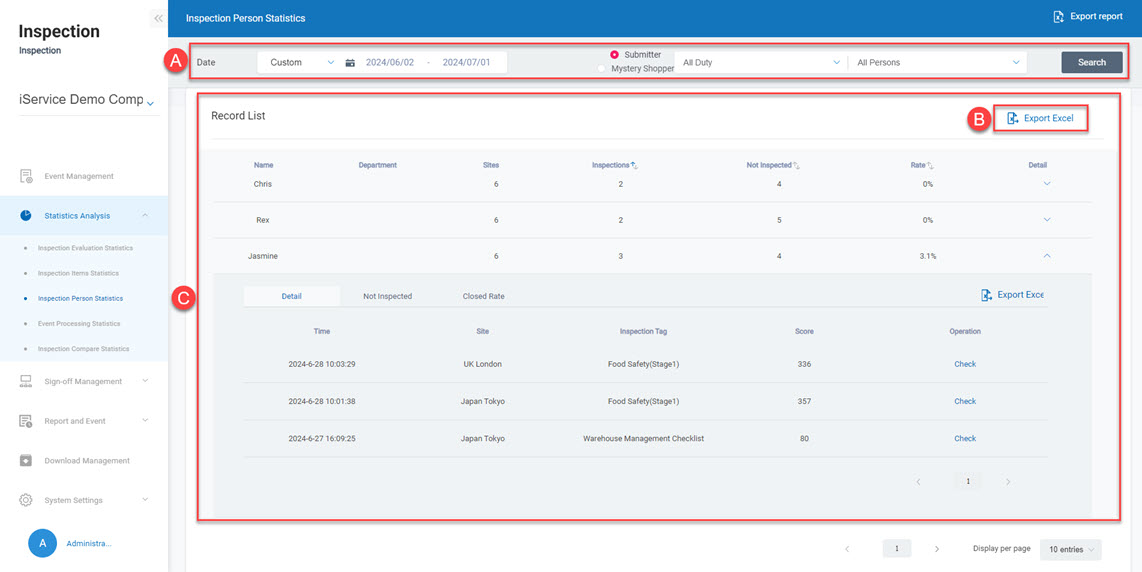 A. Time/job function options: Adjusts the time interval and the job or specific personnel for data searching.
B. Export in Excel format: The data on site inspection record could be exported as an Excel file.
C. Inspection record list: Lists the number of sites, frequency of inspection, number of sites not inspected, and the case closing rate bound to site inspectors. Click the detail to view the inspection report.
A. Time/job function options: Adjusts the time interval and the job or specific personnel for data searching.
B. Export in Excel format: The data on site inspection record could be exported as an Excel file.
C. Inspection record list: Lists the number of sites, frequency of inspection, number of sites not inspected, and the case closing rate bound to site inspectors. Click the detail to view the inspection report.
4. Statistics on responses to events
Statistical analysis is performed according to the events generated at each site and each inspection item to allow company administrators to quickly understand the inspection items with the most problems at each site, and the sites with the most events generated, in order to enhance related educational trainings.
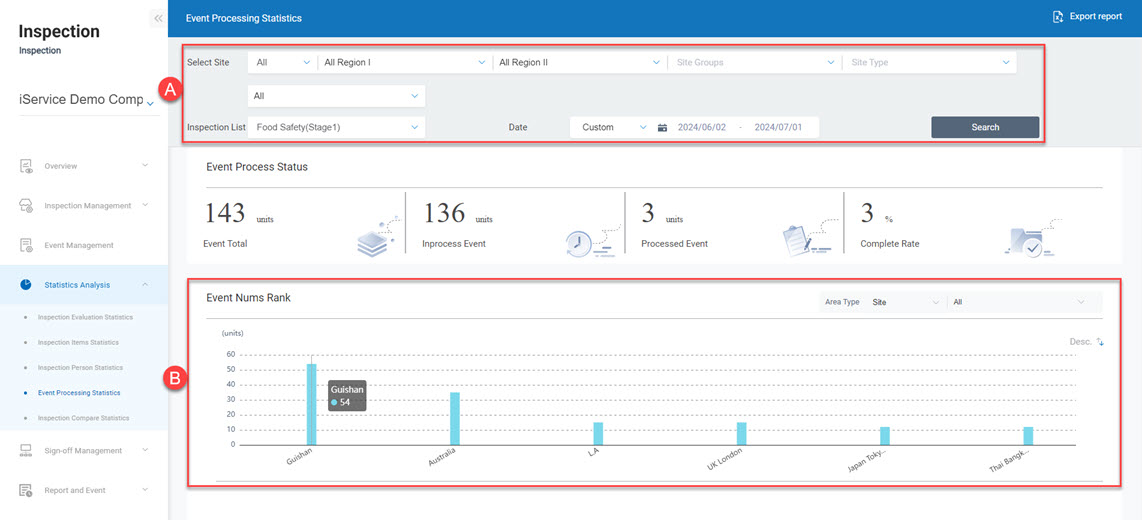
 A. Options of sites/inspection checklist: Select the sites by country, region, site type/group and site name. You can also perform conditional searches according to the inspection tables.
B. Ranking by number of events: Switch to different classifications on the basis of the data display, click the bar chart and view the details at the bottom.
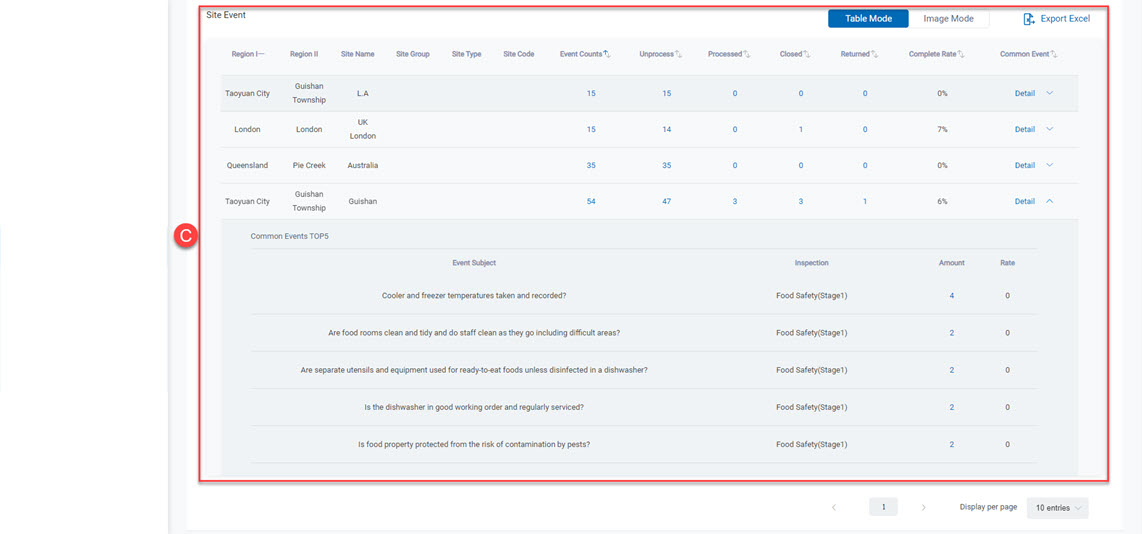
C. Events at the sites: Displays the detailed information according to the bar chart selected above. Click the detail of the sites to view the top 5 events that occurred at the site most frequently.
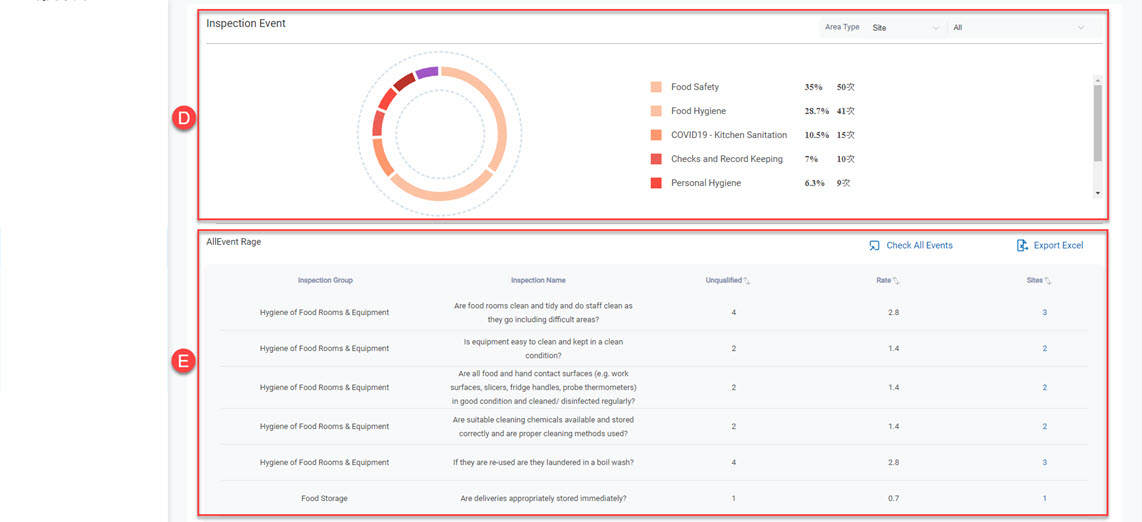
D. Inspection item events: Statistics is kept on the proportion of events that occurred most frequently among the inspection items; click on each item to view the detailed information below.
E. Detailed information on inspection item events: Lists the proportion of inspection items that did not pass according to the inspection category selected above; click the sites involved to view related sites which did not pass this inspection item.
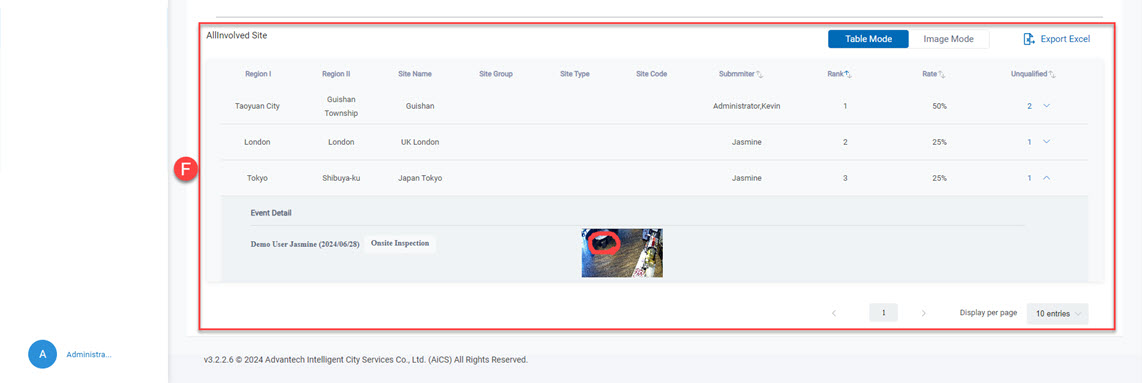
F. Involving sites: Lists the involved sites related to the inspection item above; click on the unqualified count to view related details of this event.
A. Options of sites/inspection checklist: Select the sites by country, region, site type/group and site name. You can also perform conditional searches according to the inspection tables.
B. Ranking by number of events: Switch to different classifications on the basis of the data display, click the bar chart and view the details at the bottom.
C. Events at the sites: Displays the detailed information according to the bar chart selected above. Click the detail of the sites to view the top 5 events that occurred at the site most frequently.
D. Inspection item events: Statistics is kept on the proportion of events that occurred most frequently among the inspection items; click on each item to view the detailed information below.
E. Detailed information on inspection item events: Lists the proportion of inspection items that did not pass according to the inspection category selected above; click the sites involved to view related sites which did not pass this inspection item.
F. Involving sites: Lists the involved sites related to the inspection item above; click on the unqualified count to view related details of this event.
5. Period-on-Period analysis of inspection
Different sites and regions, scoring in site inspection and trend on the same site inspection checklist.
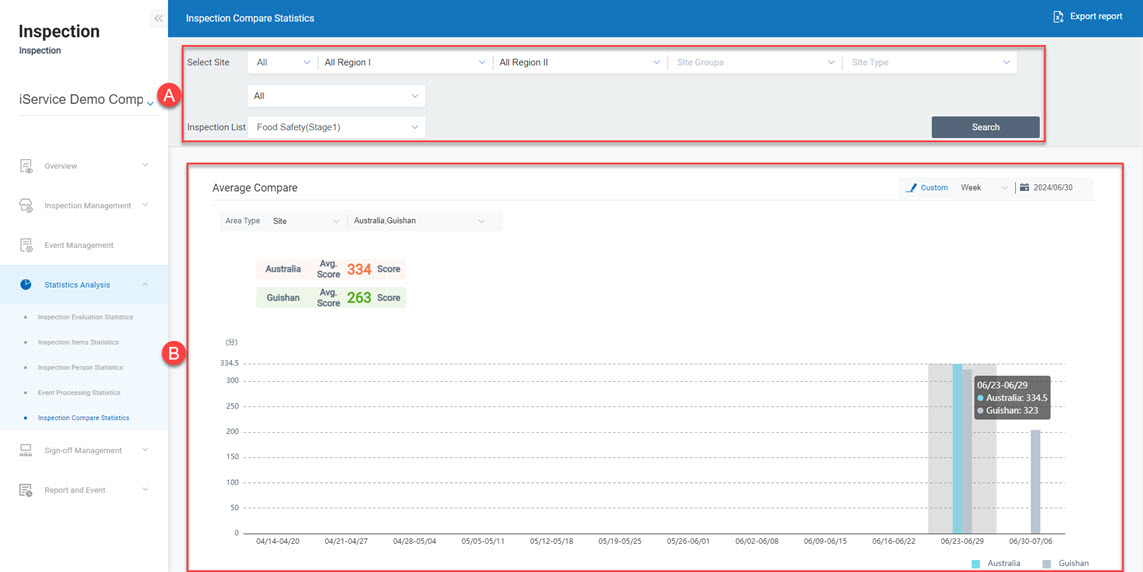
 A. Options of sites/inspection checklist: Select the sites by country, region, site type/group and site name. You can also perform conditional searches according to the inspection tables.
B. Period-on-Period analysis: Compare the scoring trends of 2 regions or 2 sites by the default condition.
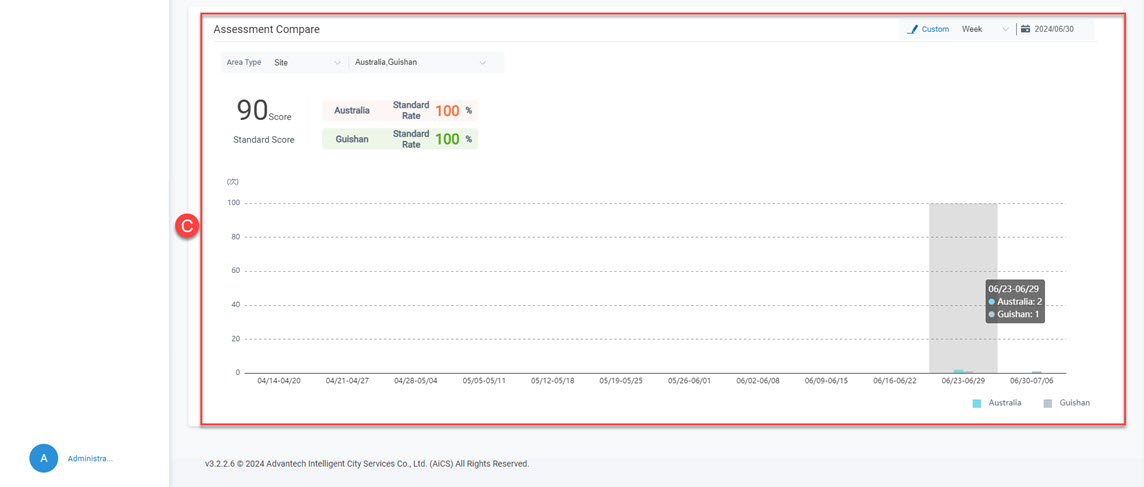
C. Assessment Compare analysis: Compare the inspection assessment trends of two regions or two sites based on the default conditions.
A. Options of sites/inspection checklist: Select the sites by country, region, site type/group and site name. You can also perform conditional searches according to the inspection tables.
B. Period-on-Period analysis: Compare the scoring trends of 2 regions or 2 sites by the default condition.
C. Assessment Compare analysis: Compare the inspection assessment trends of two regions or two sites based on the default conditions.