Real-time Status
The queue management function is designed to help managers monitor and manage queue conditions in real time, offering three core data statistics and monitoring features. First, by tracking the average waiting number, managers can gain insights into the typical queue situation over a given period, facilitating resource allocation and adjustments in service efficiency. Additionally, the real-time queue count feature provides immediate data on the current number of people in line, allowing managers to stay updated on the current queue status. Finally, through monitoring status, the system can display whether the venue is currently congested, enabling managers to respond flexibly to peak traffic periods.
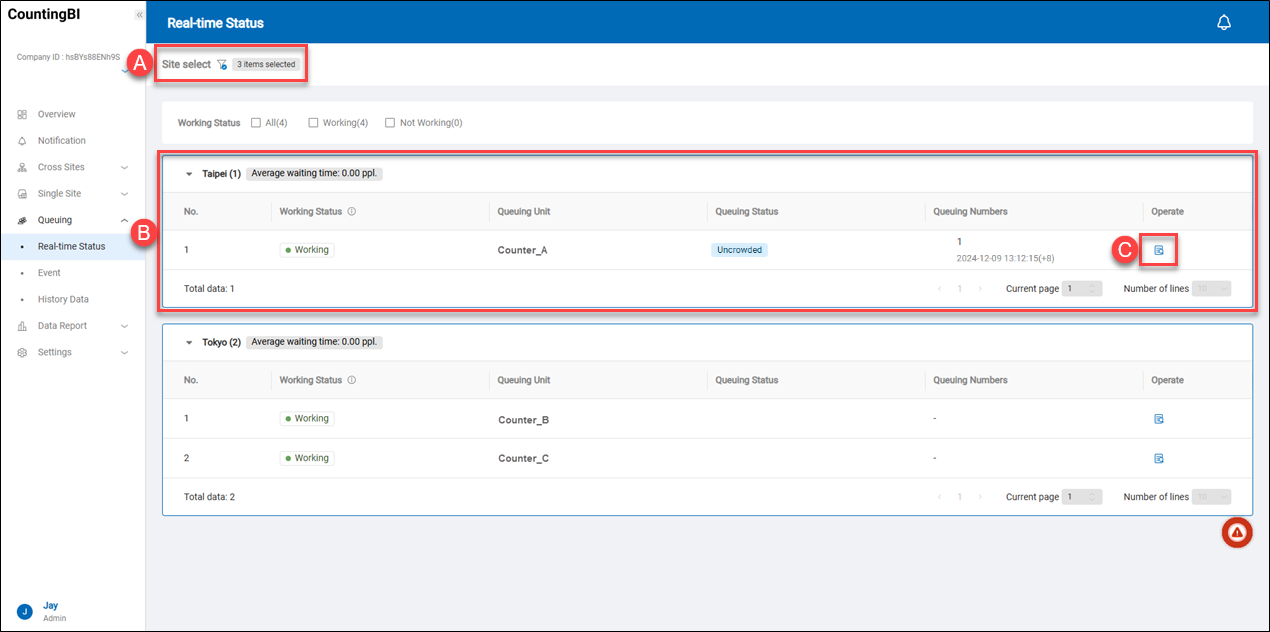 A.【Site Select】 ⇒ Click the filter icon
 ![]() to filter queue management data by country/region, region, site region, site type, or site name. By default, all sites will be listed for displaying queue management data.
to filter queue management data by country/region, region, site region, site type, or site name. By default, all sites will be listed for displaying queue management data.
B.【Queue Information】 ⇒ Managers can effectively monitor each site’s handling of customer flow.
- Average Waiting Number: Calculated as "Total Queue Count / Number of Queue Units."
- Working Status: Displays two statuses, "Working" and "Not Working." If a "Queue Unit" has not received queue data uploaded by iVision Suite Edge for 15 consecutive minutes, it will display "Not Working." If queue data is received, it displays "Working."
- Queuing Unit: Refers to the "Queue Area," which is the queue count area designated by iVision Suite Edge.
- Monitoring Status: Displays two statuses, "Congested" and "Not Congested." This status is based on the current queue count to determine congestion levels.
- Queuing Status: Represents the current number of people in the "Queue Unit," with data automatically updated every 5 seconds.
> Note:
- All "Real-Time Status" data in the queue management function is sourced from the count units within the "Queue Area" uploaded by the iVision Suite Edge, while "Historical Data" is aggregated and calculated by this system.
- An example of calculating the Average Waiting Number is as follows. Suppose: There are three queue units in one location: "Queue Unit_A," "Queue Unit_B," and "Queue Unit_C." Their current queue counts are 10, 5, and 3 people, respectively. The Average Waiting Number would be (10 + 5 + 3) = 18 (people) / 3 (queue units) = 6 people.
C.【View Details】 ⇒ Click on the "View Detail" icon ![]() to see more information about the queuing status of the designated counting unit.
to see more information about the queuing status of the designated counting unit.
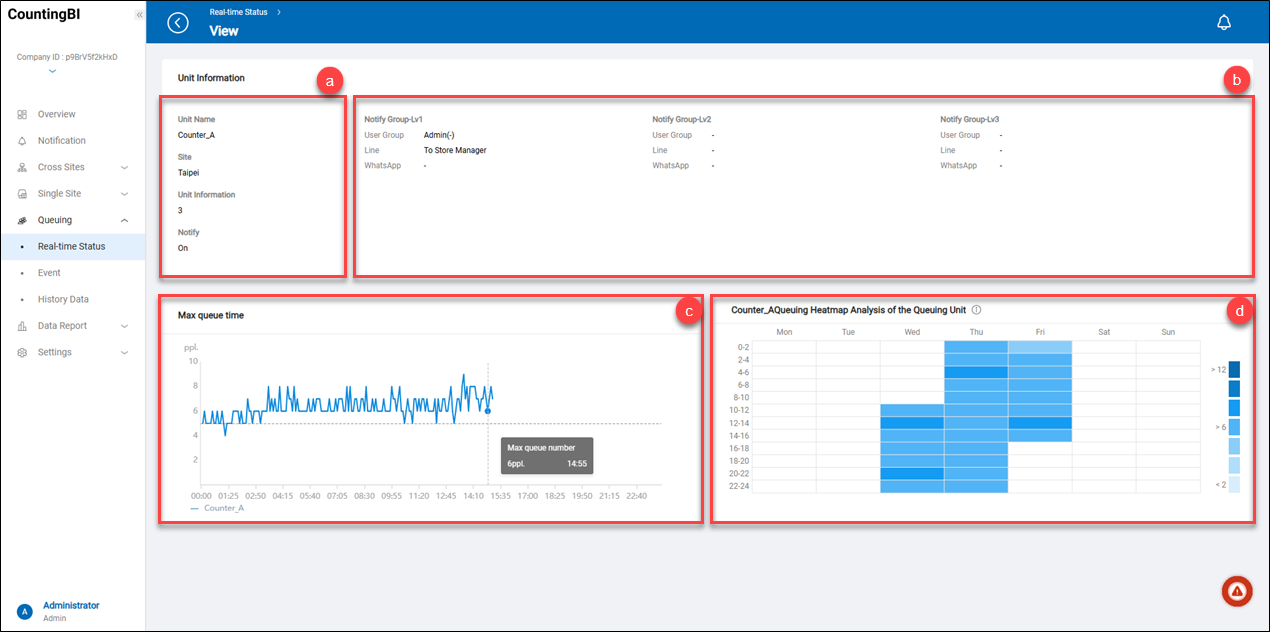 a.【Unit Information】 ⇒ This information includes the counting unit name(Unit Name), the unit it belongs to(Site), the current number of people in the queuing area(Unit Information), and whether the notification is enabled or disabled(Notify).
b.【Notify Level】 ⇒ List the three notification group level settings and the job titles of the individuals who will receive the notifications.
c.【Max Queue Time】 ⇒ This chart shows the variation in the queuing numbers of the counting unit during today's time period. Users can see the queuing number by hovering over the chart.
d.【Queuing Heatmap Analysis】 ⇒ This heatmap shows the maximum queuing numbers at different times of the day throughout the week. Users can see the queuing number by hovering over the chart.
a.【Unit Information】 ⇒ This information includes the counting unit name(Unit Name), the unit it belongs to(Site), the current number of people in the queuing area(Unit Information), and whether the notification is enabled or disabled(Notify).
b.【Notify Level】 ⇒ List the three notification group level settings and the job titles of the individuals who will receive the notifications.
c.【Max Queue Time】 ⇒ This chart shows the variation in the queuing numbers of the counting unit during today's time period. Users can see the queuing number by hovering over the chart.
d.【Queuing Heatmap Analysis】 ⇒ This heatmap shows the maximum queuing numbers at different times of the day throughout the week. Users can see the queuing number by hovering over the chart.
Event
Counting BI provides an event management feature designed to deliver real-time notifications of the current queue size. Additionally, it supports historical analysis to examine queue trends within specific statistical periods. This feature enables users to stay informed about on-site conditions and make more accurate decisions based on data insights.
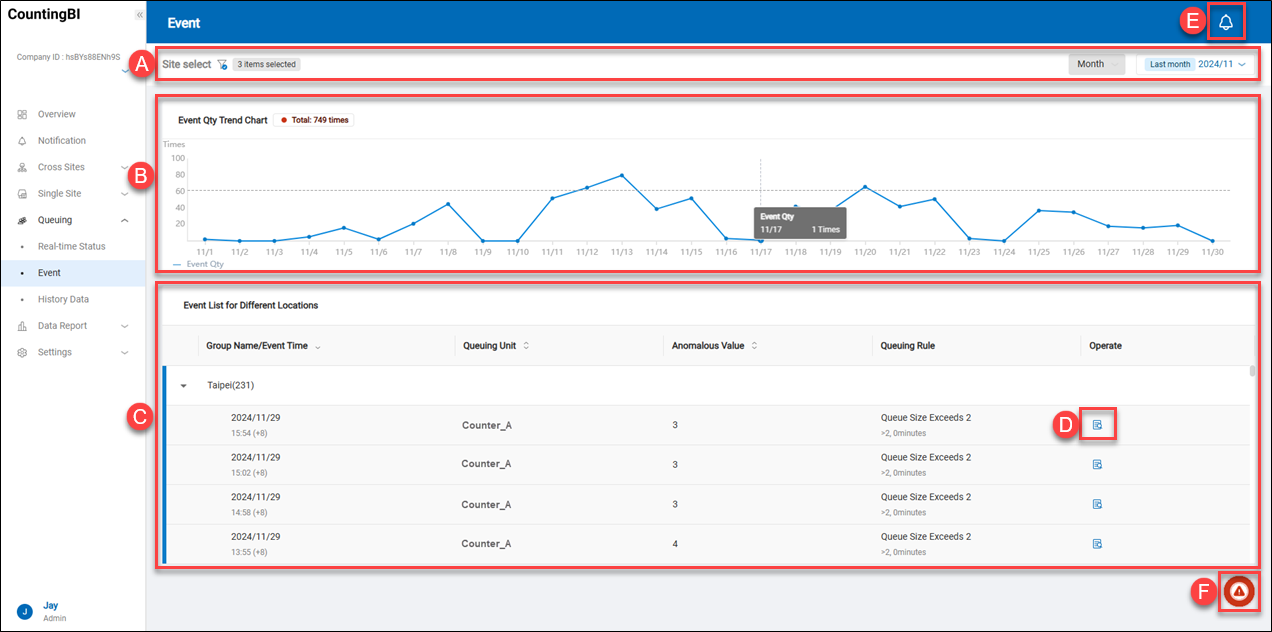 A.【Site Select】 ⇒ Click the filter icon
 ![]() to filter sites based on criteria such as country/region, region, site region, site type, or site name, and select a site to view.
B.【Event Qty Trend Chart】 ⇒ Based on the specified month, this chart displays the queuing quantity for each day of the month.
C.【Event List】 ⇒ Based on the users' designated sites, this feature is designed to display the information of all events at each site within the specified statistical period.
D.【View Details】 ⇒ Click on the "View Detail" icon to see a specific event in detail.
to filter sites based on criteria such as country/region, region, site region, site type, or site name, and select a site to view.
B.【Event Qty Trend Chart】 ⇒ Based on the specified month, this chart displays the queuing quantity for each day of the month.
C.【Event List】 ⇒ Based on the users' designated sites, this feature is designed to display the information of all events at each site within the specified statistical period.
D.【View Details】 ⇒ Click on the "View Detail" icon to see a specific event in detail.
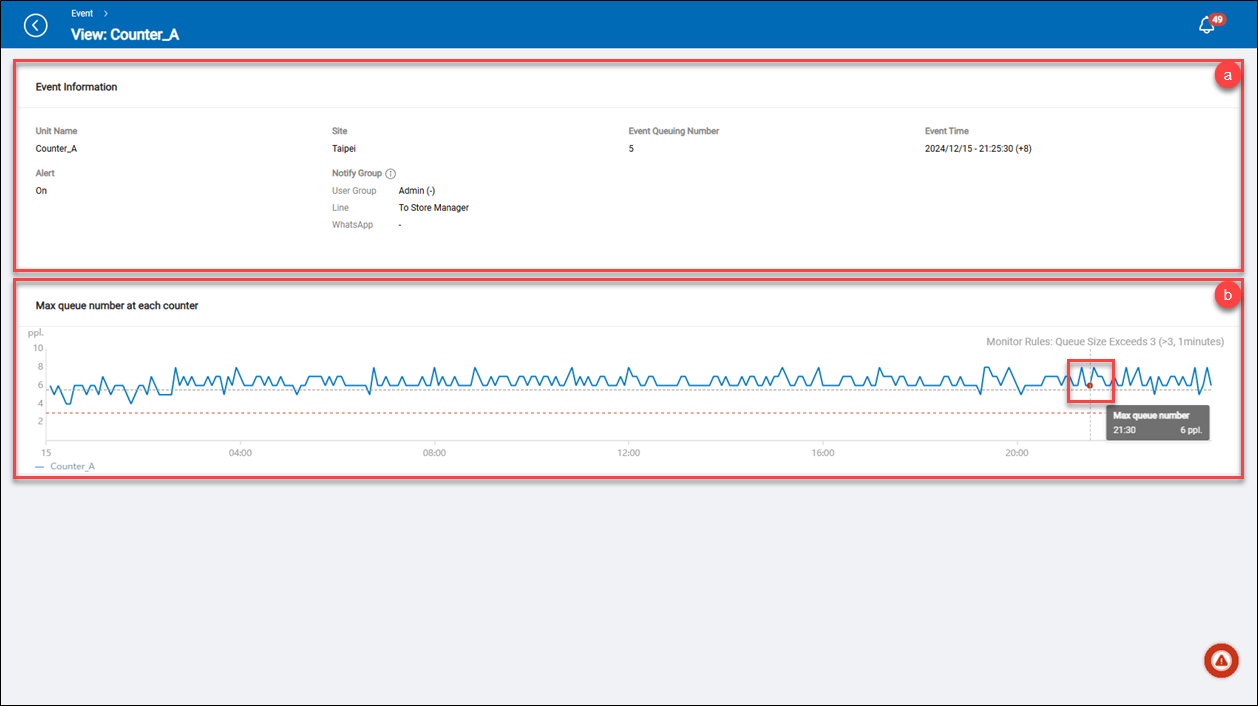 a.【Event Information】 ⇒ Users can view the summary information of an event, including the site/unit the event belongs to, the alert setting status, the number of people queuing at that time (Event Queuing Number), the time the event occurred (Event Time), and the notification recipients (Notify Group).
b.【Max queue number at each counter】 ⇒ This chart shows the maximum queue number at each counter at each time point throughout the day. When the user selects to view the details of a specific event, its occurrence time is marked with a red dot.
a.【Event Information】 ⇒ Users can view the summary information of an event, including the site/unit the event belongs to, the alert setting status, the number of people queuing at that time (Event Queuing Number), the time the event occurred (Event Time), and the notification recipients (Notify Group).
b.【Max queue number at each counter】 ⇒ This chart shows the maximum queue number at each counter at each time point throughout the day. When the user selects to view the details of a specific event, its occurrence time is marked with a red dot.
E.【Notification List】 ⇒ Users can click on the notification icon ![]() to see all the received notification events.
to see all the received notification events.
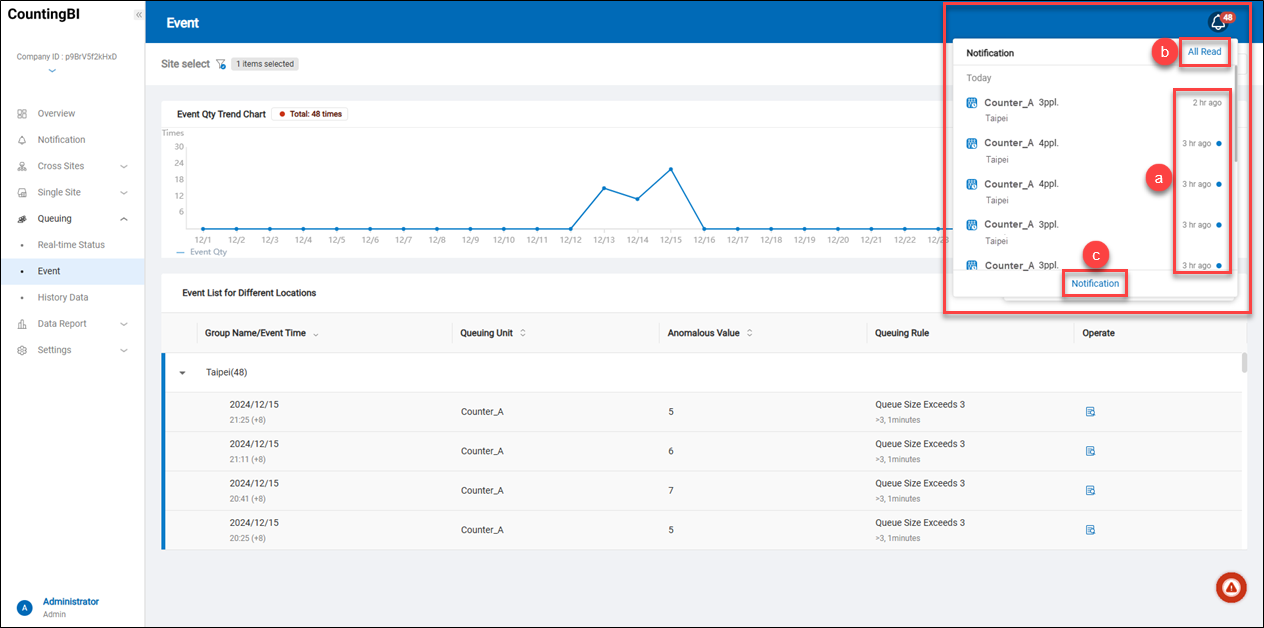 a.【How long ago did the event happen】 ⇒ It indicates the date when the event occurred. If the event happened today, it shows how long ago the event occurred. Unread events are marked with a blue dot.
b.【All Read】 ⇒ Users can click on "All Read" to mark all events as read in batch.
c.【Notification】 ⇒ Users can click on "Notification" to see all notifications. It will take users to the side function menu under Notification.
a.【How long ago did the event happen】 ⇒ It indicates the date when the event occurred. If the event happened today, it shows how long ago the event occurred. Unread events are marked with a blue dot.
b.【All Read】 ⇒ Users can click on "All Read" to mark all events as read in batch.
c.【Notification】 ⇒ Users can click on "Notification" to see all notifications. It will take users to the side function menu under Notification.
F.【Alert Info】 ⇒ Click on the Web Alert icon ![]() to view the latest alert notification in detail. In this notification, users can see the event happened on which brand, site and counting unit, how many queuing number at that time also show the how long the queue exceed event last.
In this notification, users can see the brand, site, and counting unit where the event occurred, the number of people queuing at that time, the notification rules, the time the event occurred, and how long the event of exceeding the queue limit lasted.
to view the latest alert notification in detail. In this notification, users can see the event happened on which brand, site and counting unit, how many queuing number at that time also show the how long the queue exceed event last.
In this notification, users can see the brand, site, and counting unit where the event occurred, the number of people queuing at that time, the notification rules, the time the event occurred, and how long the event of exceeding the queue limit lasted.
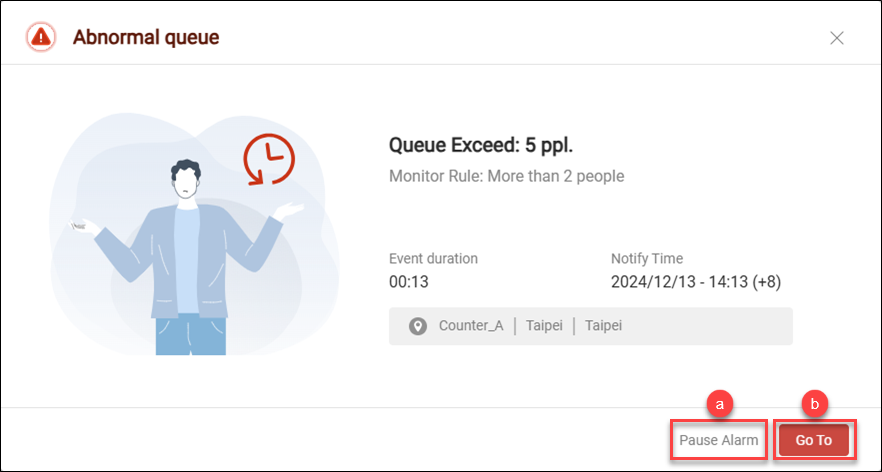 a.【Pause Alarm】 ⇒ Users can click on the "Pause Alarm" button to pause the web sound alert if the sound alert is enabled. It will also close the web pop-up notification.
b.【Go To】 ⇒ Click on this button. It will take users to the side function menu under Queuing -> Event to view more information.
a.【Pause Alarm】 ⇒ Users can click on the "Pause Alarm" button to pause the web sound alert if the sound alert is enabled. It will also close the web pop-up notification.
b.【Go To】 ⇒ Click on this button. It will take users to the side function menu under Queuing -> Event to view more information.
History Data
Through the historical statistical data on queue numbers, managers can gain a comprehensive understanding of the queue situation during different time periods. First, the "Average Queue at Service Counter" line chart provides the average queue numbers for each time segment, assisting managers in analyzing peak queue times and adjusting staffing levels accordingly. Second, the "Weekly Queue Heatmap" visually displays the average queue heatmap for different time segments each day over the course of a week, allowing managers to intuitively see which times or areas are more congested, thus helping to optimize on-site management and improve service efficiency.
 A.【Site Select】 ⇒ Click the filter icon
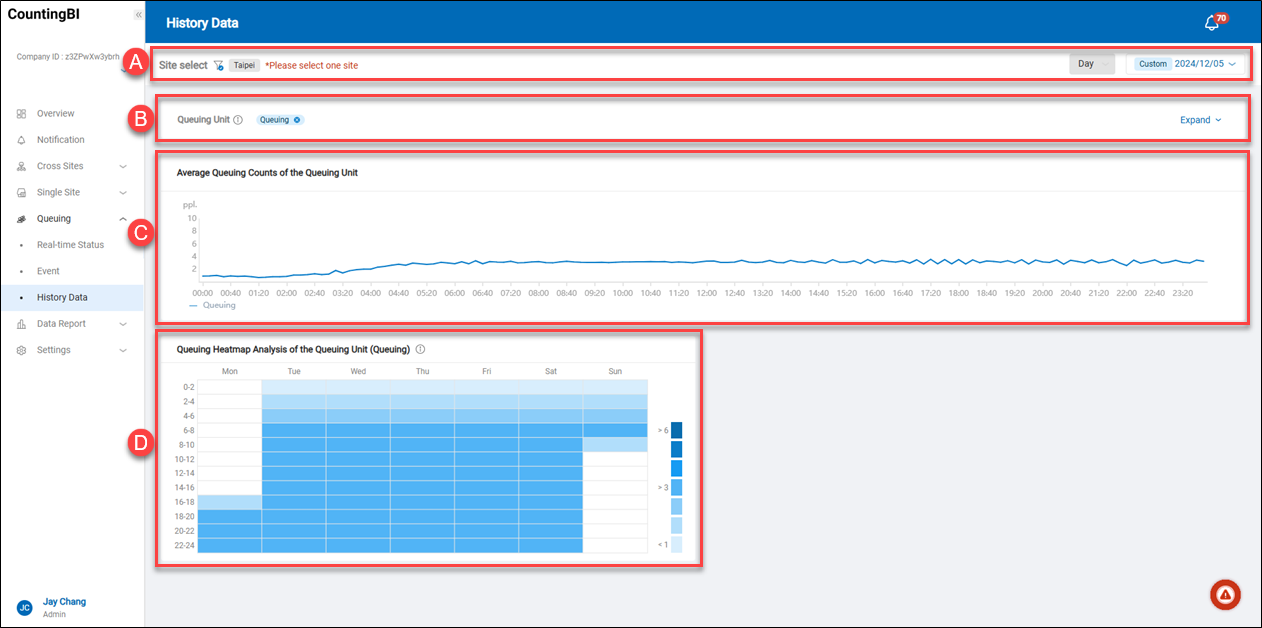
 ![]() to filter sites based on criteria such as country/region, region, site region, site type, or site name, and select a site to view.
B.【Queuing Unit Select】 ⇒ Based on the selected site, select the queue units to view, with a maximum of five units allowed.
C.【Average Queue at Each Counter】 ⇒ Using "Day" as the viewing period, this section presents the average queue numbers for each service counter (where each counter is a queue unit) for the day, with the chart showing average queue numbers at ten-minute intervals.
D.【Weekly Queue Heatmap】 ⇒ This section displays the average waiting numbers for different time segments each day over the course of a week. Managers can also click on the heatmap intensity scale to quickly and intuitively filter the average waiting heatmaps they wish to view.
to filter sites based on criteria such as country/region, region, site region, site type, or site name, and select a site to view.
B.【Queuing Unit Select】 ⇒ Based on the selected site, select the queue units to view, with a maximum of five units allowed.
C.【Average Queue at Each Counter】 ⇒ Using "Day" as the viewing period, this section presents the average queue numbers for each service counter (where each counter is a queue unit) for the day, with the chart showing average queue numbers at ten-minute intervals.
D.【Weekly Queue Heatmap】 ⇒ This section displays the average waiting numbers for different time segments each day over the course of a week. Managers can also click on the heatmap intensity scale to quickly and intuitively filter the average waiting heatmaps they wish to view.