Event Management
This page allows users to view and process all abnormal events.
On this page, the platform displays abnormal events that occurred in the monitoring stations of the current company. This includes trend analysis of dates and ongoing events, enabling users to have an overview of the latest event statuses when accessing this page. Users can filter events based on region, site, and specific dates to quickly find the events they wish to review.
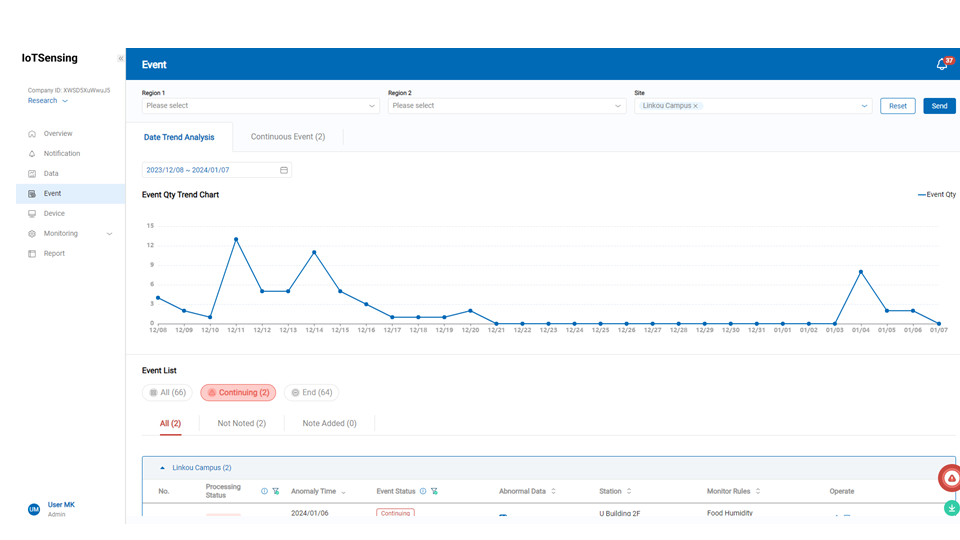
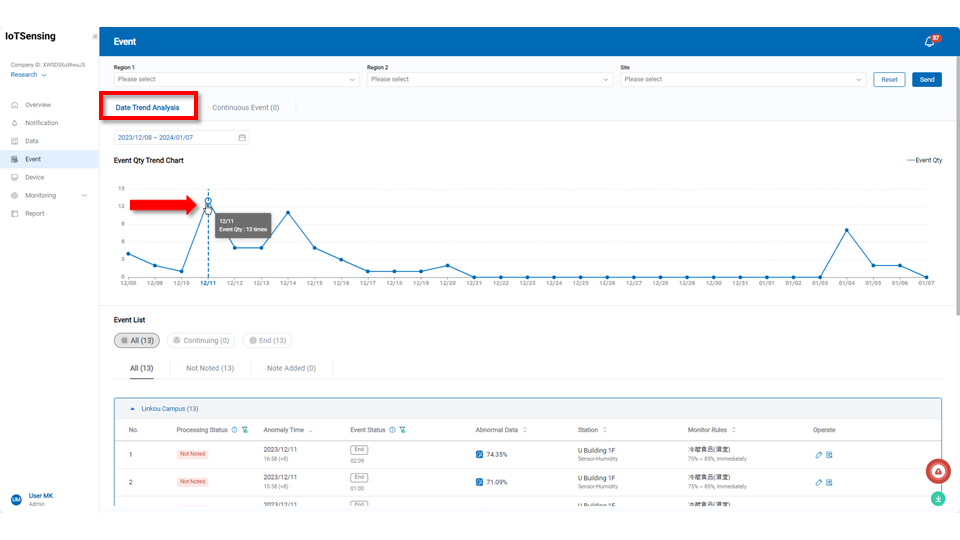
Event Qty Trend Chart
The Event Qty Trend Chart allows users to examine the trend of event quantity. Hovering the cursor over points on the line chart reveals the date and the corresponding number of events for that day.
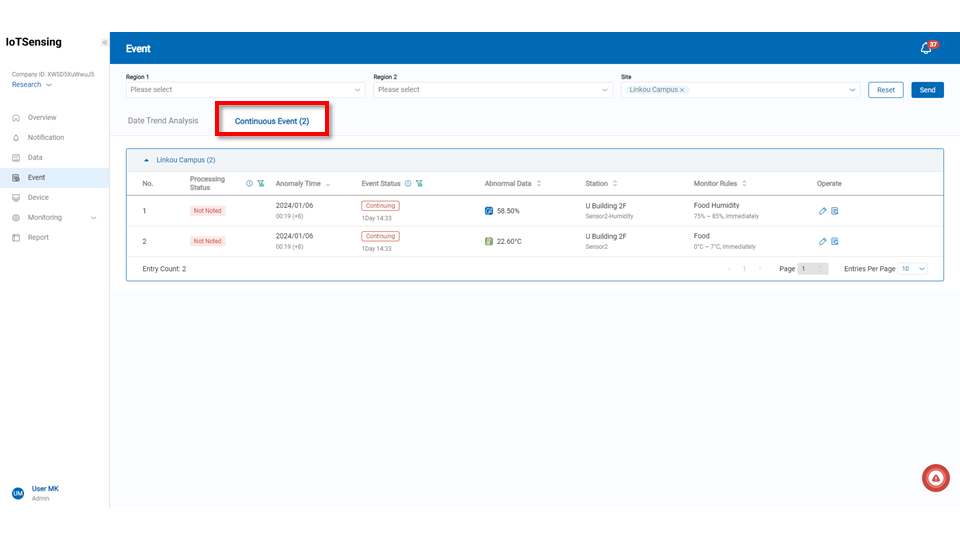
Continuous Event provide users with immediate insight into currently active events. Users can click the ![]() edit button or the
edit button or the ![]() view button in the action column to process the event.
view button in the action column to process the event.
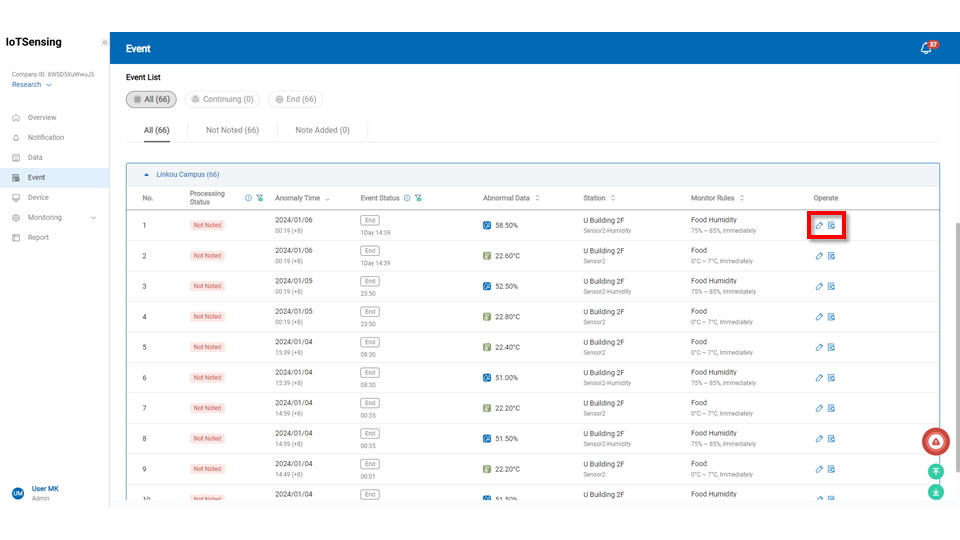
Event List
The Event List allows users to quickly determine whether an event is ongoing or concluded and whether it is not noted or noted. Events can be filtered rapidly based on all, ongoing, or concluded. After filtering, users can categorize events as all, not noted, or noted.
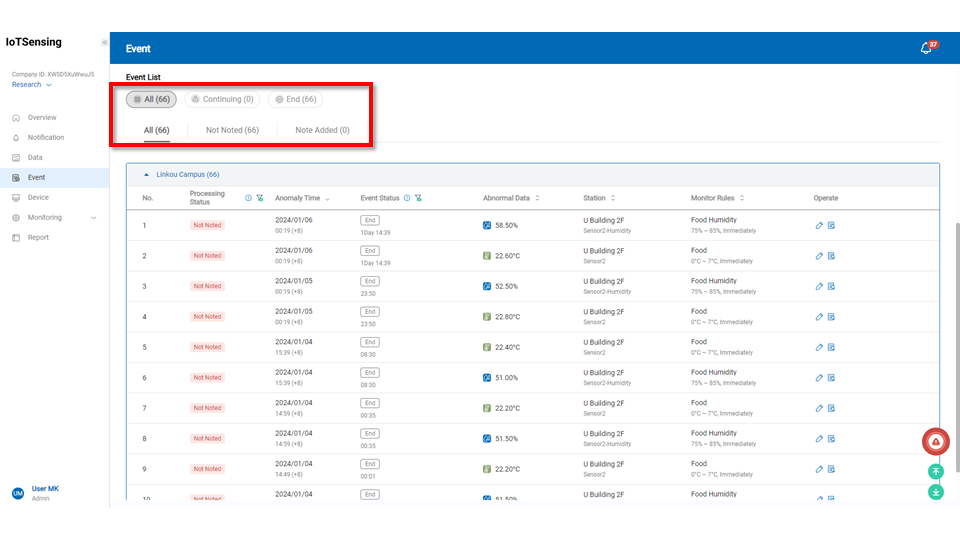
Users can identify events that require attention on this page. By clicking the ![]() edit button or the
edit button or the ![]() view button, users can process the event.
view button, users can process the event.
After clicking the ![]() edit icon or the
edit icon or the ![]() view icon, users with different permissions will have varying operations. Administrators can add notes to the event, while users can only view and cannot add notes. To dispose of the content, enter the text description and click the
view icon, users with different permissions will have varying operations. Administrators can add notes to the event, while users can only view and cannot add notes. To dispose of the content, enter the text description and click the ![]() apply button to save.
The processing status will change from not noted to noted, and a new line will be added to the notess section for each disposition action. If there are additional disposition actions, follow the same steps to input the text description and click the
apply button to save.
The processing status will change from not noted to noted, and a new line will be added to the notess section for each disposition action. If there are additional disposition actions, follow the same steps to input the text description and click the ![]() apply button to save.
apply button to save.
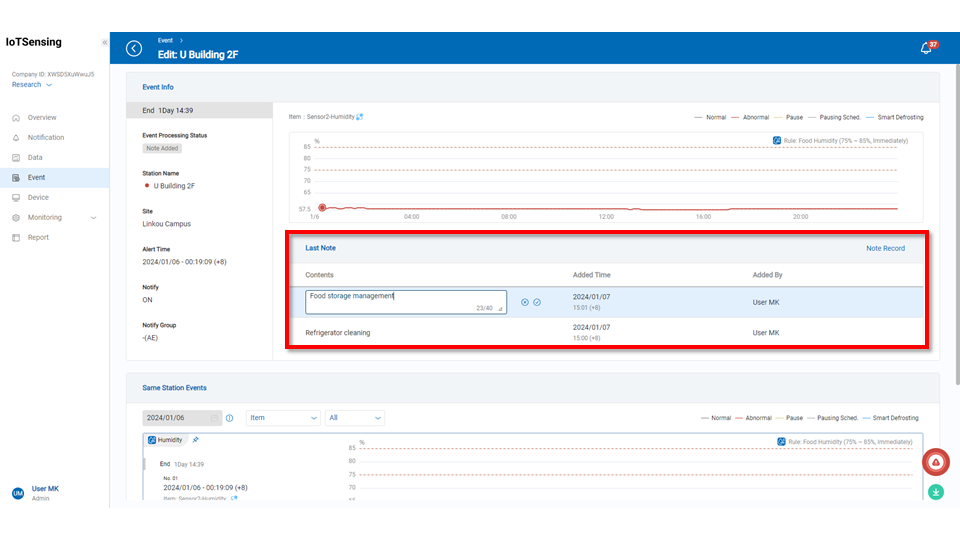 > Note: Entered dispositions cannot be modified afterward. Please ensure the text input is correct before applying.