Datasource Functions
Changelog
| Version | Author | Update date | Comment |
|---|---|---|---|
| 1.0.1 | Hao.Ning | 2023/08/10 | First Version |
| 1.0.2 | Hao.Ning /ITsung.Shen | 2024/07/31 | Add ReportGroupInfoDisable InspectionAreaStatsDisable InspectionStationStatsDisable InspectionHistory |
Alarmlog_record
Function name translation
en: ['alarmlog_record'],
zh_cn: ['报警记录'],
zh_tw: ['報警記錄'],
ja: ['レコード']
Description:
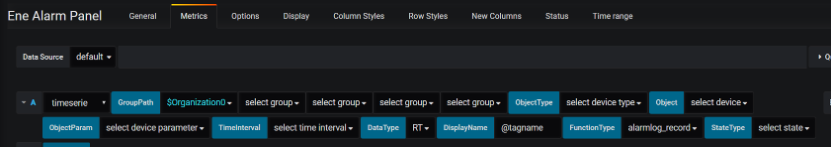
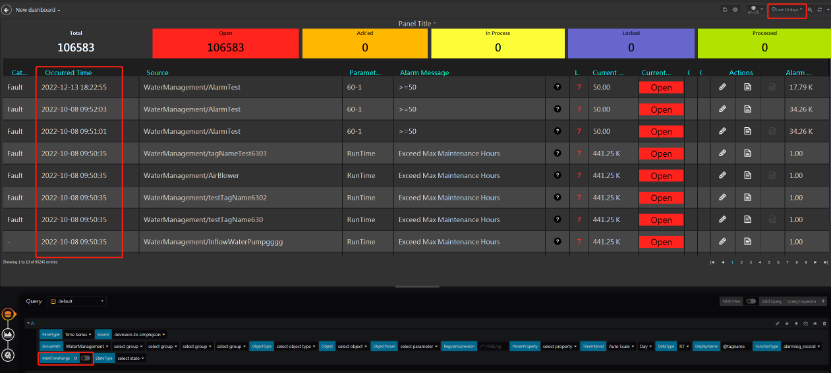
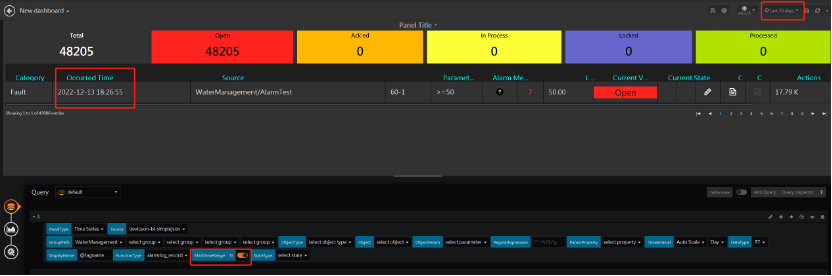
Return Realtime / Historical Alarm of specific group and its sub-groups within the selected time range. Notice that this function needs to collaborate with Ene Alarm Panel.
Input:
- GroupPath
- DataType:RT/HIS
- FunctionType:alarmlog_record
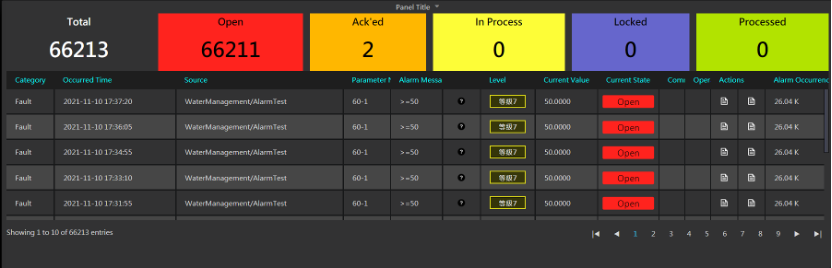
Return:
Table format:
- Alarm ID:Alarm ID
- Level:Alarm Level (1-8)
- Category:Alarm Category
- Occurred Time:Alarm start time
- Completed Time:Alarm completed time
- Total Time:Alarm total duration (in second)
- Source:Alarm source Group/Object name
- Tag Name:Alarm parameter name
- Alarm Message
- Additional Message URL:URL specified on Object setting
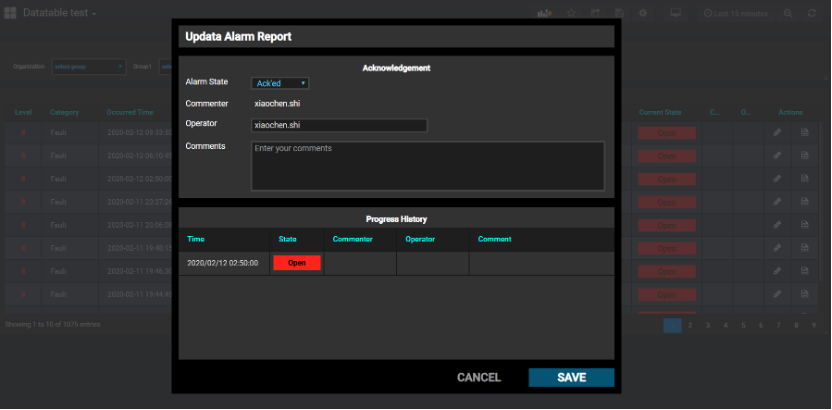
- Current State:Current alarm state (Closed,Open,Ack'ed,In Process,Locked,Processed)
- Commenter
- Operator
- Action:Change the alarm state on this field
- Current Value:The parameter value that trigger the alarm
- Alarm Occurrence:Parameter's alarm occurrence of this month.
Additional options:
When query for RT alarms, select the 'MarkTimeRange' checkbox
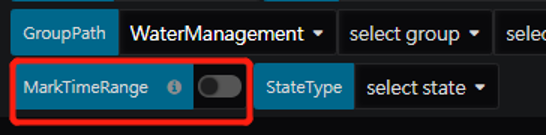
to enable the feature of limiting the alarm time range by using the "Dashboard.TimeRange".
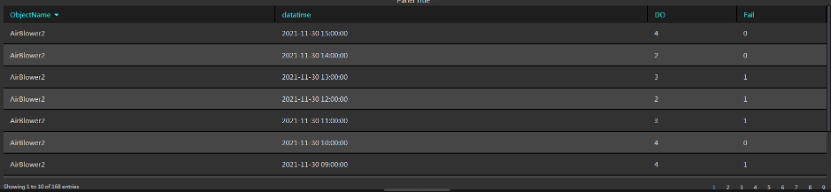
AlarmOccurrence
Function name translation:
en: ['alarmOccurrence'],
zh_cn: ['报警次数'],
zh_tw: ['報警次數'],
ja: ['アラーム回数']
Description:
Return the real-time alarm occurrences (regardless of time) or the number of historical alarms (alarms occurred within the Dashboard.TimeRange range) for the selected group or object.
Input:

- GroupPath
- Object
- DataType:RT/HIS
- FunctionType:alarmOccurrence
- TimeRange:(Optional) required for HIS alarm
Return:
Support two format: Table,Timeseries
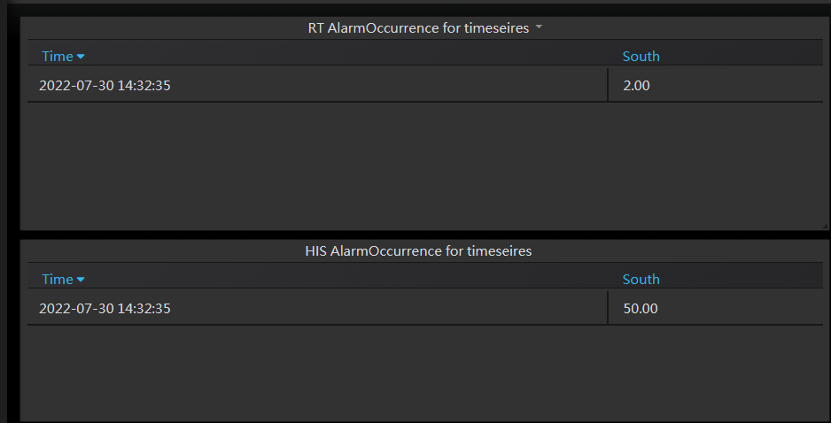 Timeserie format
- target: “GroupName or ObjectName”
- datapoints:
- alarm occurrence
- datapoints:
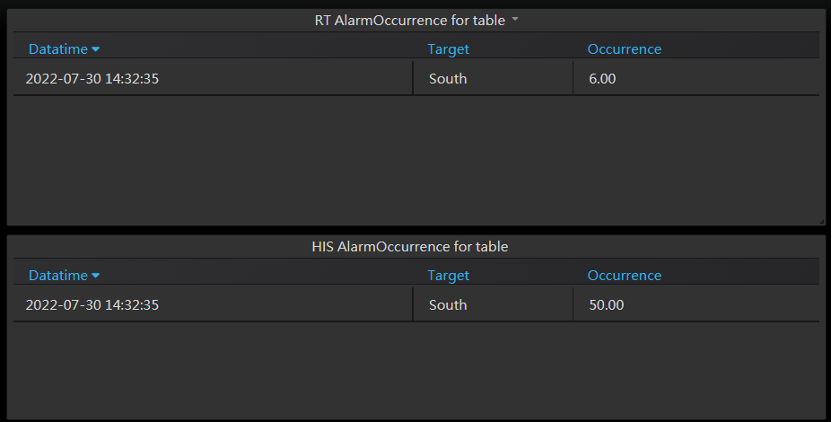
Table format:
- Datatime
- Target:Group name or Object name
- Occurrence:alarm occurrence
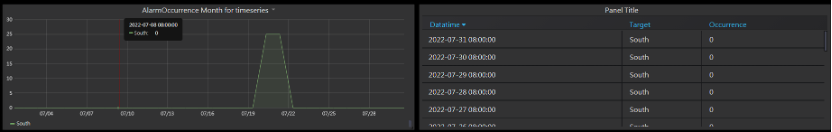
AlarmOccurrenceMonth
Function name translation:
en: ['alarmOccurrenceMonth'],
zh_cn: ['本月报警次数'],
zh_tw: ['本月報警次數'],
ja: ['今月のアラーム回数']
Description:
Return the number of HIS alarms triggered this month under the selected Group or object (The month is according to the month of selected Dashboard.TimeRange.endtime), with one record returned per day.
Input:

- GroupPath
- Object
- FunctionType:alarmOccurrenceMonth
- TimeRange
Return:
Support two format: Table,Timeseries
 TimeSeries:
- Datapoints
- daily alarm occurrence
Table:
- Datatime:
- Target:Group name or Object name
- Occurrence:daily alarm occurrence
AlarmStatusNum
Function name translation:
en: ['alarmStatusNum'],
zh_cn: ['报警状态数量'],
zh_tw: ['報警狀態數量'],
ja: ['アラーム状態数']
Description:
Return the number of real-time alarms in each processing state under the selected group.
Input:

- GroupPath
- FunctionType:alarmStatusNum
Return:
![]() TimeSeries:
TimeSeries:
- target: “Total”:Total number of RT alarm
- datapoints:
- status:-1
- target: “Open”:Number of alarm in "Open" state
- datapoints:
- status:5
- target: “Ack'ed”:Number of alarm in "Ack'ed" state
- datapoints:
- status:10
- target: “In Process”:Number of alarm in "In Process" state
- datapoints:
- status:15
- target: “Locked”:Number of alarm in "Locked" state
- datapoints:
- status:20
- target: “Processed”:Number of alarm in "Processed" state
- datapoints:
- status:25
GroupAvail
Function name translation:
en: ['groupAvail'],
zh_cn: ['组时间稼动率'],
zh_tw: ['組時間稼動率'],
ja: ['グループ有効性']
Description:
Calculate the "Group Availability" of all the objects under the Group and its sub-group within the specified time range.
Input:

- GroupPath
- Object:any objects that you want to calculate
- ObjectParam:Select a discrete parameter with state defined as
- 0: OFF
- 1: RUN
- 2: Idle
- 3: Down/Alarm
- 4: Schedule Off
- FunctionType:groupAvail
Return:
![]() Table Format,Time duration of five states + Availability
Table Format,Time duration of five states + Availability
- Off (second)
- Run (second)
- Idle (second)
- Down (second)
- Schedule (second)
- Availability:Group Availability (%), Run/(Run+Idle+Down)*100%
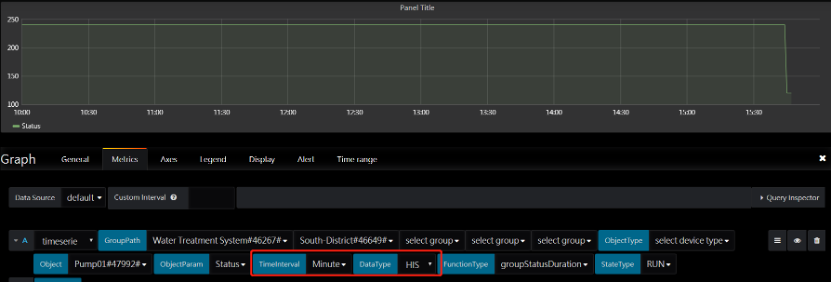
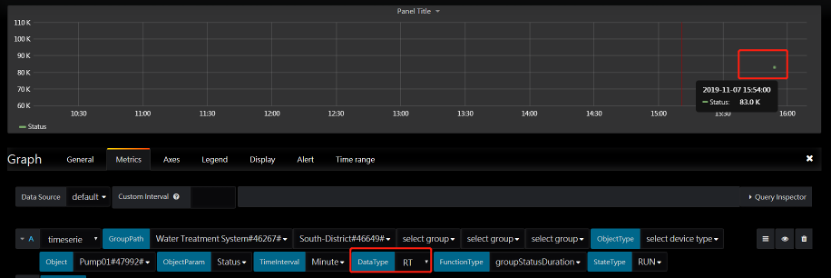
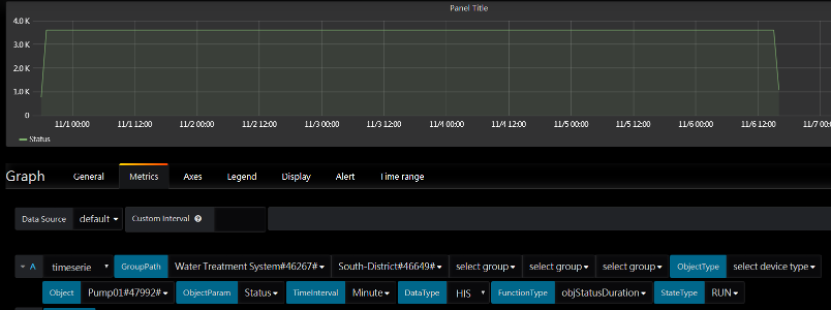
GroupStatusDuration/GroupStatusOccurrence
Function name translation:
en: ['groupStatusDuration'],
zh_cn: ['组状态持续时间'],
zh_tw: ['組狀態持續時間'],
ja: ['グループステータス']

en: ['groupStatusOccurrence'],
zh_cn: ['组状态发生次数'],
zh_tw: ['組狀態發生次數'],
ja: ['グループ状態発生']
Description:
For objects in selected group and its sub-group, calculate the sum of selected discrete parameter’s state duration / occurrence
Input:

- GroupPath
- Object
- ObjectParam:A discrete parameter being calculated
- FunctionType:groupStatusDuration/ groupStatusOccurrence
- TimeInterval:Time interval of historical data
- Datatype:RT(return total within selected time range) /HIS (return result per time Interval)
- StateType:Parameter’s state that you want to calculate
Return:
Timeserie format, return the sum of selected discrete parameter’s state duration / occurrence
ObjectAvail
Function name translation:
en: [objectAvail],
zh_cn: ['对象时间稼动率'],
zh_tw: ['對象時間稼動率'],
ja: ['オブジェクトの可用性']
Description:
Return the Availability of selected objects (with specified parameter)
Input:

- GroupPath
- Object:object to be calculated
- ObjectParam:Select a discrete parameter with state defined as
- 0: OFF
- 1: RUN
- 2: Idle
- 3: Down/Alarm
- 4: Schedule Off
- FunctionType:objAvail
Return:
 Table Format,Time duration of five states + Availability
- Off (second)
- Run (second)
- Idle (second)
- Down (second)
- Schedule (second)
- Availability: Object Availability (%), Run/(Run+Idle+Down)*100%
ObjStatusDuration/ObjStatusOccurrence
Function name translation:
en: ['objStatusDuration'],
zh_cn: ['对象状态持续时间'],
zh_tw: ['對象狀態持續時間'],
ja: ['オブジェクトの状態']

en: ['objStatusOccurrence'],
zh_cn: ['对象状态发生次数'],
zh_tw: ['對象狀態發生次數'],
ja: ['オブジェクトの状態']
Description:
Calculate the sum of selected discrete parameter’s state duration / occurrence
Input:

- GroupPath
- Object
- ObjectParam:A discrete parameter being calculated
- FunctionType:objStatusDuration/ objStatusOccurrence
- TimeInterval:Time interval of historical data
- Datatype:RT(return total within selected time range) /HIS (return result per time Interval)
- StateType:Parameter’s state that you want to calculate
Return:
Timeserie format, return the sum of selected discrete parameter’s state duration / occurrence
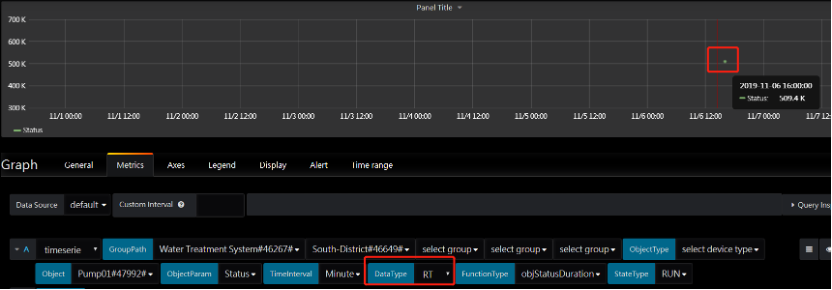
ObjectsMonitor
Function name translation:
en: ['objectsMonitor'],
zh_cn: ['对象监视器'],
zh_tw: ['對象監視器'],
ja: ['オブジェクトモニタ']
Description:
In org and its sub-orgs, monitor the status of objects that contain these 2 parameters:
- Status (discrete)
- A discrete parameter that indicates the object status, which need to contain the following state:
- 0: OFF
- 1: RUN
- 2: Idle
- 3: Down/Alarm
- 4: Schedule Off
- The data should come from your device or a calculation parameter.
- A discrete parameter that indicates the object status, which need to contain the following state:
- Runtime (analog)
- A counter of running time (in minute), the data should come from your device or a calculation parameter.
Input:
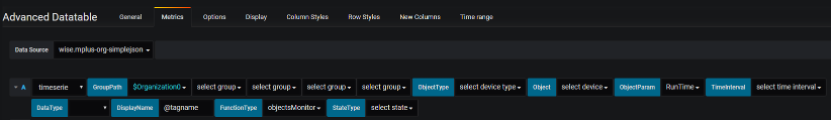
- GroupPath
- ObjectParam
- FunctionType:objectsmonitor
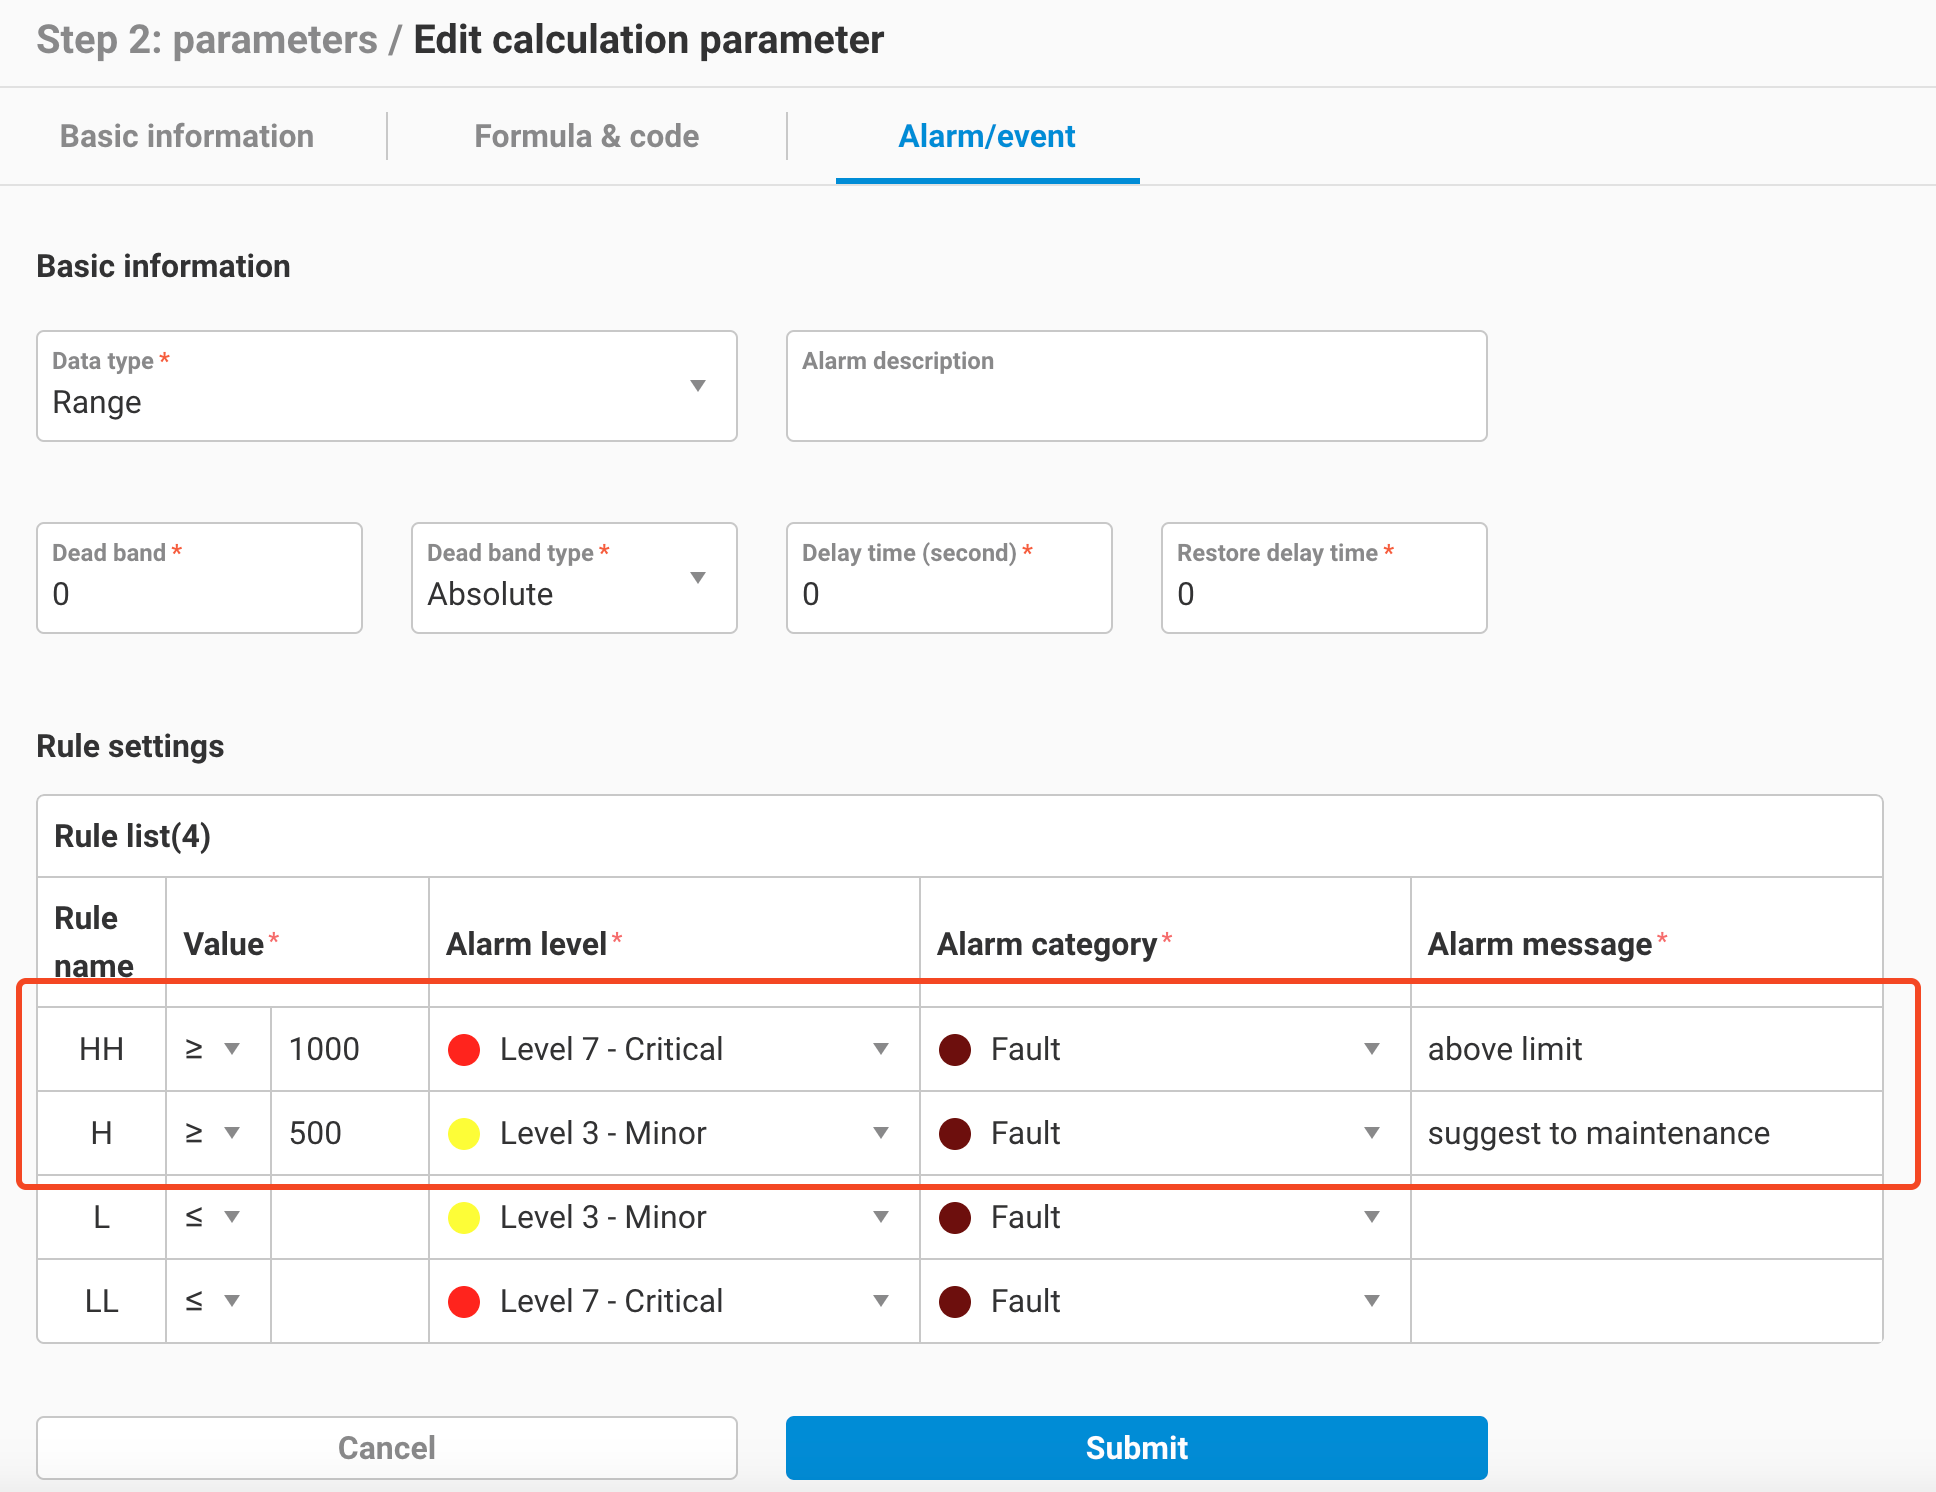
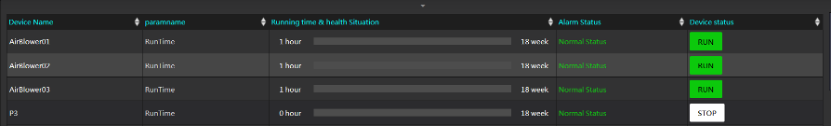
Return:
Table format
- Objectname
- Paramname
- Objruntime:Device Status (Array)
- 0:tagvalue
- 1:SpanHi
- 2:H
- 3:HH
- Almstat:alarm status
- Status:value of the “Status” parameter
Ringratio
Function name translation:
en: ['ringRatio'],
zh_cn: ['环比'],
zh_tw: ['環比'],
ja: ['ループひ']
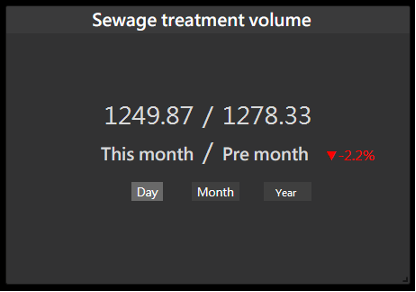
Description:
Compare the selected parameter value with the previous time interval (currently support day / month)
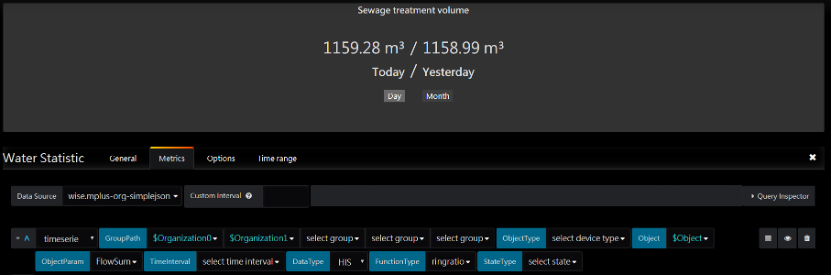
Use this function with water-statistic-panel
Input:

- GroupPath
- Object
- ObjectParam
- FunctionType:ringratio
Return (use water-statistic-panel):
Timeserie format:
- Datapoints:(Array)
- 0:Today
- 1:Yesterday
- 2:This month
- 3:Last month
- 4:Same day last month
- 5:Same hour yesterday
- Daypercent:(Today-Yesterday) / Yesterday (in %)
- Mongthpercent:(This month-Last month) / Last month (in %)
- Samedaypercent:(This month - Same day last month )/ Same day last month (in %)
- Samehourpercent:(Today- Same hour yesterday) / Same hour yesterday (in %)
Use this function with other panel
When using this function with other panel, you can change “query type” for table or timeseries return format.
Input:
- GroupPath
- Object
- ObjectParam
- TimeInterval:Compare the parameter by day / month (Currently only support these 2 options)
- FunctionType:ringratio
Return:
Timeserie format:
- Target:This (This month or Today)
- Datapoint:[[value,timestamp]]
- Target:Last (Last month or Yesterday)
- Datapoint:[[value,timestamp]]
- Target:Diff (Difference in %)
- Datapoint:[[|this.value – last.value| / this.value ,timestamp]]
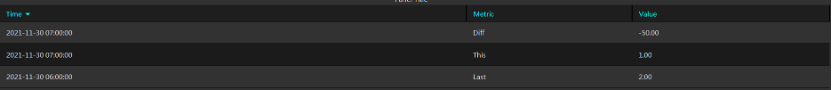
Table format:
- Parameter:Parameter Name
- This:This month or Today
- Last:Last month or Yesterday
- Diff:Difference ratio in %
![]()
Worldmap
Function name translation:
en: ['worldmap'],
zh_cn: ['世界地图'],
zh_tw: ['世界地圖'],
ja: ['世界地図']
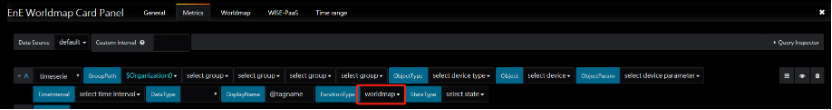
Description:
Display Group Map Card Information of selected org and its sub-orgs which contain the following parameter:
- status (Discrete):
- Group status, which need to contain the following state:
- 0:Normal
- 1:Warning
- 2:Critical
- The data should come from your device or a calculation parameter. Please noted that this function needs to collaborate with EnE WorldMap Card Panel
- Group status, which need to contain the following state:
Input:
- GroupPath
- FunctionType:worldmap
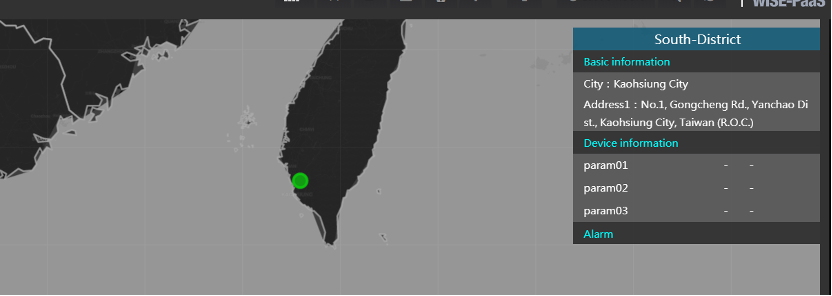
Return:
Table format:
- Hostname:Card title
- Latitude
- Longitude
- Status
- TittleColor:Card title background color
- Width:Card width
- Height:Card height
- GlobalFont:Global Font Css(Object)
- Content:Card Content(Array)
- Subtitle
- SubtitleStyle
- subcontentStyle
- Type:Subcontent type(img,link,string,table)
- Content:
- Desc:description
- Label
- Paramname:Parameter Name
- Unit
- Value
Efficiency Ratio
Function name translation:
en: ['efficiencyRatio'],
zh_cn: ['效率比'],
zh_tw: ['效率比'],
ja: ['効率比']
Description:
Calculate the ratio of A Parameter / B Parameter (Parameter A & B must within same object). You can change DataType for different return result:
- RT (realtime data ratio)
- RTData A / RTData B
- HIS (historical data ratio trend)
- One HIS data ratio per TimeInterval
Input:
- GroupPath
- Object
- ObjectParam * 2, Input manually by this format: {P1,P2} for the result P1/P2
- Datatype:RT /HIS
- FunctionType:efficiencyRatio
- TimeInterval:
- Hour: Calculate A Parameter Hourly data/ B Parameter Hourly data
- Day: Calculate A Parameter Daily data/ B Parameter Daily data
- Month: Calculate A Parameter Monthly data/ B Parameter Monthly data
- Year: Calculate A Parameter Yearly data/ B Parameter Yearly data
Return
Timeserie format,
- RT (realtime data ratio)
- RTData A / RTData B
- HIS (historical data ratio trend)
- One HIS data ratio per TimeInterval
---
YoY
Function name translation:
en: ['YoY'],
zh_cn: ['同比'],
zh_tw: ['同比'],
ja: ['前年同期比']
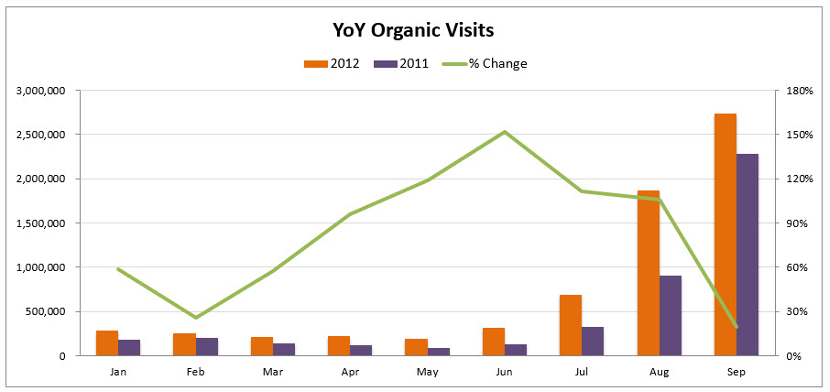
Description:
Calculate “Year on Year” data of selected parameter. (Currently support day, month, year data)
Input:
- GroupPath
- Object
- ObjectParam: target parameter
- FunctionType:YoY

Return:
Timeserie format:
- Datapoints:(Array)
- 0:Today
- 1:Same day last year
- 2:This Month
- 3:Same month last year
- 4:This Year
- 5:Last Year
- Daypercent:(Today- Same day last year) / Same day last year
- Mongthpercent:(This month - Same month last year) / Same month last year
- Yearpercent:(This year - Last year) / Last year
Diagram:
YoY Trend
Function name translation:
en: ['YoYTrend'],
zh_cn: ['同比趋势'],
zh_tw: ['同比趨勢'],
ja: ['前年同期比の傾向']
Description:
Calculate the “Year on Year” trend of specific parameter (Currently support day, month, year data) with in specific time range.
Input:
- GroupPath
- Object
- ObjectParam
- FunctionType: YoYTrend
- TimeInterval:
- Min: no support, return same data as Day.
- Hour: (This hour - Same hour yesterday) / Same hour yesterday, One data per hour.
- Day: (Today- Same day last year) / Same day last year, One data per day.
- Month: (This month - Same month last year) / Same month last year, One data per month.
- Year: (This year - Last year) / Last year, One data per year.
Return:
Timeserie format
- target: “Current”
- datapoints:
- Trend of current data, one data per TimeInterval (hour/day/month/year)
- datapoints:
- target: “Past”
- datapoints:
- Trend of past data (same hour yester or same TimeInterval last year for Day/Month/Year), one data per TimeInterval (day/month/year).
- datapoints:
- target: “ratio”
- datapoints:
- YoY ratio per TimeInterval (hour/day/month/year)
- datapoints:
Diagram
Vertical Ratio
Function name translation:
en: ['verticalRatio'],
zh_cn: ['纵比'],
zh_tw: ['縱比'],
ja: ['垂直比']
Description:
Calculate the vertical ratio of A Parameter & B Parameter (Parameter A & B must within same object). The formula of vertical ratio is (A Parameter - B Parameter) / B Parameter
Input:
- GroupPath
- Object
- ObjectParam * 2, Input manually by this format: {A,B} for parameter A & B
- FunctionType:verticalRatio
Return:
Timeserie format
- Datapoints:(Array)
- 0:Today (A)
- 1:Today (B)
- 2:This Month (A)
- 3:This Month (B)
- 4:This Year (A)
- 5:This Year (B)
- Daypercent:(TodayA - TodayB) / TodayB
- Mongthpercent:(ThisMonthA – ThisMonthB) / ThisMonthB
- Yearpercent:(ThisYearA- ThisYearB) / ThisYearB
Diagram:

ReportAnalogBasic
Function name translation:
en: ['reportAnalogBasic', 'report'],
zh_cn: ['报告模拟量基本信息', '报告'],
zh_tw: ['報告類比量基本資訊', '報告'],
ja: ['アナログ量の基本情報のレポート', 'レポート作成']
Description:
Return 1 to multiple selected parameters’ last/max/min/avg historical data in table format (one data per TimeInterval). Currently only support Analog parameter. Notice that this function needs to collaborate with ene-report-panel.

Input:

- GroupPath
- Object
- ObjectParam:one to multiple parameters that you want to display. The input format could be:
- {param01,param02,…}
- (param01|param02,….)
- Param01,param02,….
- FunctionType:reportAnalogBasic
- TimeInterval:Time interval of data
Return:
 Table format:
- Objname:Selected parameter’s object name
- Datatime:data time
- Parameter.last:Selected parameter’s last value
- Parameter.avg:Selected parameter’s average value
- Parameter.max:Selected parameter’s max value
- Parameter.min:Selected parameter’s min value
ReportGroupInfo
Function name translation:
en: ['reportGroupInfo'],
zh_cn: ['报告组织数据'],
zh_tw: ['報告組織資料'],
ja: ['レポート・グループ情報']
Description:
Return basic group information (Postal code, Location (Group Name), Address (Address1 + Address2)) and Parameter data for each object under each location (group). The detailed function description is as follows:
-
Each group, for each time interval, is one row.
-
Each row content = [time, Postal code, Location (Group Name), Address (Address1 + Address2), object01(param01), object02(param01), ..., object01(param02), ...]
-
Multiple queries need to be configured for usage, each query selecting its own Group
- Each query can choose different data types, including RT/HIS/HIS_AVG/HIS_MIN/HIS_MAX
- Each query can choose different time intervals, supporting recording rate/hour/day/month/year
-
Each query can select only its parameters without choosing objects, listing all selected same-named parameter values under this group, presented in the format
objectName:parameterName, one column per parameter. -
All Queries selecting the reportGroupInfo function will be merged into one table and returned. If the same parameter name exists in different rows, it will be merged into one column, example as follows:
-
QueryA; Group1 => Param1 (in obj1, Obj2)
-
QueryB: Group2 => Param1 (in obj2, obj3), Param2 (in obj2)
Time Postal code Location Address Obj1:Param1 Obj2:Param1 Obj3:Param3 Obj2:Param2 t 100 Group1 addr-G1 10 20 - - t 101 Group2 addr-G2 - 30 40 55
-
-
Table columns are sorted by Query and Parameter order, within the same Query, the same Parameter is sorted by objectName, and the length is auto-extended.
-
For parameters not existing in the group, the value is returned as ‘-‘.
-
If a query selects only one parameter, display name is supported.
-
If a query selects multiple parameters, display name is not effective.
-
If different parameters across multiple queries are set to the same display name, they will be displayed as the same column. Users should be aware.
-
If two queries select the same named parameter and the display name is the same, they will be merged into one column.
-
If two queries select the same named parameter but the display name is different, they will be split into two columns.
Input:
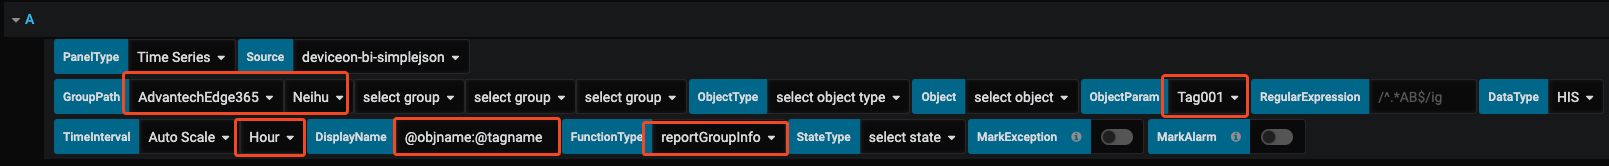
-
GroupPath:select the group that you want to display
-
Object:optional
-
ObjectParam:one to multiple parameters that you want to display. The input format could be:
- {param01,param02,…}
- (param01|param02,….)
- Param01,param02,….
-
DataType:RT/HIS/HIS_AVG/HIS_MIN/HIS_MAX
-
TimeInterval:recording rate / hour / day / month /year
-
FunctionType:reportGroupInfo
-
DisplayName:
- Please manually modify to @objname:@tagname to enable the display format
objectName:parameterName, or change to a custom display name. - Modifying the display name is only supported if a query selects a single parameter.
- Please manually modify to @objname:@tagname to enable the display format
Return:
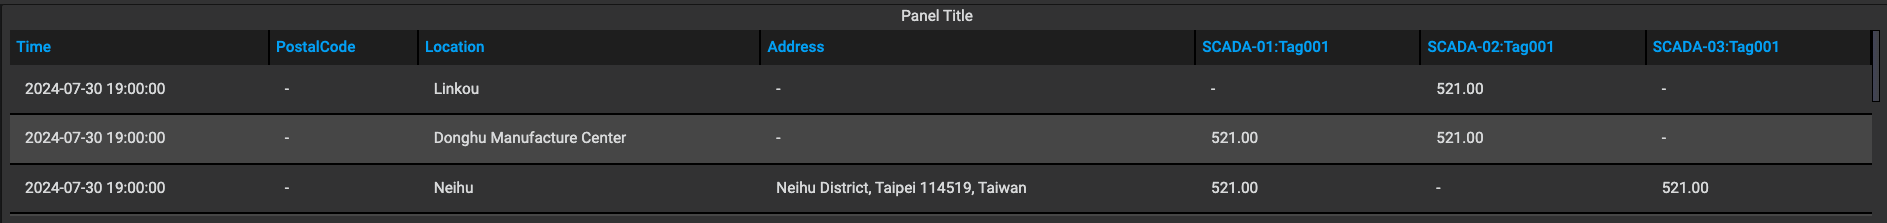
Table format:
-
Datatime
-
PostalCode
-
Location:
-
Address:
-
Object1:Parameter1
-
Object2:Parameter1
-
Object3:Parameter1
-
…
-
Object1:Parameter2
-
Object2:Parameter2
-
Object3:Parameter2
-
…
ReportMerged
Function name translation:
en: ['reportMerged'],
zh_cn: ['报告合并'],
zh_tw: ['報告合併'],
ja: ['レポートマージ']
Description:
Merge multiple parameter’s RT / HIS data into one row per TimeInterval. Return the table format with first column as the Object Name and one column for one parameter for the rest.
Input:
![]()
- GroupPath
- Object
- ObjectParam:one to multiple parameters that you want to display. The input format could be:
- {param01,param02,…}
- (param01|param02,….)
- Param01,param02,….
- TimeInterval:Day/Month
- FunctionType:reportMerged
Return:
Table format:
- ObjectName
- Datatime
- Parameter01:
- Parameter02:
- …
ReportMergedObject
Function name translation:
en: ['reportMergedObject'],
zh_cn: ['报告物件合并'],
zh_tw: ['報告物件合併'],
ja: ['物件統合のレポート']
Description:
Merge multiple parameter’s RT / HIS data into one row per TimeInterval. Return the table format with first column as the parameter name and one column for one object with that parameter for the rest. The function is the opposite of the "ReportMerged" function.
Input:

- GroupPath
- Object
- ObjectParam:one to multiple parameters that you want to display. The input format could be:
- {param01,param02,…}
- (param01|param02,….)
- Param01,param02,….
- TimeInterval:Day/Month
- FunctionType:reportMergedObject
Return:
Table format:
- ParameterName
- Datatime
- Object01:
- Object02:
- …
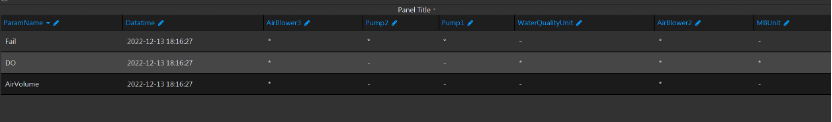
RopertMonthBasic
Function name translation:
en: ['reportMonthBasic'],
zh_cn: ['报告月份数据'],
zh_tw: ['報告月份資料'],
ja: ['レポート月']
Description:
Return the Monthly statistical data of multiple parameters, incudes this month and last N month
Input:
- GroupPath
- Object
- ObjectParam: one to multiple parameters that you want to display. The input format could be:
- {param01,param02,…}
- (param01|param02,….)
- Param01,param02,….
- FunctionType:reportMonthBasic
Return:
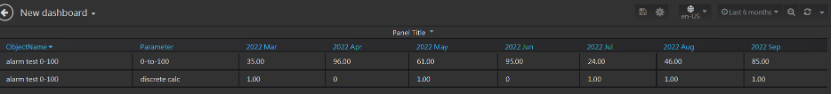 Table format:
- ObjectName
- Parameter
- …Months:last N month, started from the selected time range. One month per column.
- ThisMonth:Value of this month
ReportMonthStatistic
Function name translation:
en: ['reportMonthStatistic'],
zh_cn: ['报告月份统计数据'],
zh_tw: ['報告月份統計資料'],
ja: ['レポート月統計']
Description:
Return the Monthly statistical data of multiple parameters, incudes this month, last N month (by selected time range), average of Last N month, average of this year, and goal value.
Input:
![]()
- GroupPath
- Object
- ObjectParam: one to multiple parameters that you want to display. The input format could be:
- {param01,param02,…}
- (param01|param02,….)
- Param01,param02,….
- FunctionType:reportMonthStatistic
Return:
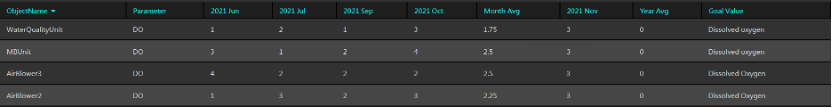 Table format:
- ObjectName
- Parameter
- …Months:last N month, started from the selected time range. One month per column.
- MonthAvg:Average of last N month
- ThisMonth:Value of this month
- YearAvg:Average value of this year.
- GoalValue:Goal value of this parameter, currently display the Parameter Description of this Parameter.
GroupStatusOccurrenceTable/ GroupStatusDurationTable
Function name translation:
en: ['groupStatusOccurrenceTable'],
zh_cn: ['组状态发生表'],
zh_tw: ['組狀態發生錶'],
ja: ['グループ状態発生表']

en: ['groupStatusDurationTable'],
zh_cn: ['组状态持续时间表'],
zh_tw: ['組狀態持續時間表'],
ja: ['グループの状態']
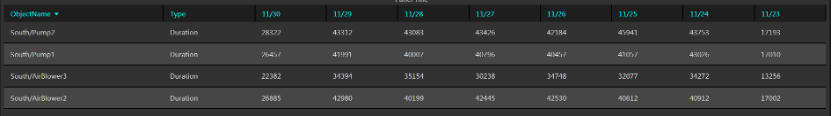
Description:
Return the daily / monthly statistical data of parameter status occurrence or duration. All objects that contain the selected parameter within selected group and its sub-groups would be included automatically. One object per row and one TimeInterval (Day/Month) per column.
Input:

- GroupPath
- Object
- ObjectParam:one to multiple parameters that you want to display. The input format could be:
- {param01,param02,…}
- (param01|param02,….)
- Param01,param02,….
- TimeInterval:Day/Month
- FunctionType:groupStatusDurationTable/ groupStatusOccurrenceTable
- StateType:state of discrete parameter that you want to montior
Return:
Table format:
- ObjectName
- Type:Duration/Occurrence
- Datatime01: Today or This Month
- Datatime02:Yesterday or Last Month
- Datatime03: 2 days before or 2 Month before
- …
GroupStatusAlarmOccurrence
Function name translation:
en: ['groupStatusAlarmOccurrence'],
zh_cn: ['组状态报警发生次数'],
zh_tw: ['組狀態報警發生次數'],
ja: ['グループ状態アラーム発生']
Description:
Return group or object status and number of alarms this month. All objects that contain the selected discrete parameter within selected group and its sub-groups would be included automatically.
Input:

- GroupPath
- Object
- ObjectParam:A discrete parameter that indicate the group or object status. Please note that you have to set the alarm rule on this parameter, so that this function can monitor the number of alarms of this parameter this month.
- FunctionType:groupStatusAlarmOccurrence
Return:
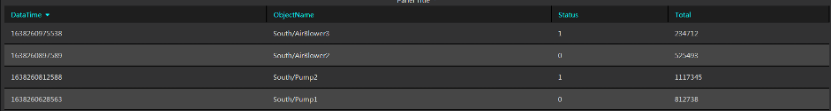
Table format:
- Datatime
- ObjectName
- Status:Current value of selected ObjectParam
- Total:ObjectParam’s number of alarm this month
SysOperationLog
Function name translation:
en: ['SysOperationLog'],
zh_cn: ['系统操作日志'],
zh_tw: ['系統操作日誌'],
ja: ['システム操作ログ']
Description:
Use this function to get EdgeHub's system operation logs
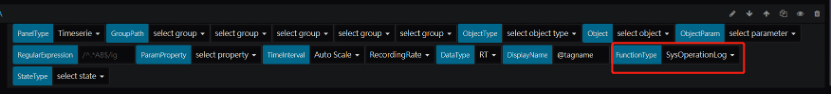
Return:
Use this function together with Ene Event Log Panel
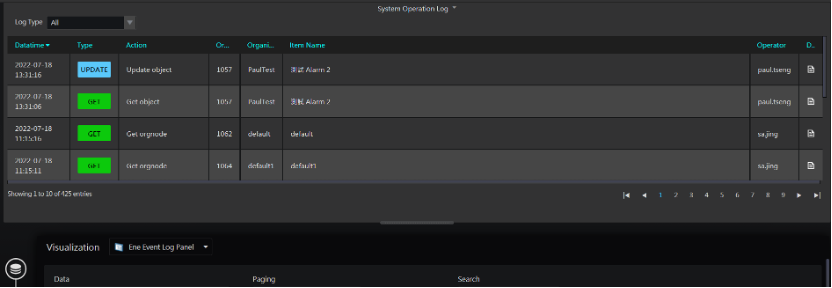
In Ene Event Log Panel, open Log Type setting and filter the log type on it.
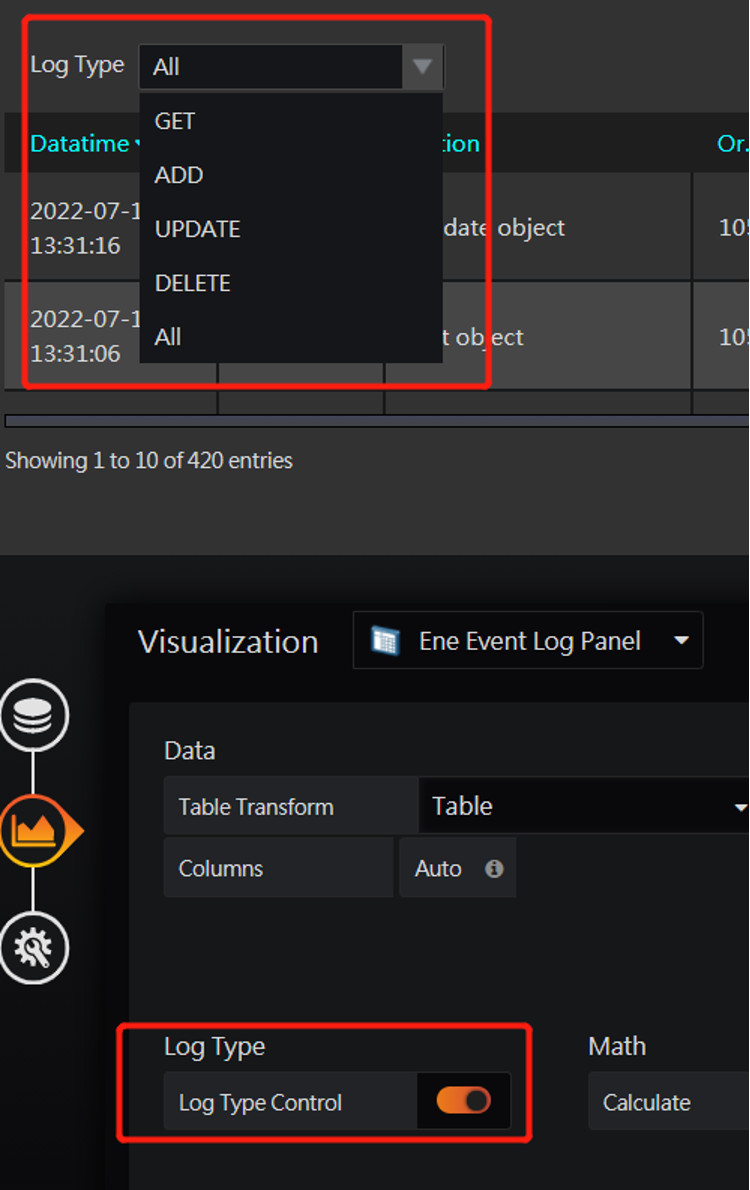
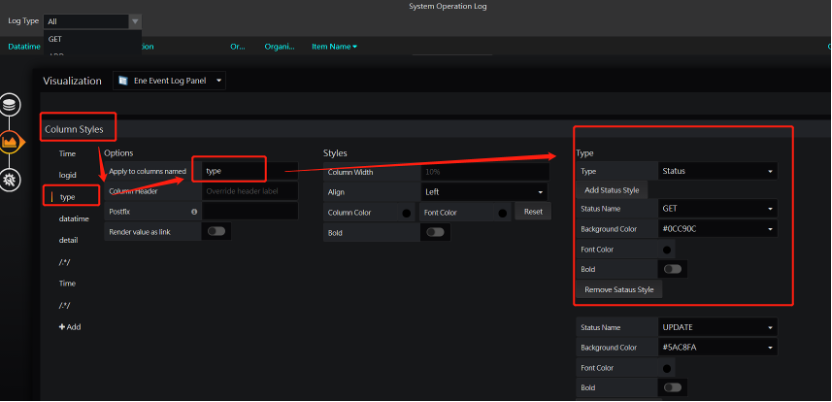
Each Log Type can be set diffenent display style in Column Styles setting.
SystemLog
Function name translation:
en: ['SystemLog'],
zh_cn: ['系统日志'],
zh_tw: ['系統日誌'],
ja: ['システムログ']
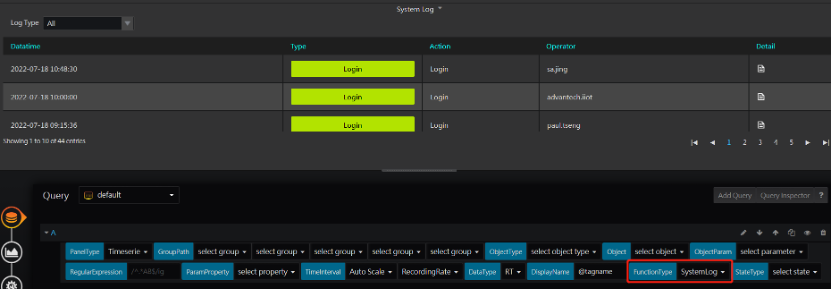
Return:
Return the login / logout logs of EdgeHub portal.
Please refer to SysOperationLog function for futher setting details.
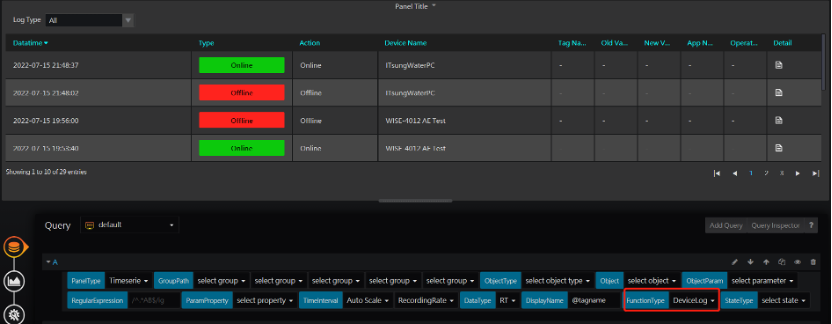
DeviceLog
Function name translation:
en: ['DeviceLog'],
zh_cn: ['设备日志'],
zh_tw: ['設備日誌'],
ja: ['デバイスログ']
Return:
Return devices offline / online logs of EdgeHub. Please refer to SysOperationLog function for futher setting details.
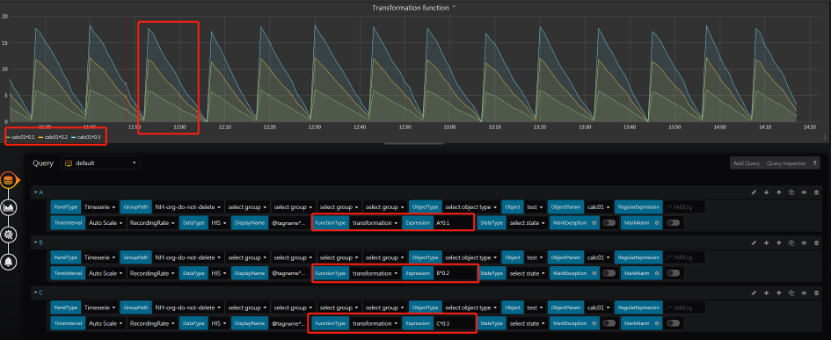
Transformation
Function name translation:
en: ['transformation'],
zh_cn: ['转换'],
zh_tw: ['轉換'],
ja: ['変形']
Description:
Perform simple mathematical operations on the RT/HIS/HIS_AVG/HIS_MIN/HIS_MAX data of selected parameters. 
After selecting "Transformation function," you need to configure an "Expression" for calculation. The entered formula is only valid for the current query. Currently, supported calculations include +, -, *, /, and ().
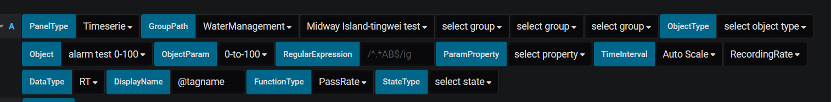
PassRate
Function name translation:
en: ['PassRate'],
zh_cn: ['合格率'],
zh_tw: ['合格率'],
ja: ['通過率']
Description:
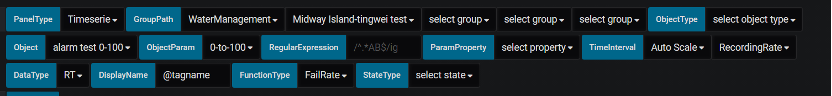
Return the percentage of days for a parameter with valid data greater than 0 within the TimeRange, calculated by (number of days with valid data greater than 0 / total number of days with valid data) * 100%, and return the result in timeseries format.
Input:
- GroupPath
- Object
- ObjectParam: A parameter that specify pass or not. For the meanning of the parameter value:
- any value less or equal to 0: means fail
- any value greater than 0, means pass
- TimeRange:Dashboard.TimeRange, range of days to be calculated
- FunctionType:PassRate
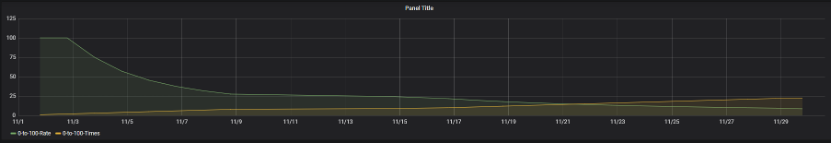
Return:

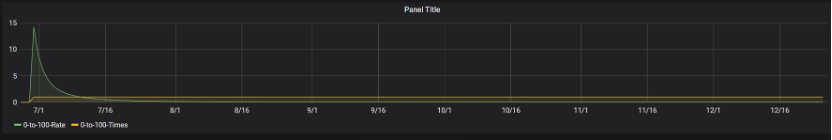
Timeseries format:
- target: “Parameter Name-Rate”
- datapoints:
- Pass rate
- datapoints:
- target: “Parameter Name-Times”
- datapoints:
- Number of days that "pass"
- datapoints:
PassRateTrend
Function name translation:
en: ['PassRateTrend'],
            zh_cn: ['合格率趋势'],
            zh_tw: ['合格率趨勢'],
            ja: ['パスレート傾向']
Description:
Return the daily pass rate for the given parameter within the TimeRange range, in timeseries format. The pass rate calculation method follows the one specified in the "PassRate" reference.
In the formula of the PassRate function, the total number of days to be calculated will accumulate with the dates. For example, if your time range is from January 1st to January 31st, then:
- The total number of days on January 1st is from January 1st to January 1st, which is 1.
- The total number of days on January 2nd is from January 1st to January 2nd, which is 2.
- The total number of days on January 3rd is from January 1st to January 3rd, which is 3.
- ... and so on.
Input:

- GroupPath
- Object
- ObjectParam: A parameter that specify pass or not. For the meanning of the parameter value:
- any value less or equal to 0: means fail
- any value greater than 0, means pass
- TimeRange:Dashboard.TimeRange, range of days to be calculated
- FunctionType:PassRateTrend
Return:
Timeseries format:
- target: “Parameter Name-Rate”
- datapoints:
- Pass rate
- datapoints:
- target: “Parameter Name-Times”
- datapoints:
- Number of days that "pass"
- datapoints:
FailRate
Function name translation:
en: ['FailRate'],
zh_cn: ['异常率'],
zh_tw: ['异常率'],
ja: ['異常率']
Description:
Return the percentage of days for a parameter with valid data less or equal to 0 within the TimeRange, which is calculated by (number of days with valid data less or equal to 0 / total number of days with valid data) * 100%, and return the result in timeseries format.
Input:
- GroupPath
- Object
- ObjectParam: A parameter that specify pass or not. For the meanning of the parameter value:
- any value less or equal to 0: means fail
- any value greater than 0, means pass
- TimeRange:Dashboard.TimeRange, range of days to be calculated
- FunctionType:FailRate
Return:

Timeseries format:
- target: “Parameter Name-Rate”
- datapoints:
- Fail rate
- datapoints:
- target: “Parameter Name-Times”
- datapoints:
- Number of days that "fail"
- datapoints:
FailRateTrend
Function name translation:
en: ['FailRateTrend'],
zh_cn: ['异常率趋势'],
zh_tw: ['异常率趨勢'],
ja: ['異常率トレンド']
Description:
Return the daily fail rate for the given parameter within the TimeRange range, in timeseries format. The fail rate calculation method follows the one specified in the "FailRate" reference.
In the formula of the FailRate function, the total number of days to be calculated will accumulate with the dates. For example, if your time range is from January 1st to January 31st, then:
- The total number of days on January 1st is from January 1st to January 1st, which is 1.
- The total number of days on January 2nd is from January 1st to January 2nd, which is 2.
- The total number of days on January 3rd is from January 1st to January 3rd, which is 3.
- ... and so on.
Input:
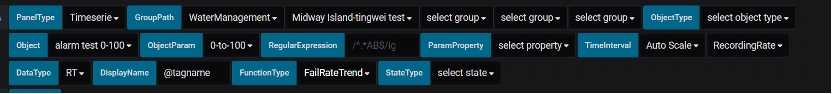
- GroupPath
- Object
- ObjectParam: A parameter that specify pass or not. For the meanning of the parameter value:
- any value less or equal to 0: means fail
- any value greater than 0, means pass
- TimeRange:Dashboard.TimeRange, range of days to be calculated
- FunctionType:FailRateTrend
Return:
Timeseries format:
- target: “Parameter Name-Rate”
- datapoints:
- Fail rate
- datapoints:
- target: “Parameter Name-Times”
- datapoints:
- Number of days that "fail"
- datapoints:
InspectionAreaStats (Not enabled in EdgeHub v2.1 above)
Function name translation:
en: ['inspectionAreaStats'],
zh_cn: ['巡检区域统计'],
zh_tw: ['巡檢區域統計'],
ja: ['巡回検査区域統計']
Description:
Return the yearly statistics of patrol area of this tenant (root group) in timeserie format.
Input:
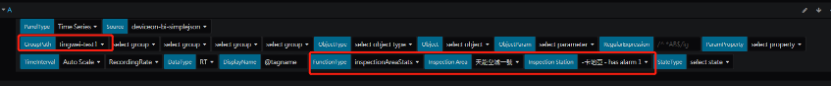
- GroupPath
- Object
- FunctionType:inspectionAreaStats
- InspectionArea:inspection area
- InspectionStation: inspection station
Return:

Timeserie format
- target: “Total Hours”
- datapoints:
- Sum of partol hours
- datapoints:
- target: “Total Times”
- datapoints:
- Number of patrols
- datapoints:
- target: “Total Complete”
- datapoints:
- Total finished tasks
- datapoints:
- target: “Commit Complete”
- datapoints:
- Review result: Number of completed tasks this month
- datapoints:
- target: “Commit Redo”
- datapoints:
- Review result: Number of tasks that unchecked and redo this month
- datapoints:
- target: “Commit End”
- datapoints:
- Review result: Number of tasks that unchecked and close this month
- datapoints:
InspectionStationStats (Not enabled in EdgeHub v2.1 above)
Function name translation:
en: ['inspectionStationStats'],
zh_cn: ['巡检站点回报统计'],
zh_tw: ['巡檢站點回報統計'],
ja: ['巡回サイト収益統計']
Description:
Return the inspection station status of this tenant (root group) in timeserie format.
Input:

- GroupPath
- Object
- FunctionType:inspectionAreaStats
- InspectionArea:inspection area
- InspectionStation: inspection station
Return:

Timeserie format:
- target: “Total Times”
- datapoints:
- Total times of inspection report
- datapoints:
- target: “Schedule Abnormal”
- datapoints:
- Number of abnormal report from regular patrols
- datapoints:
- target: “Accidental Abnormal”
- datapoints:
- Number of abnormal report from onsite issues
- datapoints:
InspectionHistory (Not enabled in EdgeHub v2.1 above)
Function name translation:
en: ['inspectionHistory'],
zh_cn: ['巡检记录'],
zh_tw: ['巡檢紀錄'],
ja: ['巡検記録']
Description:
Return the inspection historical data within timerange of this tenant (root group) in table format.
Input:

- GroupPath
- Object
- FunctionType:inspectionHistory
- InspectionArea:inspection area
- InspectionStation: inspection station
Return:
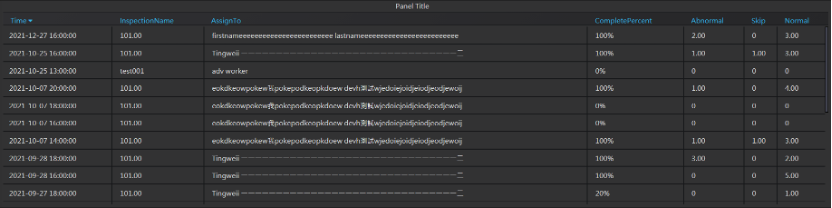
Table format:
- ScheduleTime:Patrol time
- InspectionName:Patrol name
- AssignTo:Patrol owner
- CompletePercent:complete percent of the patrol
- Abnormal:Count of abnormal tasks
- Skip:Count of skip tasks
- Normal:Count of normal tasks